
GPA-MARV is uniformly lethal in ferrets
To determine whether GPA-MARV or MA-MARV caused disease in ferrets, groups of six male and female ferrets were inoculated with 1000 TCID50 of each virus. A third group of ferrets was inoculated with GPA-EBOV as a control. Remarkably, GPA-MARV resulted in uniform lethality, with all animals succumbing to disease at 10 dpi (Fig. 1a). These animals began manifesting clinical signs of FVD at 7-8 dpi, which coincided with weight loss and an increase in body temperature (Fig. 1b, c). Beyond 8 dpi, disease progressed rapidly, with the most notable signs of disease being significantly decreased activity, inappetence, and a hunched posture with ruffled fur. Two of the six ferrets challenged with GPA-MARV demonstrated a petechial rash observable roughly 24–48 h prior to the time of euthanasia (Fig. 2a). Additionally, a few animals showed signs of hemorrhage other than a rash, including blood in the stool as well as some orifices, including nose and eyes.
Fig. 1: Clinical parameters of ferrets inoculated with rodent-adapted Marburg viruses.
Clinical parameters of ferrets (n = 6 per group) inoculated with GPA-MARV (a–c) or MA-MARV (d–f). Kaplan-Meier survival curves (a, d), percent weight change (b, e), microchip scan temperature (c, f). Data from each animal are depicted as dots with individual animal IDs and sex (Female, F and Male, M) indicated in the key.
Fig. 2: Rash observed among ferrets infected with rodent-adapted Marburg viruses.
Representative images of rashes observed at the terminal timepoint. Petechial rash among GPA-MARV-challenged ferrets (a) and no rash among MA-MARV-challenged ferrets (b).
MA-MARV resulted in partial lethality among infected ferrets, with two of the six animals (33%) euthanized on 8 and 9 dpi (Fig. 1d). These two animals exhibited signs of disease that appeared less severe than those observed for GPA-MARV, with weight loss progressing gradually from 3 dpi until euthanasia and temperatures staying within normal range or mildly elevated (Fig. 1e, f). Neither of the animals that succumbed developed a rash at any point (Fig. 2b). The other four MA-MARV-challenged animals did not exhibit any signs of disease (Fig. 1d–f).
By comparison, all ferrets challenged with GPA-EBOV succumbed to disease by 5 dpi (Supplementary Fig. 1a). These animals manifested clinical signs of disease that closely paralleled what has been observed previously for EBOV4,7 (Supplementary Fig. 1a–c). In contrast to GPA-MARV-challenged ferrets, among which only two animals developed a petechial rash, all GPA-EBOV-challenged ferrets exhibited a maculopapular rash (Supplementary Fig. 1d). Notably, the rash observed among GPA-MARV-challenged animals differed from that observed among GPA-EBOV-challenged animals, with the latter displaying a maculopapular rash that blanched upon applying pressure.
GPA-MARV replicates to high levels in ferrets
All animals infected with GPA-MARV were viremic on 5 dpi, with low levels of viral RNA detectable in the blood (mean 3.40 Log10 GEQ/mL). Levels of viral RNA increased moderately by 7 dpi with a mean terminal level of 9.07 Log10 GEQ/mL (Fig. 3a). Oral, rectal and nasal swabs were weakly positive from 5-7 dpi, and mean viral RNA levels increased to 5.97, 7.78, 6.38 Log10 GEQ/mL, respectively, at the time of euthanasia (Supplementary Fig. 2a–c). Tissues were uniformly positive for viral RNA at the time of euthanasia, with liver, spleen and lymph nodes having the highest mean levels of viral RNA, at 7.73, 7.14 and 7.03 Log10 GEQ/g, respectively (Fig. 3b). Levels of infectious virus in the blood and tissues paralleled the levels of viral RNA (Fig. 3c, d), while the swabs were weakly positive for infectious virus (data not shown).
Fig. 3: Viral load in blood and tissues of ferrets infected with rodent-adapted Marburg viruses.
Whole blood (a, c, e) was collected from each animal at 3, 5, 7, 10, 14 and 21 days post-infection (dpi) and at the time of euthanasia, while tissues (liver, spleen, kidney, heart, lung, gonadal white adipose tissue (GWAT), testes, ovaries, brown adipose tissue (BAT), eye, brain, and lymph node (LN)) were collected upon necropsy to evaluate viral loads among animals challenged with GPA-MARV (a–d) and MA-MARV (e–g). Virus RNA was quantified by RT-qPCR (a, b, e, f, g), and infectious virus was quantified by TCID50 (c, d). Results are depicted in genome equivalents per mL (GEQ/mL) for each animal (indicated by a square for males and a circle for females) or mean tissue culture infectious dose per mL (TCID50/mL) or per g (TCID50/g) depicted as histograms, with data from each animal depicted as dots. Individual animal IDs and sex (Female, F and Male, M) are indicated in the key. Note: virus isolation was only performed on samples positive by RT-qPCR with a CT cutoff of ≤34.
In contrast, all MA-MARV-challenged animals were viremic at 5 dpi, with mean levels of viral RNA in the blood of 4.85 Log10 GEQ/mL (Fig. 3e). Levels of viral RNA in the blood increased slightly at 7 dpi, with mean levels of 5.61 Log10 GEQ/mL, and began to decrease thereafter in all surviving animals (Fig. 3e). The two animals that succumbed to disease had mean viral RNA levels of 6.03 Log10 GEQ/mL in the blood at the time of euthanasia (Fig. 3e). Swabs were mostly negative throughout the duration of the study, with the most positives being found in oral swabs at 7 dpi (Supplementary Fig. 2g–i). The two animals that succumbed to disease at 8 and 9 dpi were uniformly positive for viral RNA across all tested tissues; however, levels were considerably lower than those observed for GPA-MARV (Fig. 3f). Among the surviving animals at 21 dpi, the spleen was weakly positive for viral RNA, while a single animal showed low levels of viral RNA in the BAT and LN (Fig. 3g).
Viral replication kinetics for GPA-EBOV-challenged animals closely paralleled what has been observed previously7, with mean peak levels of 10.95 Log10 GEQ/mL in the blood at time of euthanasia on 4 dpi (Supplementary Fig. 3a). Likewise, all tissues and swabs were uniformly positive for viral RNA and infectious virus at time of euthanasia (Supplementary Fig. 2d–f and Supplementary Fig. 3b). Overall, levels of viral RNA at the time of euthanasia were ~2 Log10 GEQ/mL greater among GPA-EBOV-challenged animals compared to GPA-MARV-challenged animals.
GPA-MARV causes deviations in hematological parameters
GPA-MARV-challenged animals demonstrated deviations in blood biochemistry characteristic of FVD. ALT levels were elevated in most animals as early as 3 dpi, reaching the upper limit of quantification (2000 U/L) in three animals (450 M, 854 F and 184 F) at the time of euthanasia (Fig. 4a). Because the remaining three animals (484 M, 492 M and 125 F) were found dead on 10 dpi, no hematology data were available at this timepoint. ALP, TBIL and BUN levels were relatively stable throughout 7 dpi but were elevated at 10 dpi for 450 M, 854 F and 184 F (Fig. 4b–d). The remaining analytes, namely, ALB, AMY, Ca2+, PHOS, CRE, GLU, Na+, K+, TP and GLOB, were mostly unremarkable, except AMY, PHOS and K+, which was elevated for a single animal (184 F) at the time of euthanasia (Supplementary Fig. 4).
Fig. 4: Select biochemistries and blood cell counts in ferrets infected with rodent-adapted Marburg viruses.
Whole blood was collected from each animal on days 0, 3, 5, 7, 10, 14 and 21 days post-infection (dpi) as well as at the time of euthanasia to evaluate serum biochemistry (a–h) and blood cell counts (i–p). Biochemistry analytes measured are as follows: alanine aminotransferase [ALT]; alkaline phosphatase [ALP]; total bilirubin [TBIL], and blood urea nitrogen [BUN]. Complete blood count analytes measured are as follows: white blood cells [WBC]; lymphocytes [LYM]; neutrophils [NEU]; platelets [PLT]. Individual animal IDs and sex (Female, F and Male, M) are indicated in the key. Gray shaded regions represent the mean baseline values ± 2 standard deviations, calculated from historical pre-challenge serum samples. Note: Partial timepoint sampling was performed for animals that succumbed to disease or met humane endpoint criteria prior to the scheduled end of the study. This includes all animals in the GPA-MARV group, as well as animals 761 F and 841 F in the MA-MARV group.
With respect to MA-MARV, ALT levels for the non-surviving animals (761 F and 841 F) were elevated as early as 3 dpi and continued to increase until reaching the upper limit of quantification (ULOQ) at the time of euthanasia (Fig. 4e). ALT levels for the surviving animals peaked at 7 dpi, after which they gradually decreased (Fig. 4e). Levels of ALP and BUN remained mostly within the normal range throughout 21 dpi (Fig. 4f, h). Interestingly, TBIL levels were within normal range for males but elevated for females throughout the study (Fig. 4g). Also of note, GLOB levels increased for all animals as early as 3 dpi and peaked at 7 dpi before returning to baseline at 21 dpi (Supplementary Fig. 4).
In GPA-EBOV-challenged animals, ALT, ALP, TBIL and BUN were elevated at the time of euthanasia, consistent with what is seen among ferrets challenged with EBOV4 (Supplementary Fig. 4). Unlike GPA-MARV, levels of PHOS, CRE, K+ and GLOB were also elevated among GPA-EBOV-challenged animals at euthanasia (Supplementary Fig. 4).
GPA-MARV and MA-MARV challenged animals all demonstrated lymphopenia and thrombocytopenia at the time of euthanasia (Fig. 4j, l, n, p). In the case of MA-MARV platelets reached their lowest levels at 7 dpi and gradually returned to normal levels among survivors by the study end (Fig. 4p). No discernable trend among white blood cell levels could be observed for GPA-MARV challenged animals (Fig. 4i). In contrast, MA-MARV-challenged animals 915 M and 538 F demonstrated elevated white blood cell levels at 10 dpi, which returned to baseline levels by study end (Fig. 4m). Interestingly, neutrophils were elevated at 5 dpi among GPA-MARV-challenged animals and returned to baseline prior to the time of euthanasia (Fig. 4k). In contrast, MA-MARV-challenged animals demonstrated elevated levels of neutrophils at 3 dpi, which decreased at 7 dpi followed by and increase thereafter among surviving animals (Fig. 4o). Lastly, GPA-EBOV-challenged animals demonstrated trends consistent with what has been shown previously among ferrets infected with EBOV (Supplementary Fig. 5).
Infected ferrets demonstrate a dysregulated immune response
Ferret serum samples were subjected to a 12-plex ferret cytokine panel to investigate changes in the cytokine profile that occurred following infection. In GPA-MARV-challenged animals, the proinflammatory cytokines IFN-α, IL-6, IL-8, IP-10 and MCP-1 all increased following infection, with levels peaking in most animals at the time of euthanasia (Fig. 5a–e). Notably, these cytokines were all substantially elevated relative to historical control animals challenged with wild type MARV (Fig. 5a–e). Interestingly, animal 492 M showed consistently elevated levels of TNF-α, IL-12P70, IL-12p40, IL-17 and IL-2 compared to all other animals challenged with GPA-MARV (Fig. 5 and Supplementary Fig. 7). Cytokine levels for TNF-α, IL-12P70, IL-12p40, IL-17, IL-2, IL-4 and MIP-1β showed considerable fluctuation throughout the course of disease with no discernable trends (Fig. 5 and Supplementary Fig. 7).
Fig. 5: The cytokine/chemokine response in ferrets challenged with rodent-adapted Marburg viruses.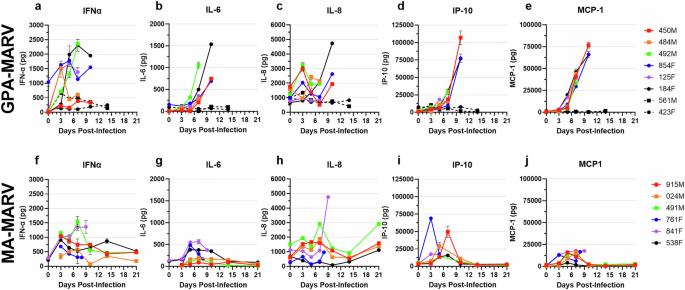
Serum was collected from each animal challenged with GPA-MARV (a–e) or MA-MARV (f–j) at 0, 3, 5, 7, 10, 14 and 21 days post-infection (dpi) as well as at the time of euthanasia to evaluate cytokine/chemokine profiles using a 12-plex ferret Luminex assay. Analytes measured are as follows: Interferon-alpha [IFNα]; interleukin-6 [IL-6]; interleukin-8 [IL-8]; Interferon gamma-induced protein 10 [IP-10]; monocyte chemoattractant protein-1 [MCP-1]. Individual animal IDs and sex (Female, F and Male, M) are indicated in the key. Animals 561 M and 423D, denoted by hashed lines, reflect historical control sera from ferrets challenged with wild type and MARV (n = 2) from a previously published study7.
Trends observed for MA-MARV-challenged animals deviated from those observed among GPA-MARV-challenged animals. The dramatically elevated levels of IFN-α, IL-6, and MCP-1 observed among GPA-MARV-challenged animals were absent among MA-MARV-challenged animals (Fig. 5f, g, j). Nonetheless, slight increases were seen among these analytes around 5-7 dpi; however, these levels normalized by 10 dpi in the survivors (Fig. 5f, g, j). Interestingly, levels of IL-8 increased in all animals around 7 dpi, coinciding with disease onset and clinical scoring among the two animals that succumbed. Among the surviving animals, IL-8 levels decreased at 14 dpi only to increase again at the time of euthanasia (Fig. 5h). For unknown reasons, levels of IL-17 and IL-4 were elevated throughout the study for 841 F and 538 F compared to animals of the same challenge group (Supplementary Fig. 7). The levels of the remaining analytes, TNF-α, IP-10, IL-12p70, IL-12p40, IL-2, MCP-1 and MIP-1β, fluctuated, with peaks observed around 7 dpi followed by decreases thereafter (Fig. 5 and Supplementary Fig. 7).
In general, trends observed among GPA-EBOV-challenged animals were similar to those observed among GPA-MARV-challenged animals, and they closely paralleled those observed among historical control animals challenged with wild type EBOV (Fig. 5 and Supplementary Fig. 6). In particular, IL-6 and IL-8 levels in GPA-EBOV-challenged animals at the terminal timepoint far exceeded those observed at the terminal timepoints in GPA-MARV-challenged animals (Supplementary Fig. 6). IP-10 was also elevated at the terminal timepoint among GPA-EBOV-challenged animals, although to levels lower than those observed for GPA-MARV (Supplementary Fig. 6). Levels of IFNα, TNFα, IL-12p70, IL-17, IL-2, IL-4 and MIP-1β showed fluctuations throughout the disease course with no discernable trends (Supplementary Fig. 6).
GPA-MARV acquired several mutations following challenge
To track changes in the virus genome throughout the course of infection, whole blood collected at 3, 5, and 7 dpi and at the time of euthanasia, along with tissues, were subjected to NGS. In total, 28 mutations were identified within GPA-MARV, of which eight were located within coding regions (Table 1 and Supplementary Figs. 8, 9). All of these mutations were found in each GPA-MARV-challenged animal in all tissues and blood samples. All mutations within the coding regions—except a single mutation in VP35 were non-synonymous, including one in NP (F287L), two in VP35 (L30S and Y34H), three in VP40 (K56N, G79S and D184N) and one in VP24 (I66V). Each of these non-synonymous mutations was present within the virus challenge stock at frequencies below 25% except K56N in VP40 which was present at a frequency of 34.01% (Table 1); however, all reached the consensus threshold frequency of ≥50%, with the majority present at a frequency of ≥75%. The remaining 20 mutations were silent and located either within UTRs or intergenic regions (Table 1). In addition to these 28 mutations, several additional mutations were present; however, most were unique to a single animal or tissue and demonstrated no discernible trends of interest. Unfortunately, given the low viral load among MA-MARV-challenged animals NGS was not feasible.
Table 1 Summary of mutations present in blood and tissues of GPA-MARV challenged ferrets