Euro area
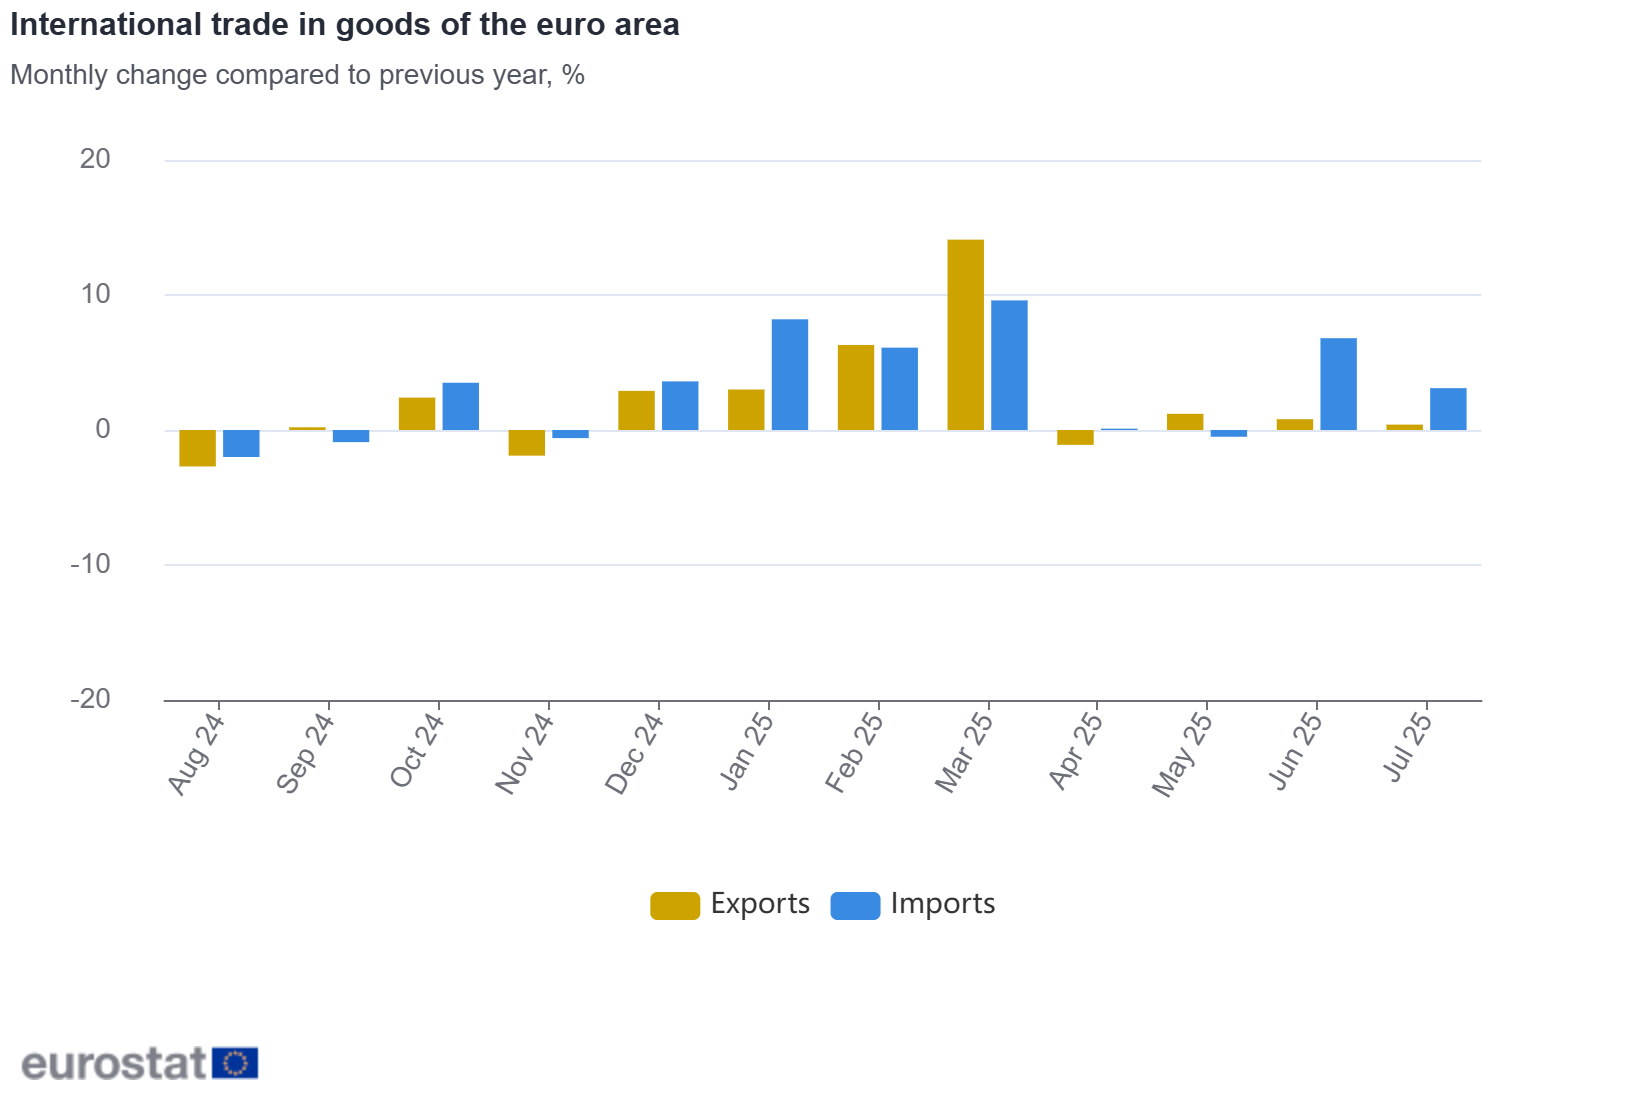
The first estimates of euro area balance showed a €12.4 bn surplus in trade in goods with the rest of the world in July 2025, compared with + €18.5 bn in July 2024.
The euro area exports of goods to the rest of the world in July 2025 were €251.5 bn, an increase of 0.4% compared with July 2024 (€250.4 bn).
Imports from the rest of the world stood at €239.1 bn, a rise of 3.1% compared with July 2024 (€231.9 bn).
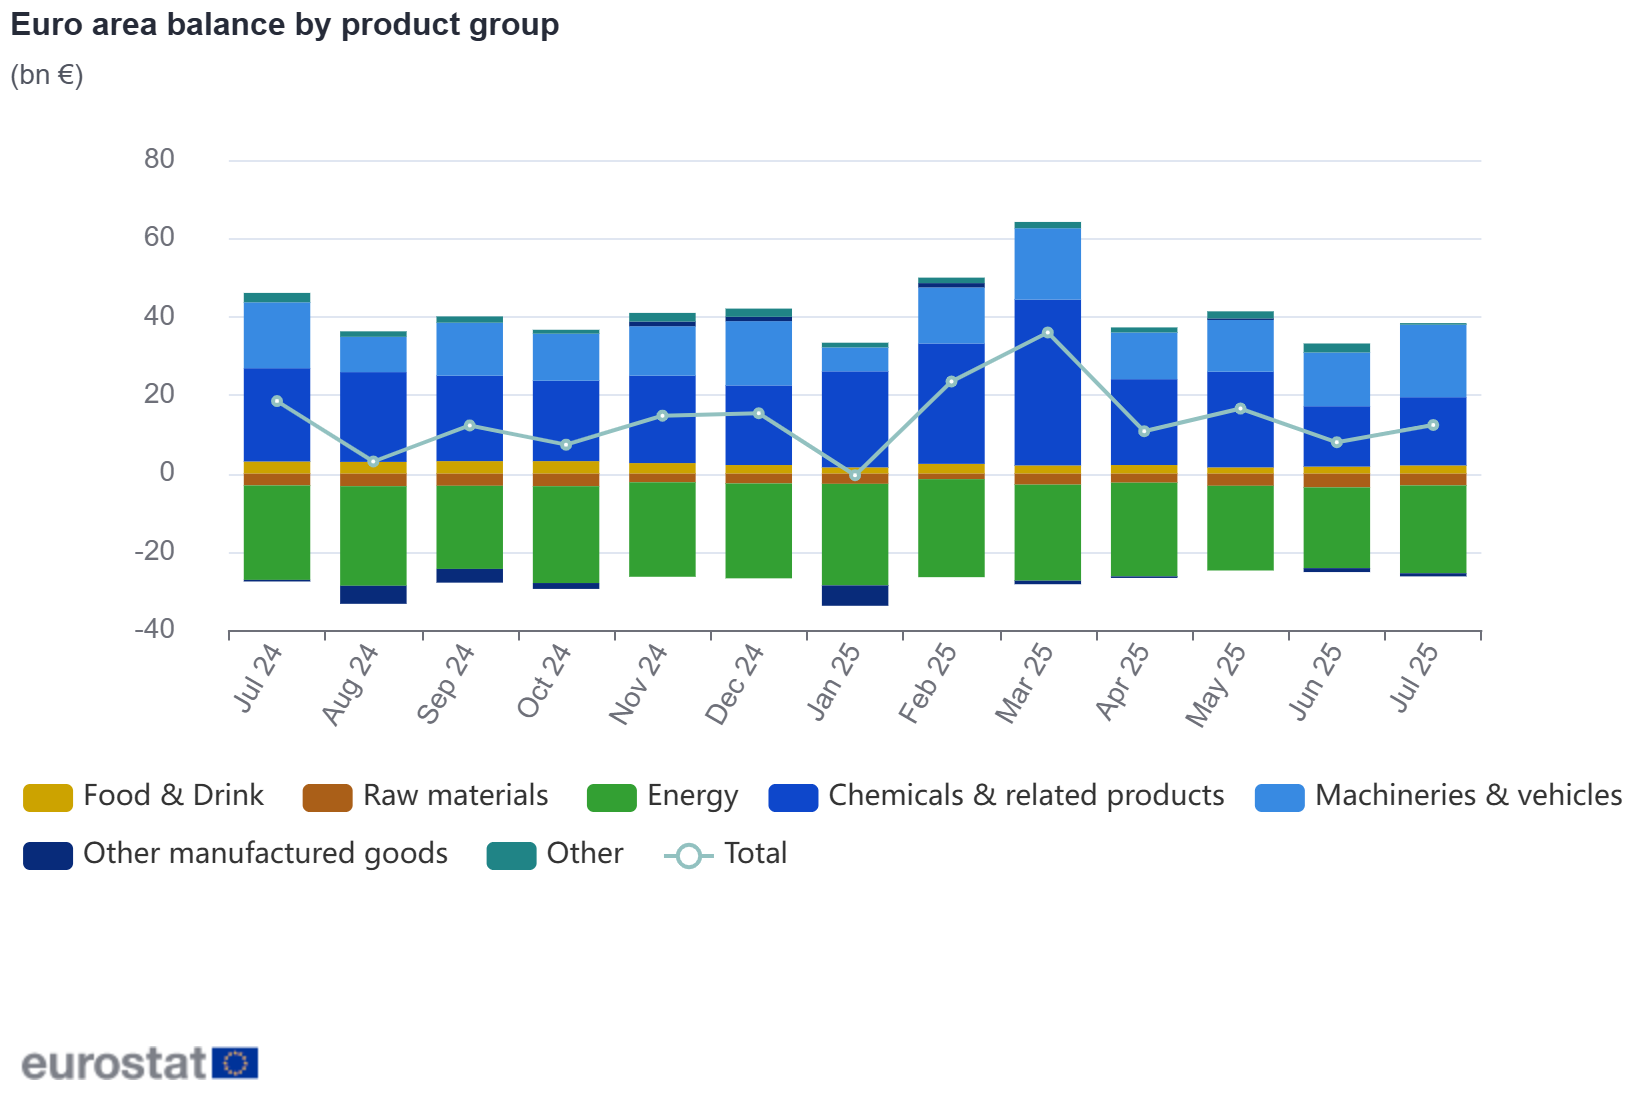
In July 2025, the euro area balance increased compared to June 2025, with the surplus rising from €8.0 billion to €12.4 bn. This improvement was predominantly due to rising surpluses in chemicals and related products, which increased from €15.4 bn to €17.4 bn. and machinery & vehicles, which rose from €13.7 bn to €18.5 bn.
Compared to July 2024, the euro area balance decreased by €6.1 bn, mainly attributed to chemicals and related products, which experienced a decline in surplus from €23.8 bn to €17.4 bn.
In January to July 2025, the euro area recorded a surplus of €106.9 bn, compared with €120.4 bn in January-July 2024.
The euro area exports of goods to the rest of the world rose to €1 739.3 bn (an increase of 3.5% compared with January-July 2024), and imports rose to €1 632.4 bn (an increase of 4.7% compared with January-July 2024).
Intra-euro area trade rose to €1 549.8 bn in January-July 2025, up by 1.6% compared with January-July 2024.
Euro area trade – non seasonally adjusted data (bn €)
Flows
Jul 24
Jul 25
Growth
Jan-Jul 24
Jan-Jul 25
Growth
250.4
251.5
0.4%
1 679.9
1 739.3
3.5%
231.9
239.1
3.1%
1 559.5
1 632.4
4.7%
18.5
12.4
120.4
106.9
221.9
226.1
1.9%
1 525.0
1 549.8
1.6%
European Union
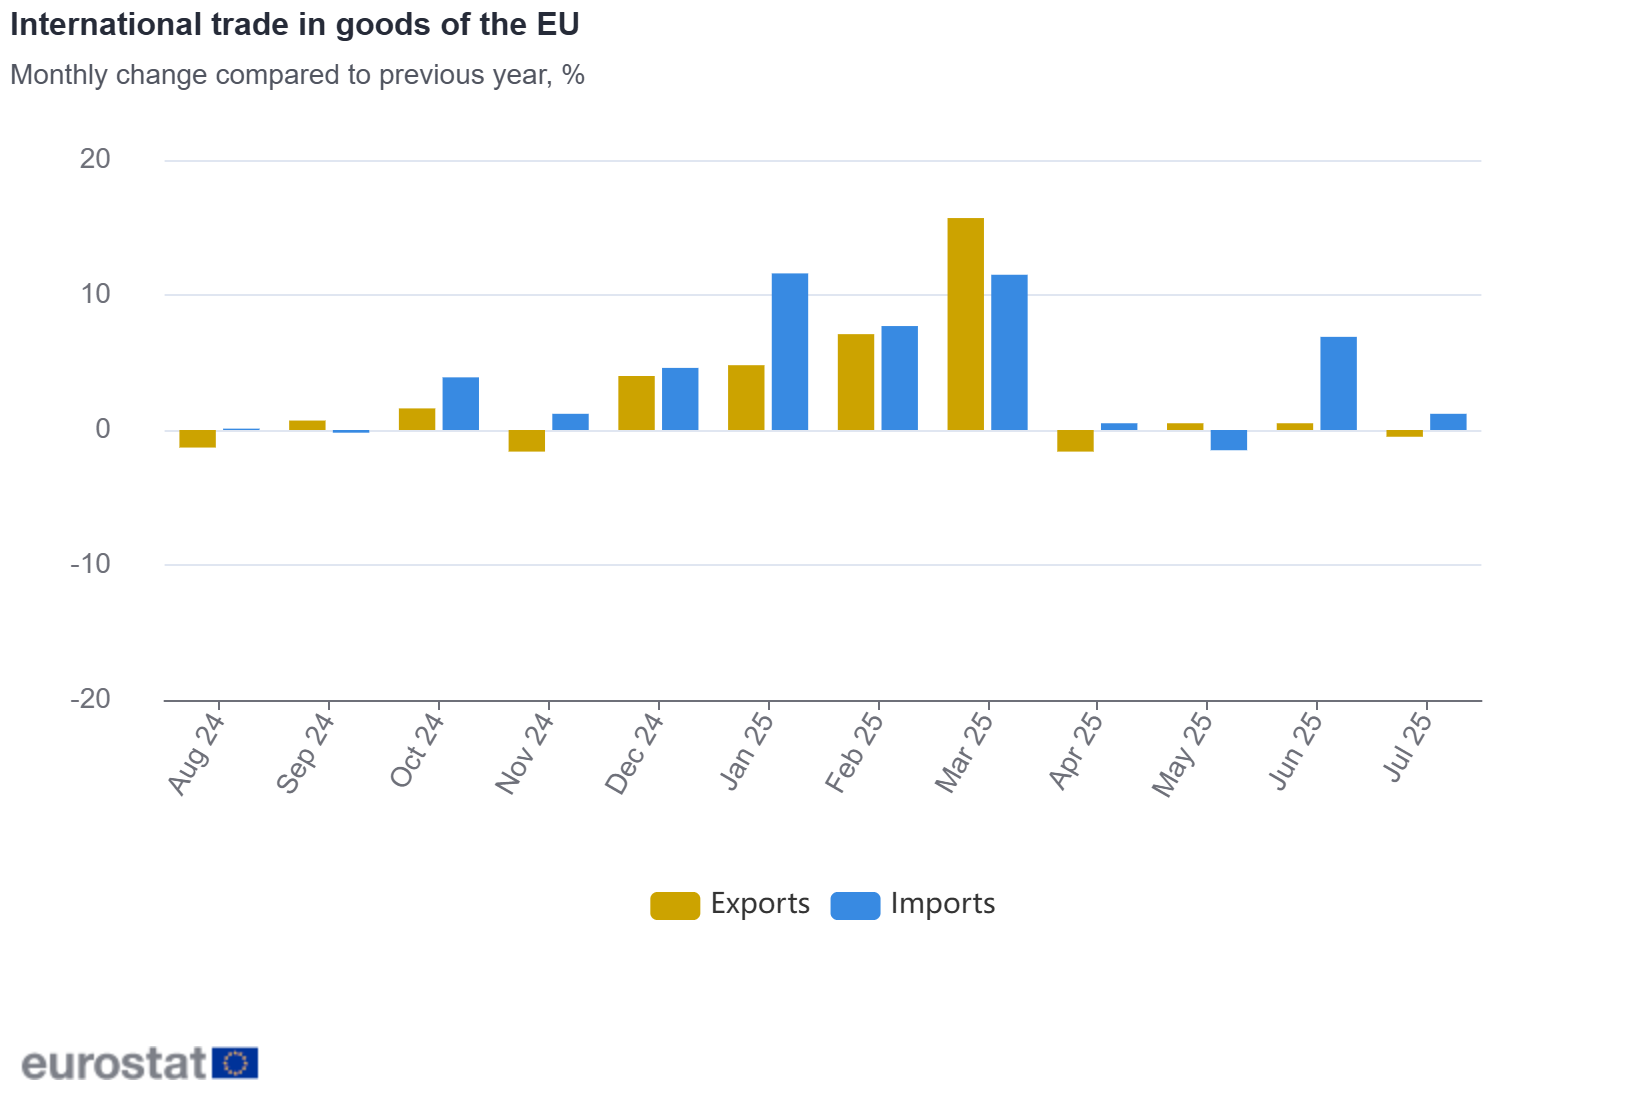
The EU balance showed a €12.1 bn surplus in trade in goods with the rest of the world in July 2025, compared with +€15.9 bn in July 2024.
The extra-EU exports of goods in July 2025 were €227.7 bn, down by 0.5% compared with July 2024 (€228.8 bn).
Imports from the rest of the world stood at €215.6 bn, up by 1.2% compared with July 2024 (€213.0 bn).
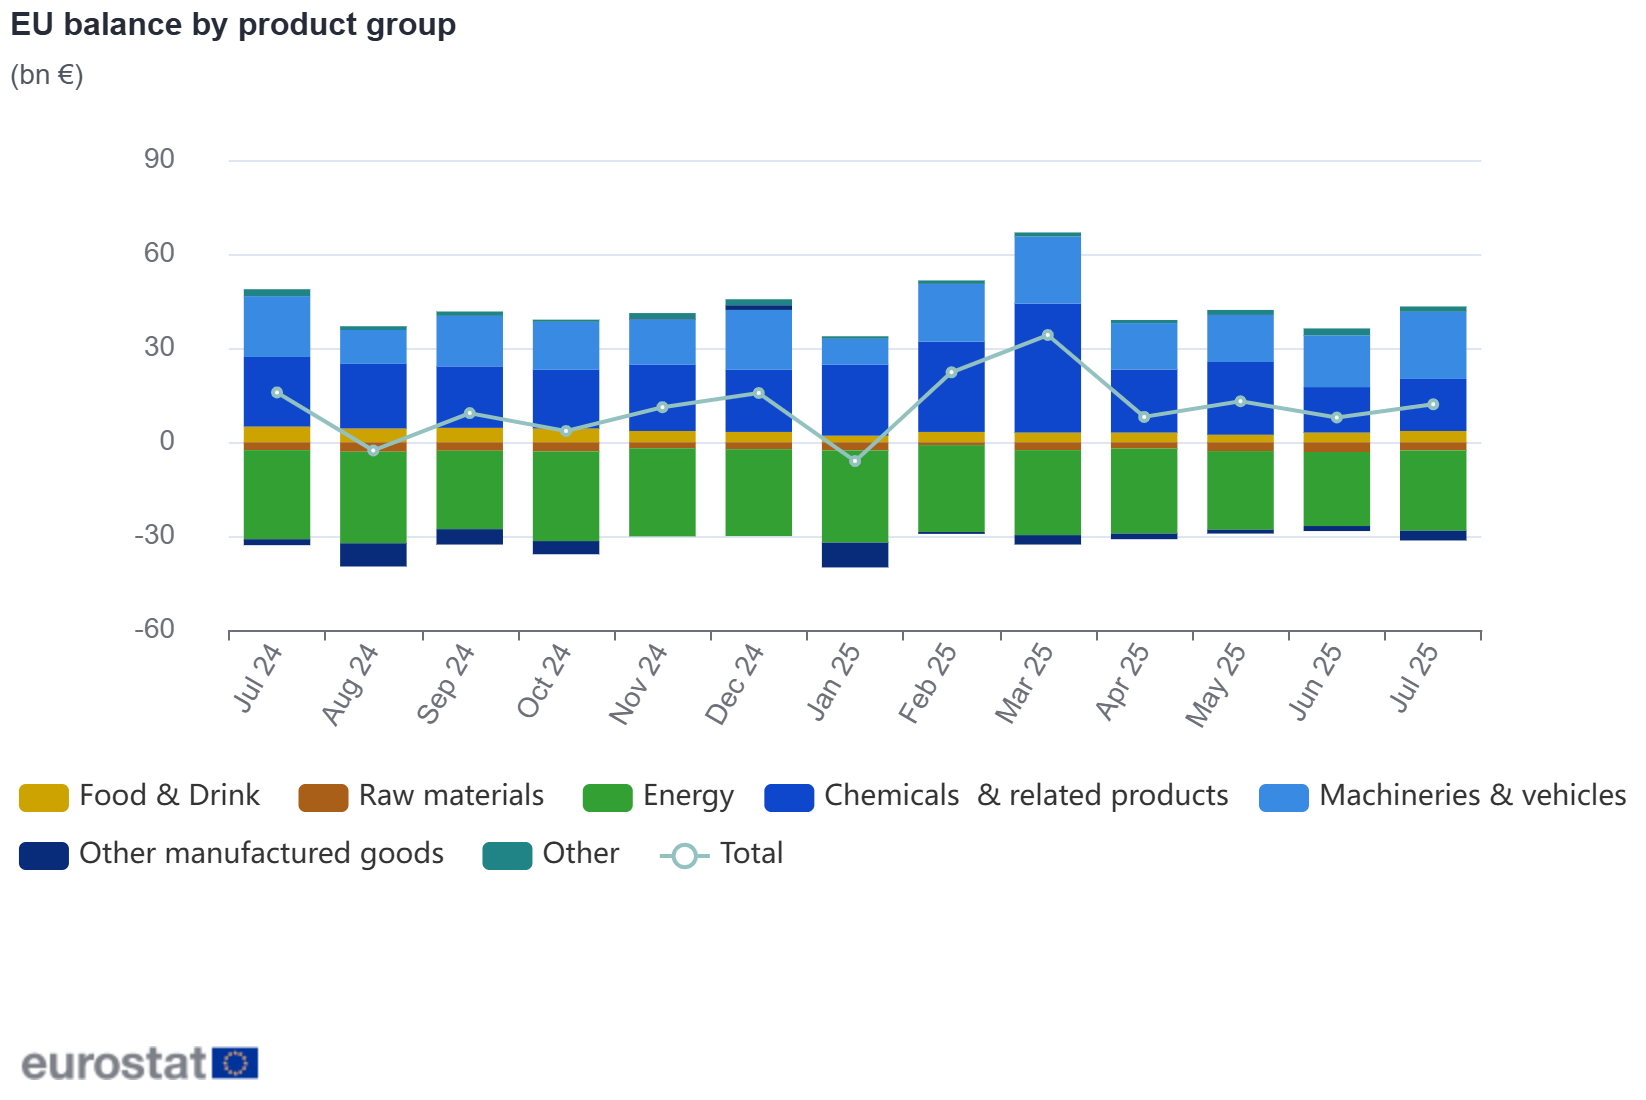
In July 2025, the EU balance increased compared to June 2025, with the surplus rising from €7.9 bn to €12.1 bn. This improvement was primarily driven by increases in the surpluses of chemicals and related products, which rose from €14.5 bn to €16.6 bn, and machinery & vehicles, which rose from €16.5 bn to €21.4 bn.
Compared to July 2024, the EU balance decreased by €3.8 bn, largely due to a reduction in the surplus of chemicals from €22.2 bn to €16.6 bn, and other manufactured goods, with a deficit widening from -€1.9 bn to -€3.1 bn.
In January to July 2025, the EU recorded a surplus of €91.8 bn, compared with €108.9 bn in January-July 2024.
The extra-EU exports of goods rose to €1 570.4 bn (an increase of 3.8% compared with January-July 2024), and imports rose to €1 478.6 bn (an increase of 5.3% compared with January-July 2024).
Intra-EU trade rose to €2 426.3 bn in January-July 2025, +1.9% compared with January-July 2024.
EU trade – non seasonally adjusted data (bn €)
Flows
Jul 24
Jul 25
Growth
Jan-Jul 24
Jan-Jul 25
Growth
228.8
227.7
-0.5%
1 513.6
1 570.4
3.8%
213.0
215.6
1.2%
1 404.7
1 478.6
5.3%
15.9
12.1
108.9
91.8
339.4
349.2
2.9%
2 380.6
2 426.3
1.9%
Main products – EU
Bn €, monthly change compared to previous year
Extra-EU exports
Extra-EU imports
Trade balance
Jul 25
Growth rates
Jul 25
Growth rates
Jul 25
Jul 24
227.7
-0.5%
215.6
1.2%
12.1
15.9
34.2
-5.8%
58.7
-5.7%
-24.5
-25.9
18.7
1.6%
15.1
12.7%
3.6
5.0
5.5
-5.3%
8.1
-3.3%
-2.6
-2.5
10.0
-17.3%
35.5
-12.2%
-25.5
-28.4
188.9
0.3%
154.0
3.6%
34.9
39.6
47.0
-5.1%
30.4
11.2%
16.6
22.2
92.3
4.0%
70.9
2.1%
21.4
19.4
49.6
-0.7%
52.7
1.6%
-3.1
-1.9
4.5
7.1%
2.9
38.9%
1.6
2.2
Main trading partners – EU
Bn €, monthly change compared to previous year
Extra-EU exports
Extra-EU imports
Trade balance
Jul 25
Growth rates
Jul 25
Growth rates
Jul 25
Jul 24
44.2
-4.4%
31.2
10.7%
13.0
18.0
17.6
-6.6%
48.3
3.9%
-30.7
-27.6
30.8
2.9%
14.1
0.6%
16.7
15.9
17.8
9.4%
11.7
6.8%
6.1
5.3
10.2
7.6%
9.4
9.2%
0.8
0.9
5.2
10.9%
7.8
-9.5%
-2.6
-3.9
6.1
-8.0%
5.4
3.7%
0.7
1.4
5.0
10.6%
5.8
-0.5%
-0.8
-1.3
4.1
-9.4%
5.9
-7.1%
-1.8
-1.8
5.0
1.2%
3.2
21.7%
1.8
2.3
Annex – Seasonally adjusted data
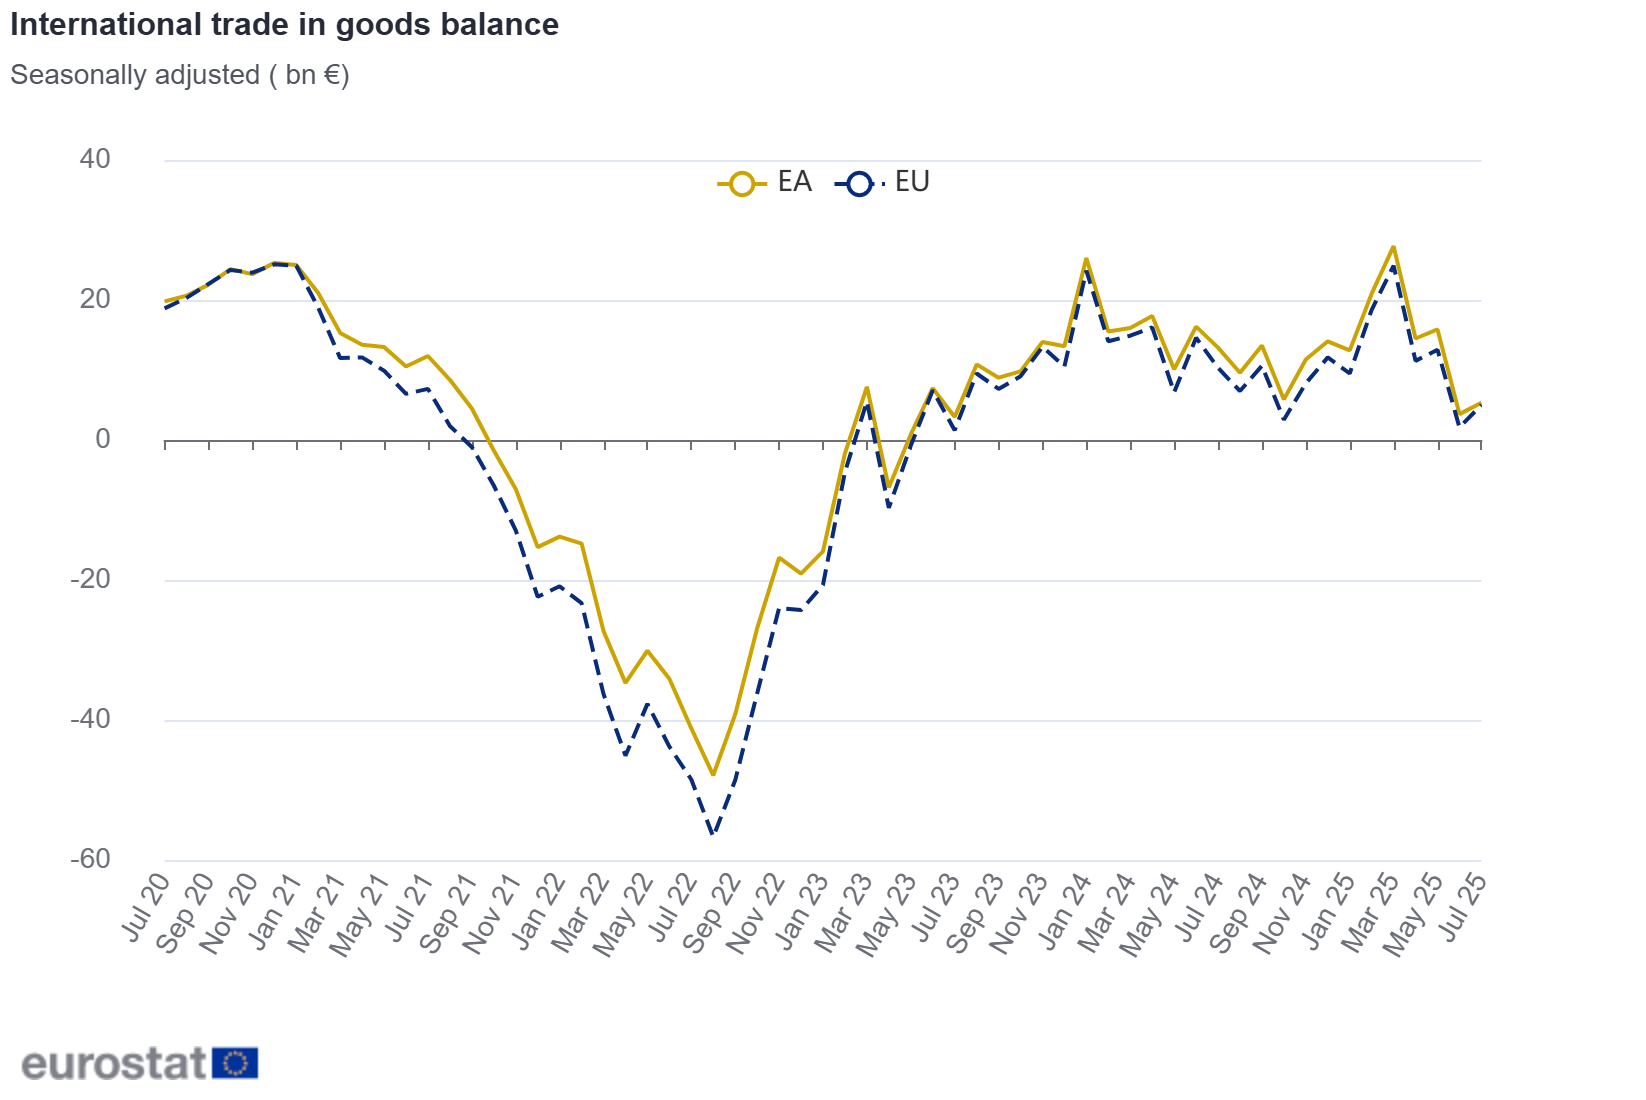
In July 2025 compared with June 2025, euro area seasonally adjusted exports decreased by 0.1%, while imports decreased by 0.8%. The seasonally adjusted balance was €5.3 bn, an increase compared with June (€3.7 bn).
In July 2025 compared with June 2025, EU seasonally adjusted exports decreased by 0.4%, while imports decreased by 2.0%. The seasonally adjusted balance was €5.0 bn, an increase compared with June (€1.8 bn).
In May-July 2025, euro area exports to non-EA countries fell by 6.5%, while imports fell by 1.6%. Intra-EA trade rose by 0.5%.During the same period, EU exports to non-EU countries decreased by 7.4%, while imports fell by 2.6%. Intra-EU trade increased by 0.3%.
EA and EU trade – seasonally adjusted data – (bn €)
Jun 25
Jul 25
growth rates
May-Jul 25
Growth rates (compared to the previous three months)
238.0
237.8
-0.1%
719.1
-6.5%
234.3
232.5
-0.8%
694.3
-1.6%
3.7
5.3
24.8
219.0
219.5
0.2%
655.4
0.5%
214.2
213.3
-0.4%
646.2
-7.4%
212.5
208.3
-2.0%
626.5
-2.6%
1.8
5.0
19.7
344.2
344.7
0.2%
1 029.8
0.3%
Notes for users
Revisions and timetable
This News Release is based on information transmitted by Member States to Eurostat before10 Sep 2025 figures are provisional. For more details, see information on data.
Methods and definitions
Statistics on trade in goods are transmitted monthly by the Member States, in accordance with the standard set out in Commission Implementing Regulation (EU) 2020/1197. For each reference month, Member States must compile statistics covering their total extra- and intra-EU trade by using estimates, where necessary. These data are available within 40 days after the end of the reference month, enabling euro area and EU aggregates to be disseminated within around 46 days.
Member States provide Eurostat with raw data, which are adjusted for calendar and seasonal effects by Eurostat. The European aggregates are computed with the indirect approach (by Member States) for total imports and exports, which guarantees additivity between the aggregate and its respective components. The estimation of seasonally adjusted data is based on the Tramo-Seats procedure, which is available in the software JDemetra+.
Data are broken down by broad categories of products as defined by the one-digit codes of the Standard international trade classification (SITC).
Geographical information
The euro area (EA20) includes Belgium, Germany, Estonia, Ireland, Greece, Spain, France, Croatia, Italy, Cyprus, Latvia, Lithuania, Luxembourg, Malta, the Netherlands, Austria, Portugal, Slovenia, Slovakia and Finland.
The European Union (EU27) includes Belgium, Bulgaria, Czechia, Denmark, Germany, Estonia, Ireland, Greece, Spain, France, Croatia, Italy, Cyprus, Latvia, Lithuania, Luxembourg, Hungary, Malta, the Netherlands, Austria, Poland, Portugal, Romania, Slovenia, Slovakia, Finland and Sweden.
For more information

