
During European hours, AUD/USD was trading around 0.6600 before dropping sharply. The move was caused by a Bloomberg…
Written by:
Arslan Butt
•
Wednesday, October 1, 2025
•
2 min read
•
Last updated: Wednesday, October 1, 2025
Add an article to your Reading List
Register now to be able to add articles to your reading list.
” aria-hidden=”true”>
Quick overview
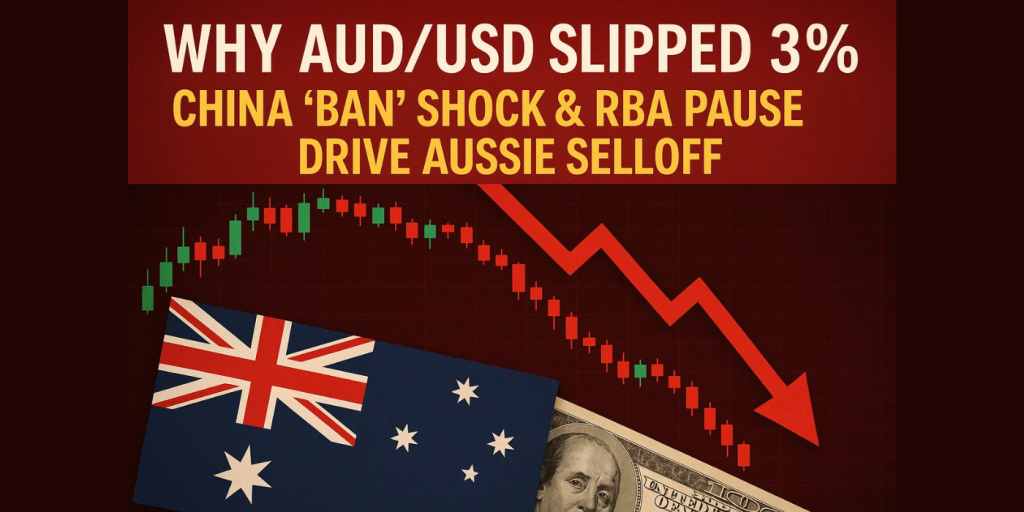
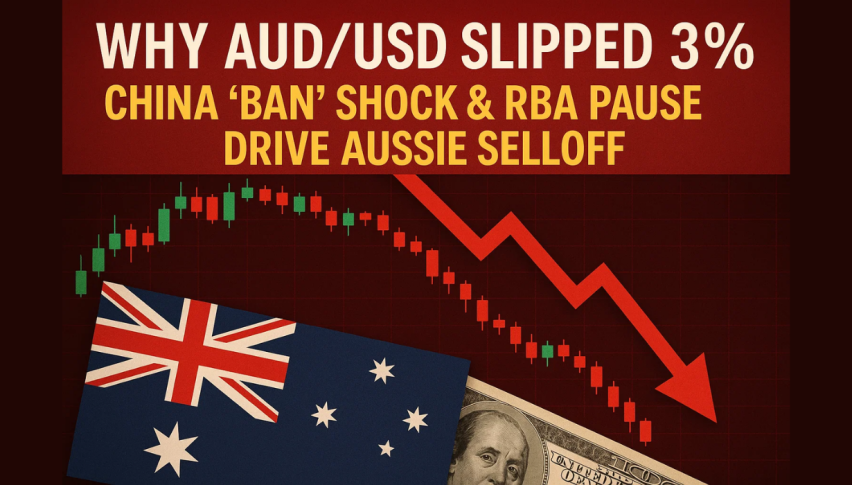
AUD/USD dropped sharply to around 0.6600 due to a Bloomberg report about China’s state iron-ore buyer advising steelmakers to stop purchasing from BHP.Domestic economic indicators show Australia is facing challenges, with the AiG Industry Index in contraction and building permits down 6% in August.The RBA maintained interest rates at 3.6%, while the U.S. Dollar is influenced by expectations of an October rate cut and a potential government shutdown.For traders, a close above 0.6630 could signal a long position towards 0.6660, while a drop below 0.6585 may warrant a short position.
During European hours, AUD/USD was trading around 0.6600 before dropping sharply. The move was caused by a Bloomberg report that China’s state iron-ore buyer told steelmakers to stop buying from BHP – a major Australian exporter. The news spooked markets and knocked confidence in the Aussie. Mysteel later denied the directive but the damage was done.
Domestic Data Adds to Pressure
Australia also had its own headwinds. The AiG Industry Index remained in contraction at -13.2 despite a small lift. The S&P Global Manufacturing PMI cooled to 51.4 from 53.0 showing expansion slowing. Building permits fell 6% in August and continued a weak trend. These local data points show the Australian economy is under pressure – limiting the upside for AUD even without external shocks.
Central Banks & U.S. Factors at Play
The RBA left rates at 3.6% with Governor Bullock saying wait and see rather than forward guidance. Meanwhile the U.S. Dollar is being nudged lower by expectations of a October rate cut (97% priced in) and a U.S. government shutdown. These factors are making AUD/USD more reactive to cross border news flows than domestic strength.
AUD/USD Technical Outlook: A Roadmap
On the 4-hour chart AUD/USD has reclaimed its 50-EMA (~0.6585) and 100-EMA (~0.6572). A pattern of higher lows since late September suggests bullish pressure. RSI is at 61.7 not overbought yet. A three white soldiers pattern pushed price higher but resistance at 0.6630 capped momentum.
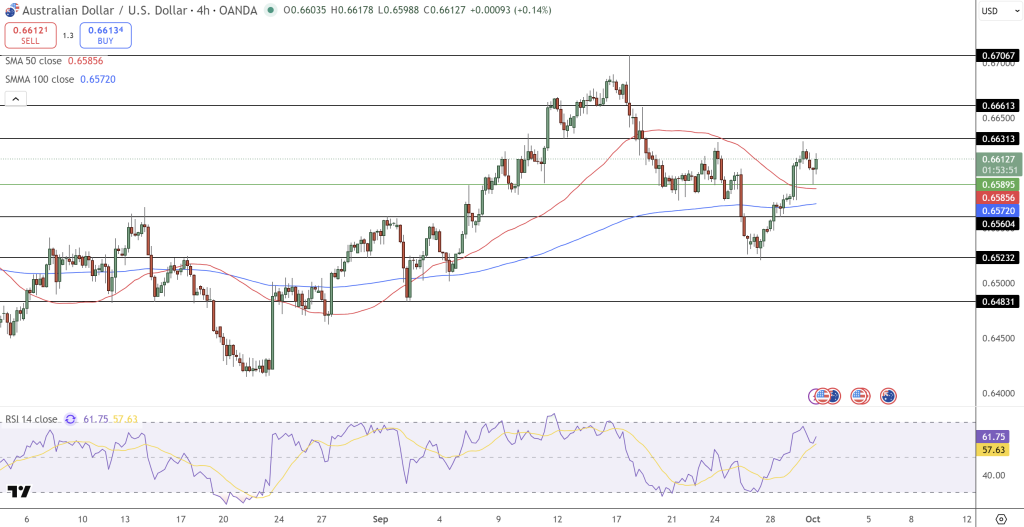 AUD/USD Price Chart – Source: Tradingview
Close above 0.6630 could open up to 0.6660-0.6706
Failure to hold 0.6585-0.6570 could see a pullback to 0.6560 or 0.6523 (trendline support)
AUD/USD Trade Setup
One simple trade: wait for a close above 0.6630 with volume. If that happens you can go long AUD/USD to 0.6660 then 0.6706. Stop loss below 0.6570 to protect against false breaks. Risk/reward is good if momentum continues. If price reverses and goes below 0.6585 consider short or sit out.
Arslan Butt
Lead Markets Analyst – Multi-Asset (FX, Commodities, Crypto)
Arslan Butt serves as the Lead Commodities and Indices Analyst, bringing a wealth of expertise to the field. With an MBA in Behavioral Finance and active progress towards a Ph.D., Arslan possesses a deep understanding of market dynamics.
His professional journey includes a significant role as a senior analyst at a leading brokerage firm, complementing his extensive experience as a market analyst and day trader. Adept in educating others, Arslan has a commendable track record as an instructor and public speaker.
His incisive analyses, particularly within the realms of cryptocurrency and forex markets, are showcased across esteemed financial publications such as ForexCrunch, InsideBitcoins, and EconomyWatch, solidifying his reputation in the financial community.
Related Articles