

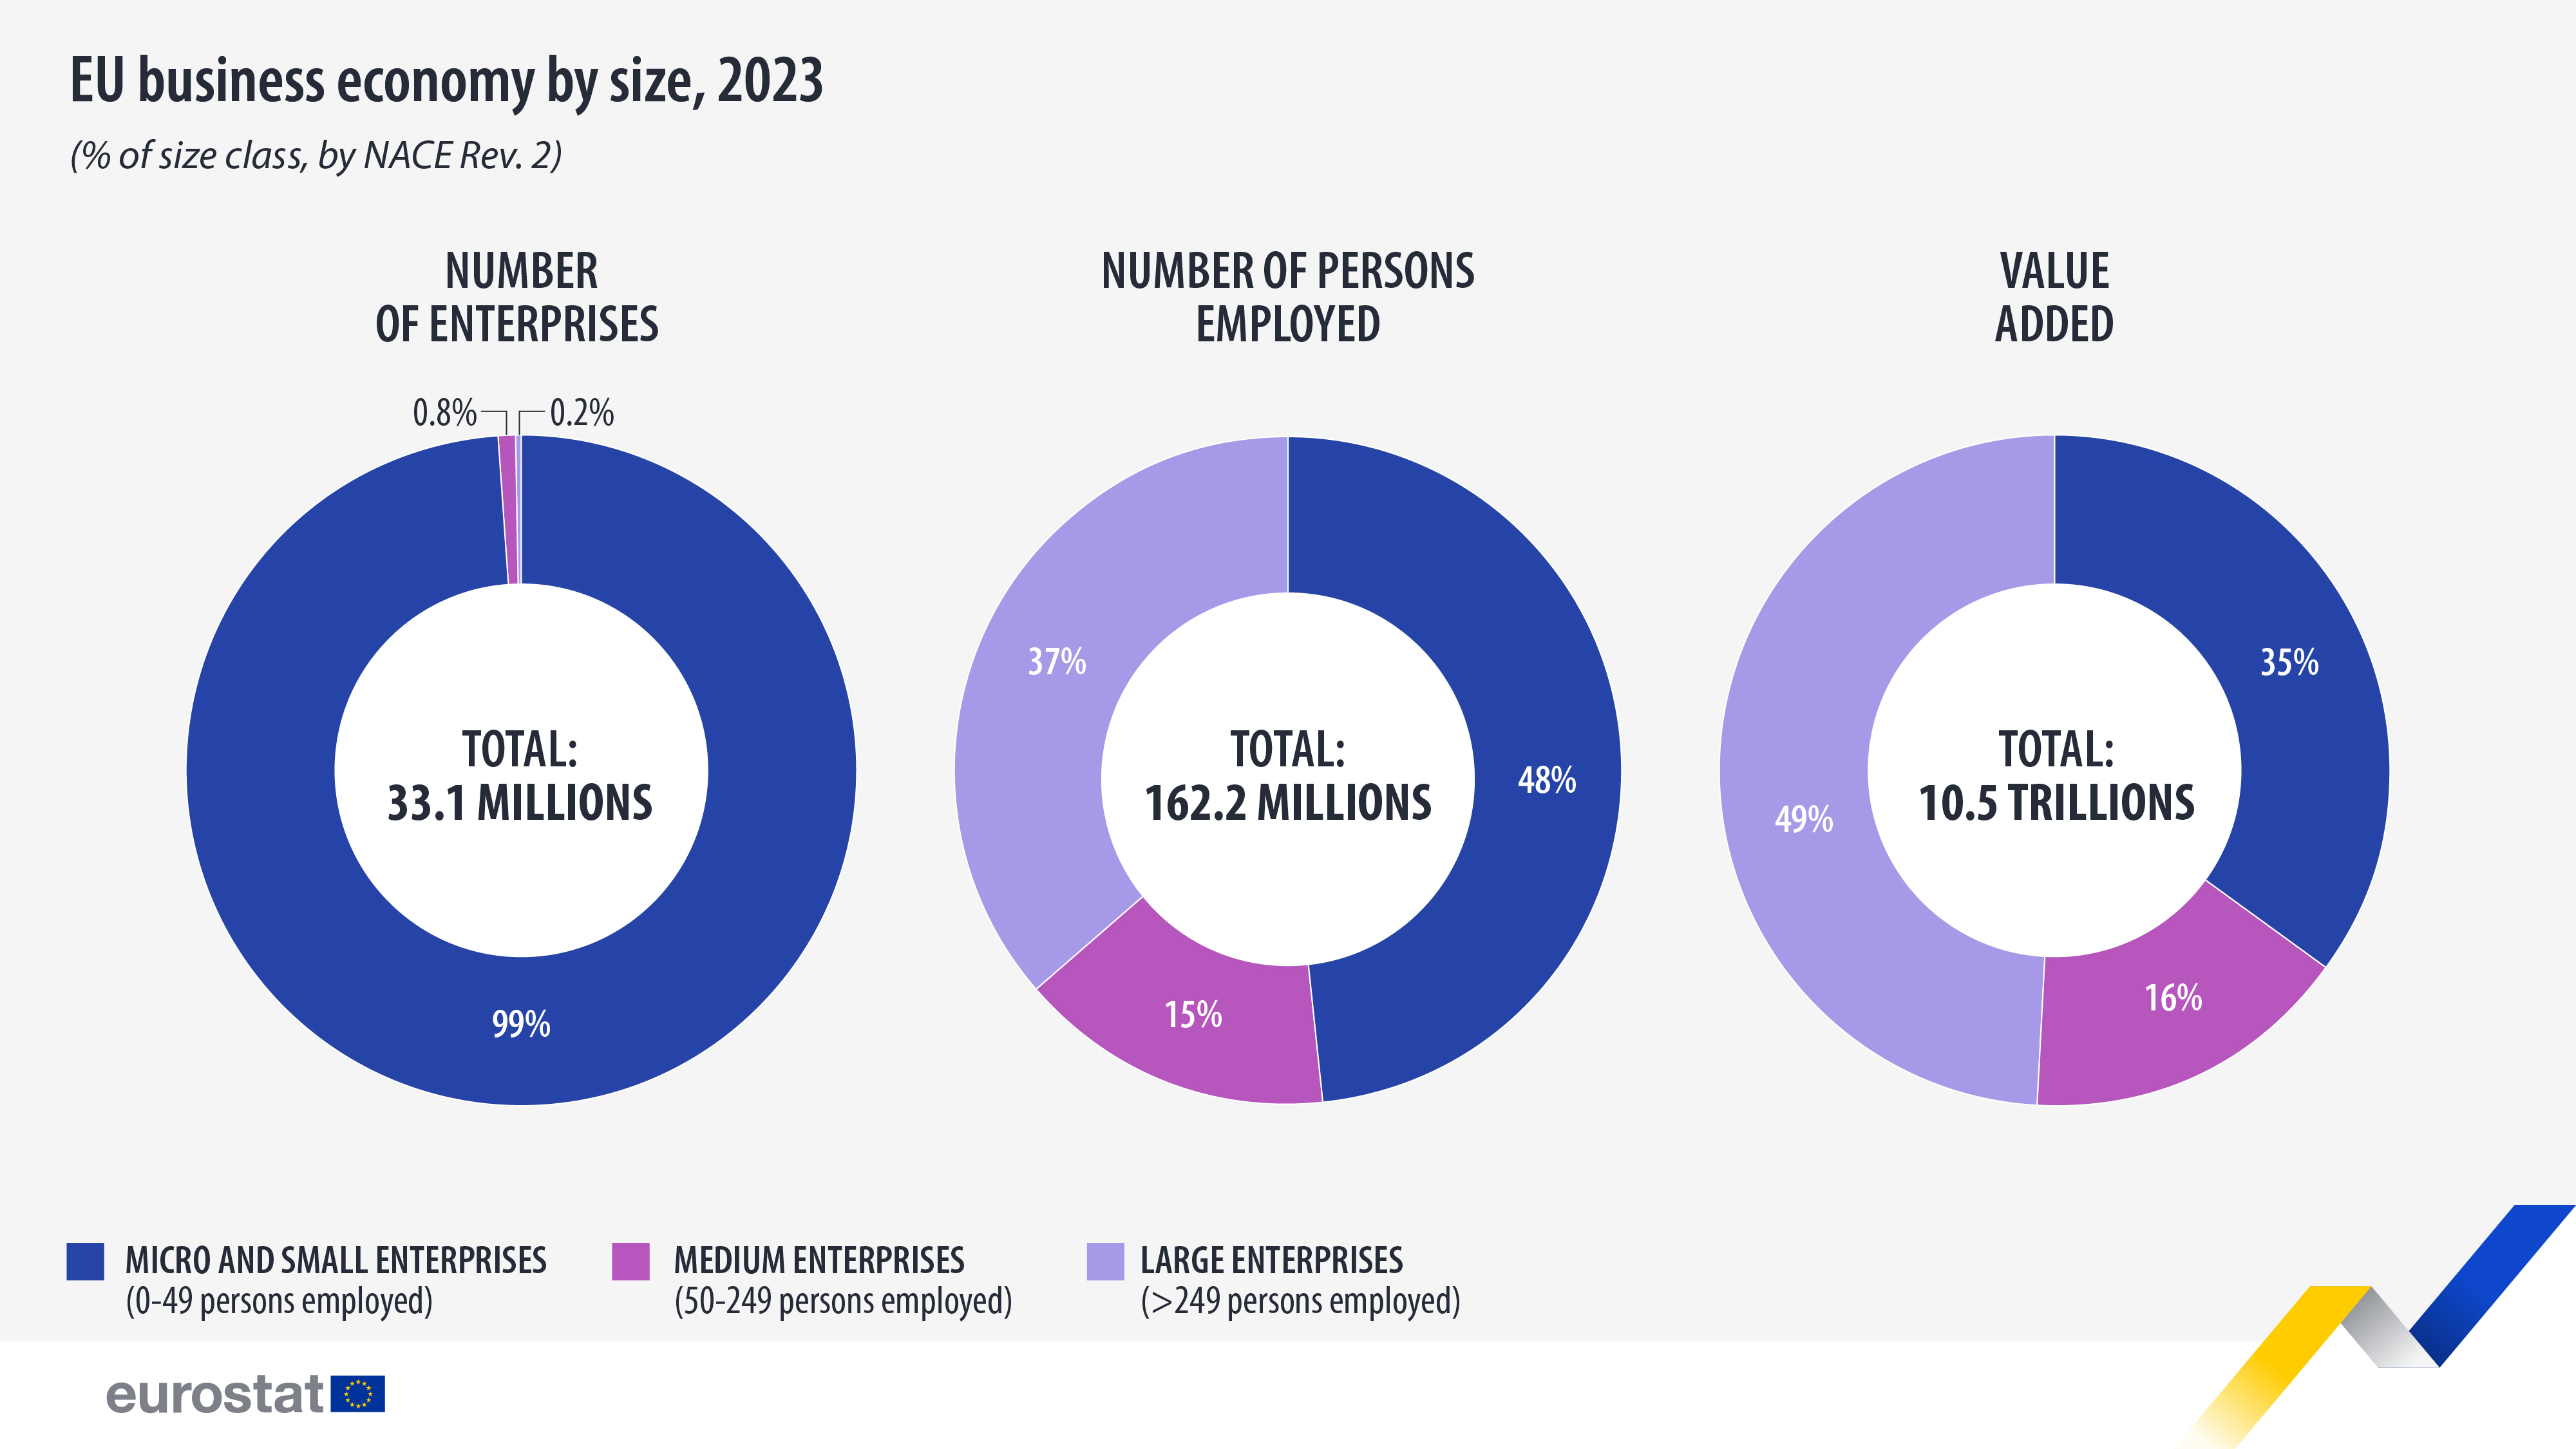
In 2023, there were around 33.1 million enterprises in the EU, employing 162.2 million people. Those enterprises generated a net turnover of over €38.5 trillion, leading to €10.5 trillion in value added.
Large enterprises (with more than 249 people employed) represented only 0.2% of the total number of enterprises in the EU’s business economy. However, they employed more than a third of the labour force (37%) and generated around half (49%) of the total value added.
Medium-sized enterprises (50-249 people employed) constituted a small share of the total number of enterprises (0.8%), employed 15% of the people and generated 16% of the value added.
The majority, 99%, of the enterprises were micro and small enterprises (0-49 people employed). Together, these enterprises employed almost half of all people employed in the EU’s business economy (48%) and generated 35% of its total value added.
This information comes from final data on structural business statistics (SBS) for 2023, published by Eurostat today.
Source dataset: sbs_sc_ovw
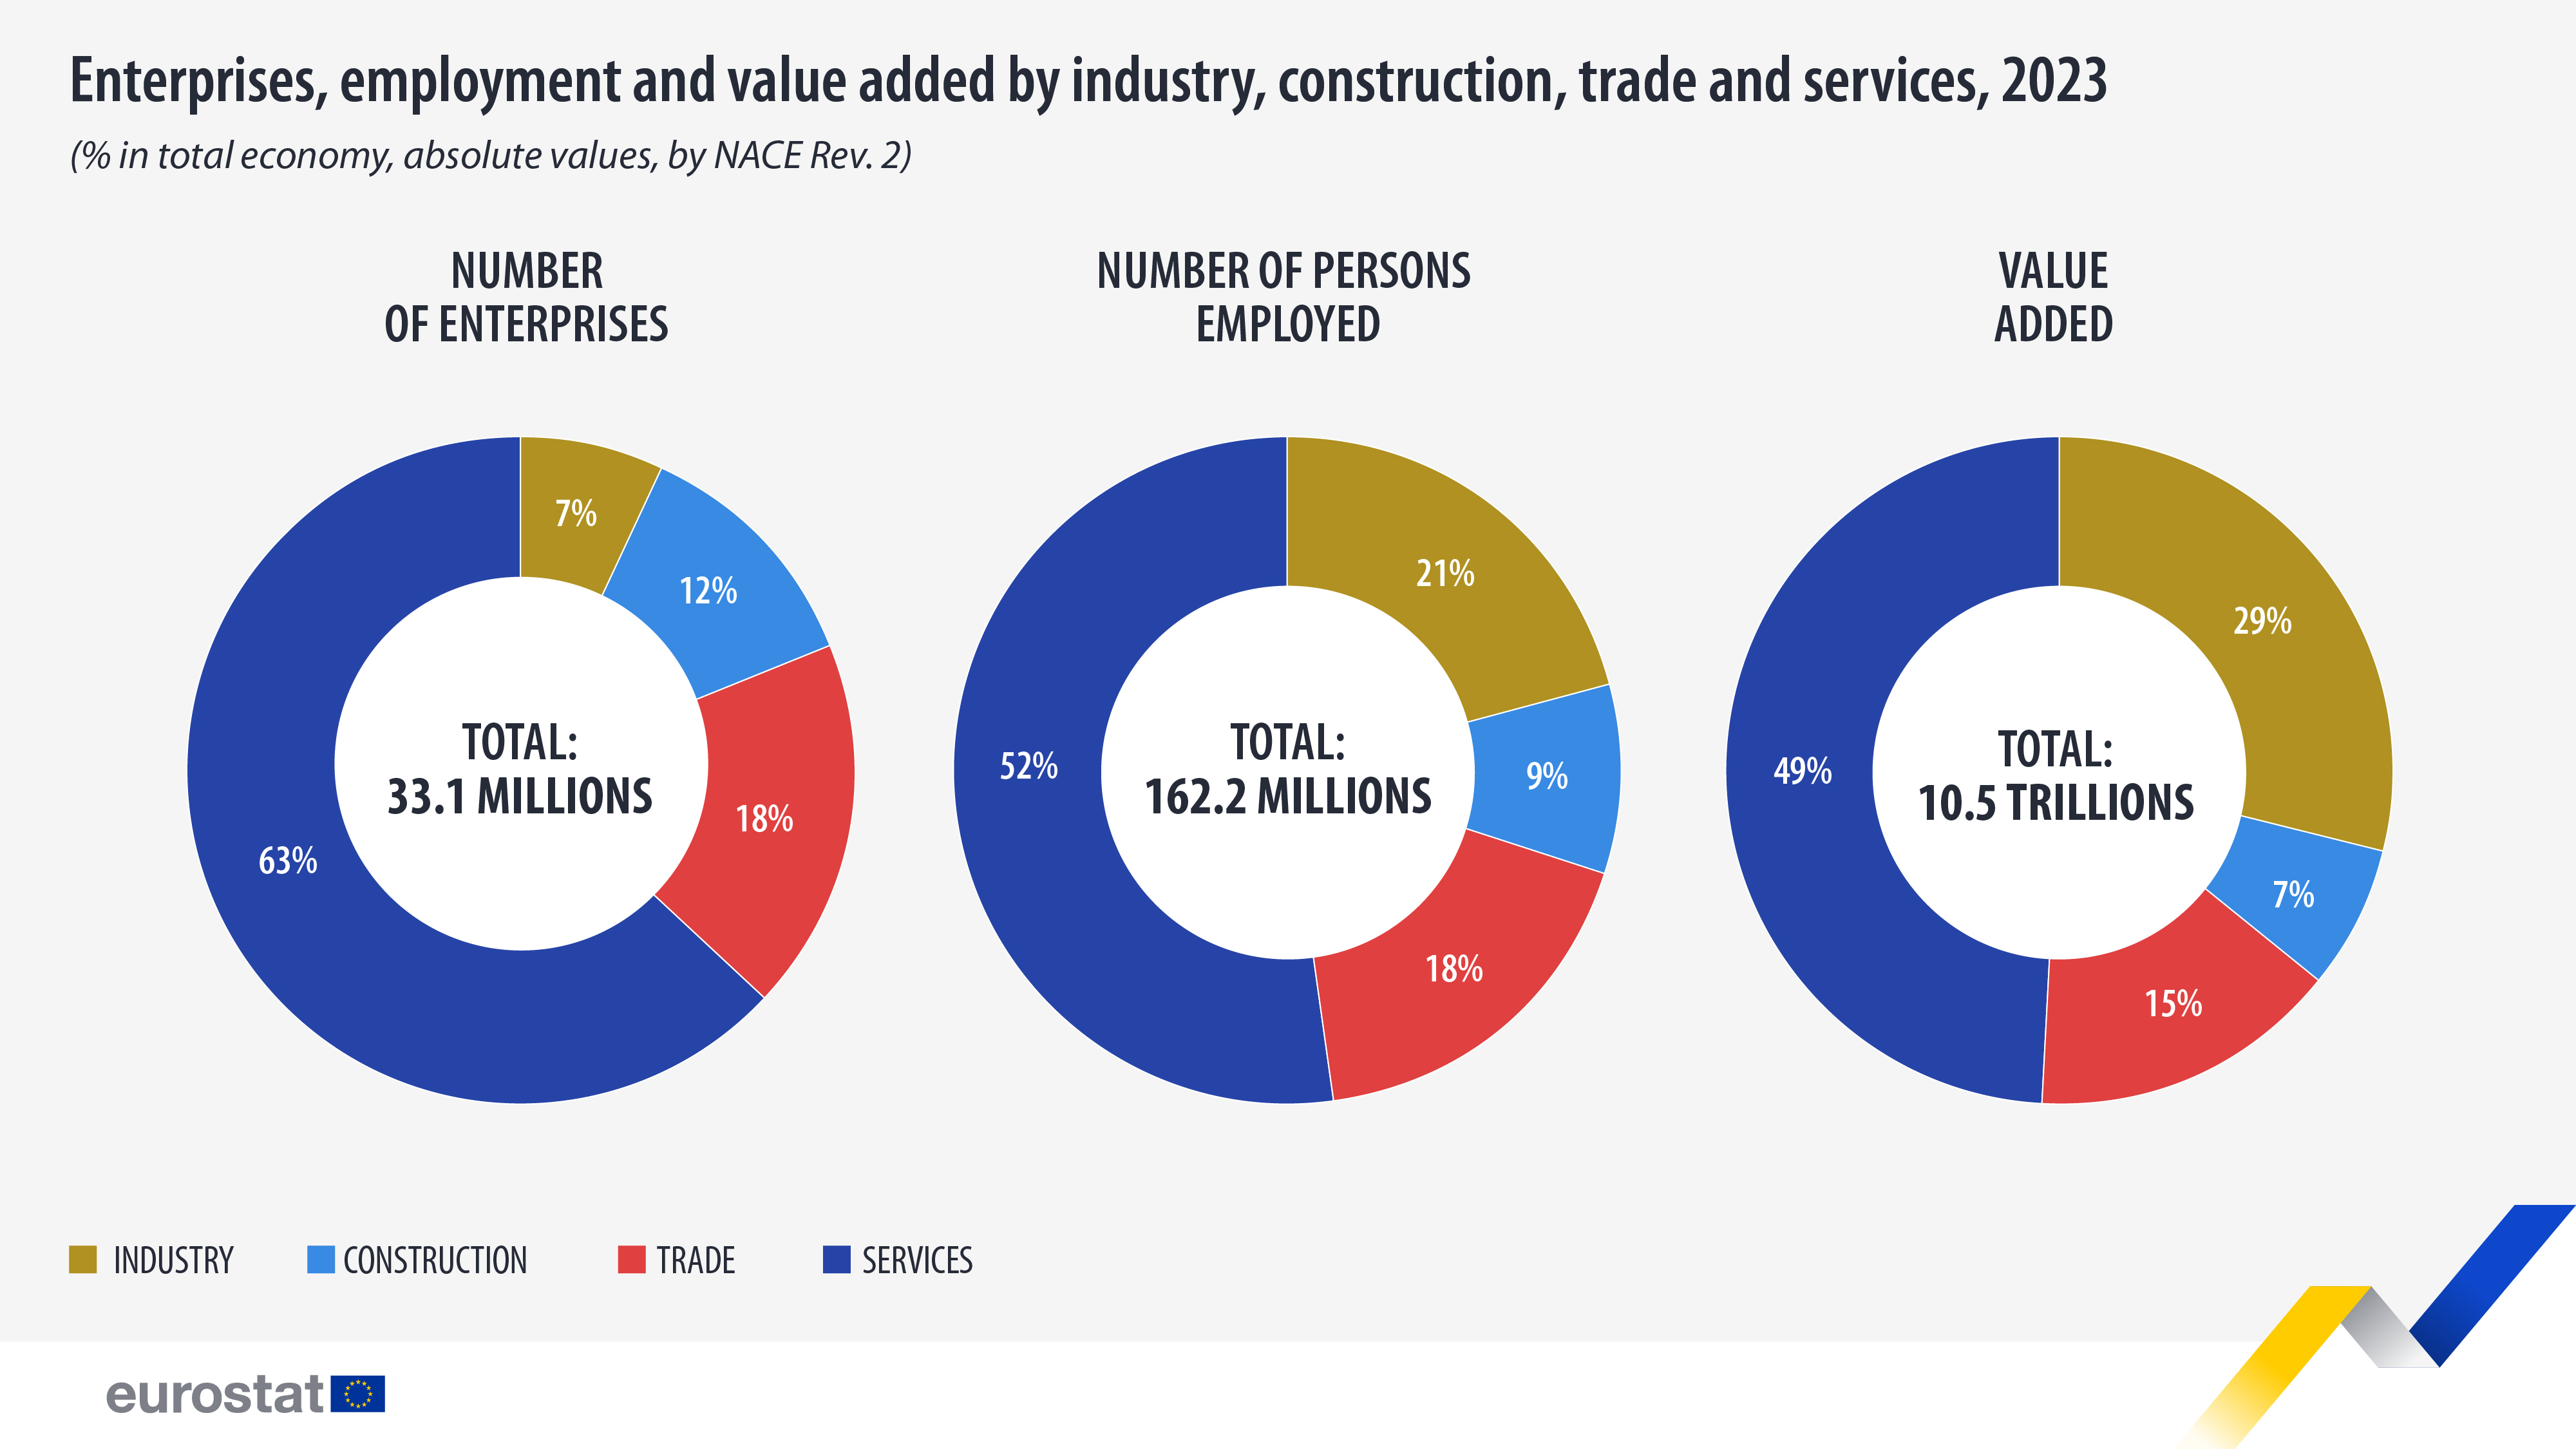
Services: highest share in employment and in value added
The services sector generated almost half (49%) of the total value added of the EU’s business economy in 2023, the highest share among the 4 main sectors (industry, trade, services and construction). With 63% of the total number of enterprises, it employed more than half of the business labour force (52%).
The industry sector accounted for 29% of the value added, with only 7% of the total number of enterprises, and around one-fifth of the total employment (21%).
Trade represented 15% of the value added but accounted for 18% of the enterprises and employed 18% of the people.
Construction enterprises represented 12% of the total number of enterprises but produced only 7% of the total value added. This sector represented 9% of the EU’s business economy employment.
Source dataset: sbs_sc_ovw