
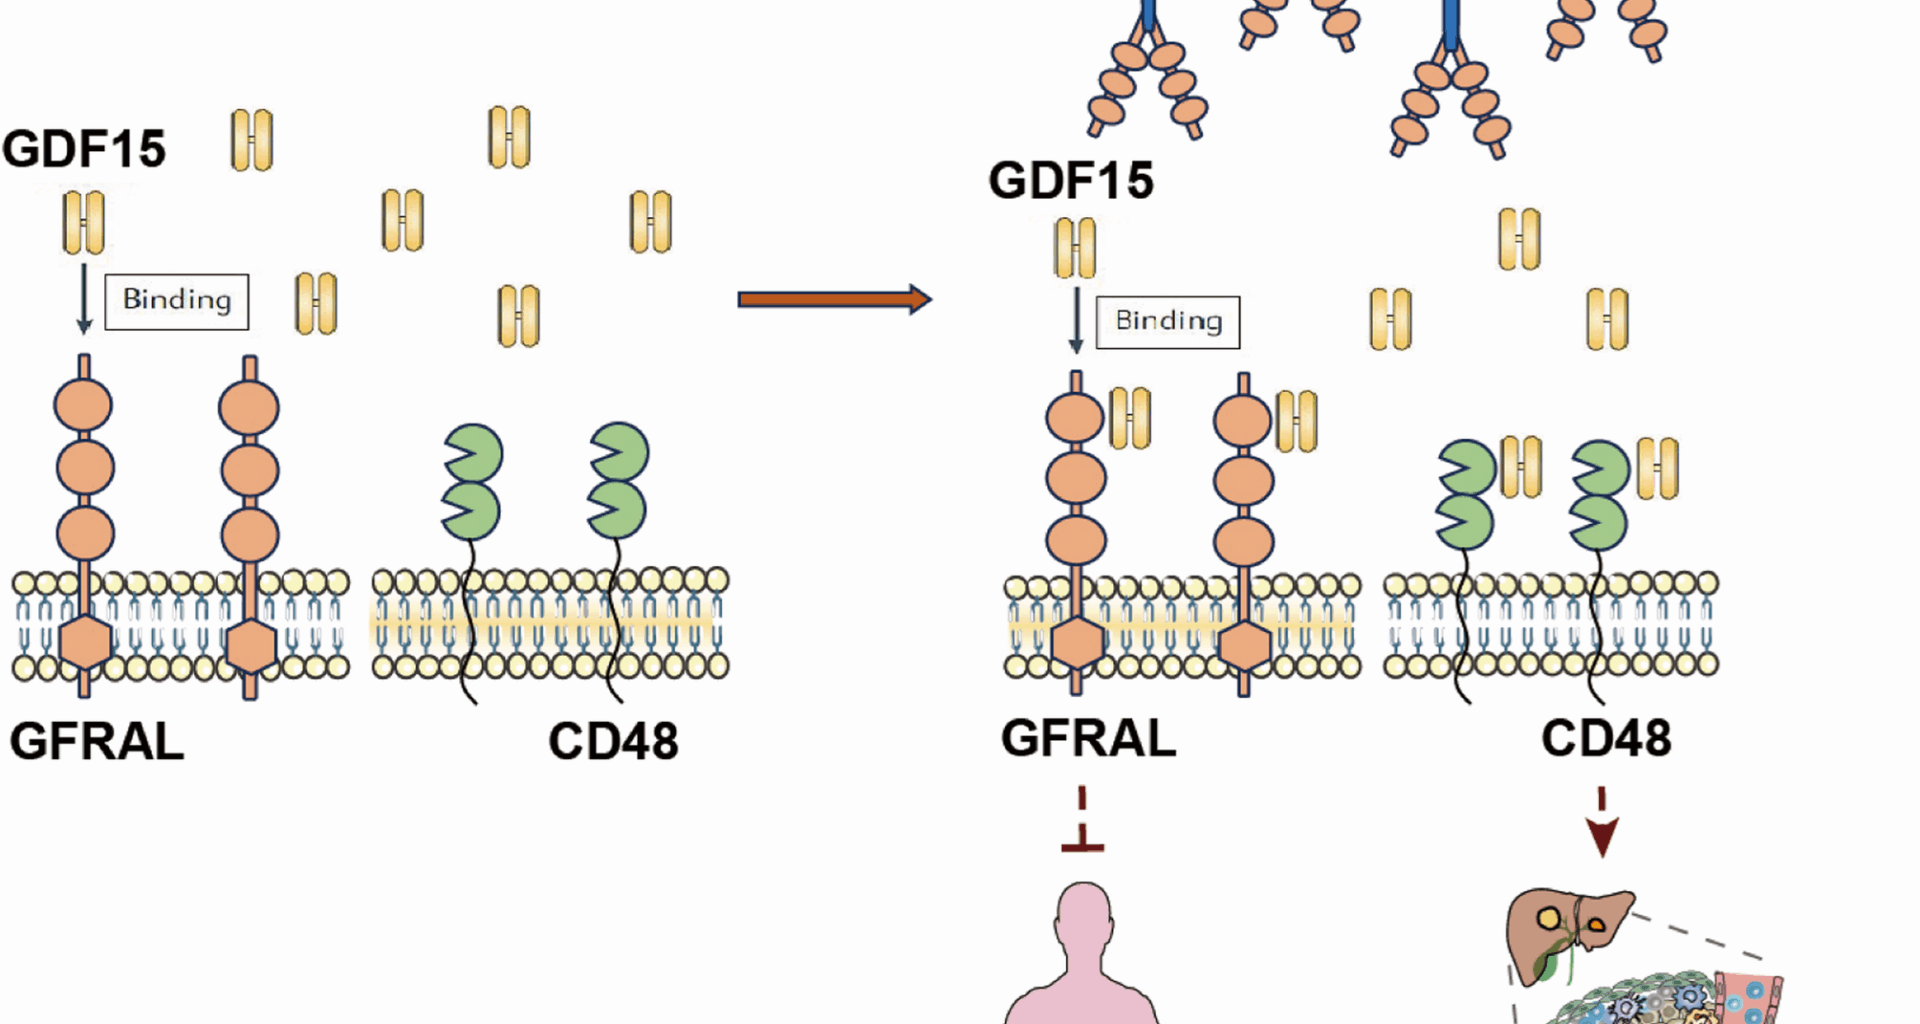
GFRAL-Fc reverses GDF15 induced immune suppression by binding with GDF15
GFRAL (UniProtKB: Q6UXV0) is a type I transmembrane protein with a molecular weight of approximately 44 kD, and the full-length protein consists of 395 amino acid residues (Figure S1A). Structural analysis indicated that the intracellular domain of GFRAL is relatively short and lacks the ability to transduce signals into the cell, whereas the extracellular segment contains three cysteine-rich domains, which are crucial regions for receptor binding. To examine whether GDF15 function can be effectively depleted by competitive binding with GFRAL, we constructed an extracellular segment of GFRAL with a human IgG1-Fc domain, which could not only retain the ligand-receptor binding activity of GFRAL but also achieve maximum antibody-dependent cellular cytotoxicity/antibody-dependent cellular phagocytosis (ADCC/ADCP) effects similar to those of blocking antibodies.
The cDNA encoding the extracellular domain (ECD) of GFRAL, spanning amino acids Ser19 to Glu351, was cloned and inserted into the GSV0-Fc (IgG1) vector to create the GFRALECD-Fc expression plasmid (Fig. 1A). The GFRALECD-Fc plasmid was subsequently transfected into Expi-HEK293-F host cells for protein expression. Following purification, the GFRAL-Fc fusion protein was initially characterized by SDS-PAGE. Both non-reduced (NR) and reduced (R) SDS-PAGE analyses confirmed that the fusion protein possessed the anticipated molecular weight (Figure S1B). The physicochemical properties of the fusion protein are shown in Figure S1c. Furthermore, the fusion protein exhibited robust affinity for human GDF15 (Fig. 1B) and the humanized GFRAL antibody NGM120 (Fig. 1C). Sequence homology analysis revealed a high degree of similarity (72.2%) between the extracellular regions of human and murine GFRAL (Figure S1D); however, the GFRAL-Fc fusion protein did not form complexes with murine GDF15 (Figure S1E). The binding affinity between human GDF15 and GFRAL-Fc, as measured by surface plasmon resonance (SPR), was approximately 0.4 µM (Fig. 1D). G15A is a neutralizing monoclonal antibody against both human and mouse GDF15 previously developed by our group (xx). While this affinity is lower than that of G15A (Kd of ~ 8 nM) (Figure S1F), it still demonstrated a favorable interaction with human GDF15. Collectively, these data indicate that the GFRAL-Fc fusion protein can effectively bind to GDF15, thereby potentially exerting its therapeutic effect by inhibiting the functional activity of GDF15.
Fig. 1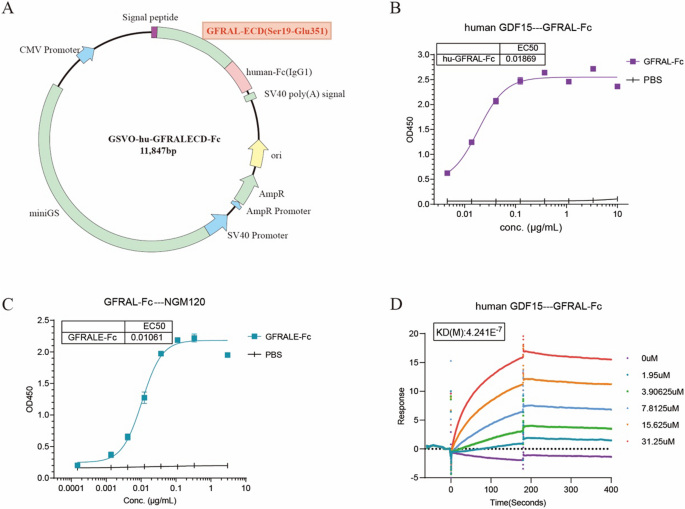
GFRAL-Fc exerts its function by binding with GDF15. A Schematic diagram of the GFRAL-Fc expression vector (GSVO-hu-GFRALECD-Fc) construction. B, C ELISA was used to detect the binding affinity of GFRAL-Fc with human GDF15 (B) and NGM120 (C). The data are representative of three independent experiments. D SPR was used to detect the binding affinity of GFRAL-Fc with human GDF15. The data are representative of three independent experiments
Our previous study demonstrated that GDF15 can efficiently promote the functional activity of Treg cells, leading to immune suppression effects. Considering the strong interaction between GFRAL-Fc and GDF15, we hypothesized that GFRAL-Fc fusion protein may possess the potential to reverse the effects induced by GDF15. Our data analysis revealed that GFRAL-Fc effectively inhibited the generation of CD25+Foxp3+ Treg cells induced by GDF15, as well as their secretion of IL-10 and CTLA4, in a concentration-dependent manner (Fig. 2A-C). Dysfunction of CD8+ T cells caused by the immunosuppressive tumor microenvironment, such as that mediated by Treg cells, is pivotal for immune escape in tumors. Since GDF15 efficiently converts naïve CD4+ T-cell to Treg cells in vitro, we further examined the impact of GFRAL-Fc on CD8+ T cell function within an immunosuppressive environment induced by GDF15. When comparing the proliferation rate of CD8+ T cells was compared, we observed a higher percentage of proliferating CD8+ T cells following coculture with GFRAL-Fc and GDF15-induced Treg cells than following coculture with only GDF15-induced Treg cells (Fig. 2D). Notably, the GFRAL-Fc fusion protein also reversed the dysfunction of CD8+ T cells induced by GDF15-induced Treg cells in a dose-dependent manner, as indicated by the increased activation of CD8+ T cells, increased secretion of the cytokines IFN-γ and TNFα, and improved killing ability of CD8+ T cells to kill tumor cells (Fig. 2E-H). More importantly, GFRAL-Fc reversed the suppression of the ERK and c-jun signaling pathways by GDF15 (Fig. 2I).
Fig. 2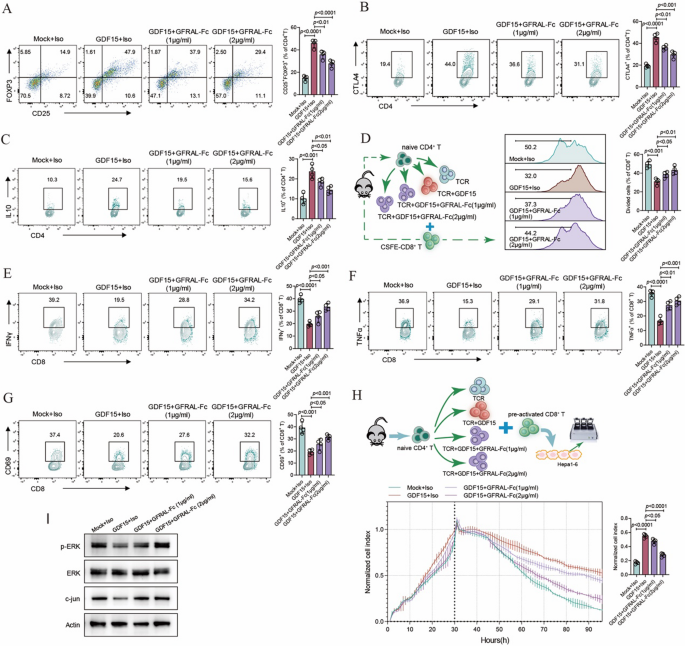
GFRAL-Fc inhibits GDF15-mediated immunosuppressive functions in vitro (A-C) FACS plots showing the expression of the Treg cell signature genes FOXP3 (A), CTLA4 (B), and IL-10 (C) in mouse naïve CD4+ cells after GDF15, GFRAL-Fc, or mock treatment (n = 4 cell cultures). (D) The proliferation of mouse CD8+ cells after coculture with GDF15, GFRAL-Fc, or mock-induced Treg cells was determined by carboxyfluorescein succinimidyl ester (CFSE) dilution assay (n = 4 cell cultures). (E-G) FACS plots displaying the expression of the CD8+ signature genes IFNγ (E), TNFα (F), and CD69 (G) in mouse CD8+ cells after coculture with GDF15, GFRAL-Fc, or mock-induced Treg cells (n = 4 cell cultures). (H) Real-time survival of Hepa1-6 cells cocultured with preactivated CD8+ T cells plus GDF15, GFRAL-Fc, or mock-induced Treg cells. Data at 90 h are presented as a bar (n = 4 cell cultures). (I) Western blot analysis of total ERK, p-ERK, and c-jun in GDF15-, GFRAL-Fc-, or mock-treated mouse CD4+ cells. Actin served as a loading control. Mock, anti-CD3/anti-CD28 monoclonal antibodies (mAbs), and interleukin (IL)−2 stimulation were used. Representative data from one experiment repeated three times are shown. The data are presented as the means ± s.e.m.s. The numbers above the data points indicate P values calculated via analysis of variance (ANOVA). Iso, isotype control (IgG-Fc control)
Therefore, our data conclusively demonstrate that the GFRAL-Fc fusion protein reverses GDF15-induced immune suppression by binding to GDF15. These findings indicate that the GFRAL-Fc fusion protein has potential as a therapeutic candidate for the treatment of tumors.
GFRAL-Fc enhances tumor control in spontaneous HCC mouse models
Owing to the lack of binding affinity between the GFRAL-Fc fusion protein and mouse GDF15, we created a GDF15-humanized mouse model to assess the in vivo functionality of GFRAL-Fc. Specifically, we co-injected a gRNA targeting the mouse Gdf15 gene, a donor vector harboring a “knock-in” (KI) cassette, and Cas9 mRNA into fertilized mouse eggs to generate targeted knock-in offspring, as illustrated in Figure S2. Given the modulatory capacity of GDF15 in the tumor immune microenvironment, we utilized an intravenous plasmid-induced liver cancer model to assess the antitumor capabilities of GFRAL-Fc. This spontaneous HCC model was established in GDF15-humanized mice through tail vein injection of a plasmid mixture containing myr-AKT1, N-RasV12, and the Sleeping Beauty transposon system (SB7) [6]. The incorporation of a luciferase gene fragment within the myr-AKT1 plasmids enabled us to monitor and quantify liver tumor sizes in the mice via the IVIS Spectrum imaging system.
Spontaneous HCC tumor-bearing mice were intraperitoneally injected with either the GFRAL-Fc fusion protein or the G15A neutralizing antibody (Fig. 3A). The luminescence intensity of the tumor-bearing mice revealed that the GFRAL-Fc fusion protein significantly reduced tumor volume in a dose-dependent manner, with the antitumor effect of 250 µg of GFRAL-Fc being comparable to that of 125 µg of the G15A antibody (Fig. 3B, C). Following four treatments, mouse livers were dissected, revealing that GFRAL-Fc decreased the number of tumor nodules and reduced the liver-to-body weight ratio in tumor-bearing mice (Fig. 3D-F). Compared with control mice, mice administered the GFRAL-Fc fusion protein exhibited a dose-dependent increase in median survival compared to control mice (Fig. 3G). Importantly, our results indicated that the increase in mouse survival rate and the decrease in tumors are due to the action of GFRAL, rather than the response mediated by Fc (Figure S3). Given that 250 µg of the GFRAL-Fc fusion protein exhibited the same antitumor effect as 125 µg of the G15A antibody did, we selected a dose of 250 µg of GFRAL-Fc for subsequent studies.
Fig. 3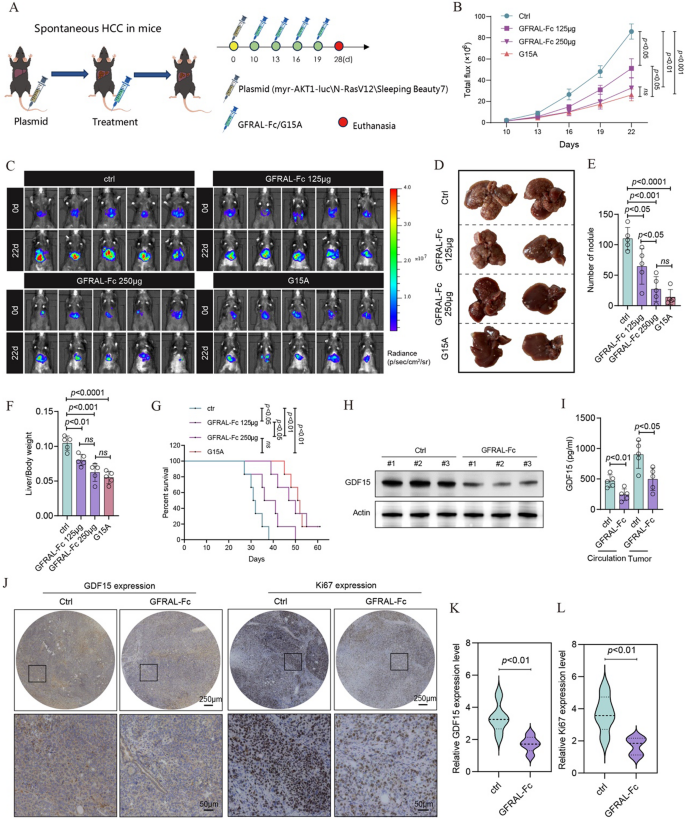
GFRAL-Fc efficiently inhibits tumor growth in a spontaneous HCC mouse model.A Schematic of the establishment of the transposon system-induced spontaneous hepatocellular carcinoma model. The intravenous injection of normal saline, GFRAL-Fc, or G15A was performed on Days 10, 13, 16, and 19 after tumor implantation. The mice were euthanized on day 25 after tumor implantation (n = 5). B Quantification of luminescence levels in mice via the IVIS Spectrum system after the indicated treatments. C Luminescence images of spontaneous HCC model mice following the indicated treatments. D On day 25 after the tumors were established, photographs of the livers excised from the mice in the spontaneous HCC model were taken. (E-F) The bar plots represent the number of nodules per liver (E) and the liver weight-to-body weight ratio (F). G Mouse survival after the indicated treatments was evaluated in another 4 groups of mice (n = 5). H Western blot analysis of GDF15 protein expression in tumor tissues from Ctrl- and GFRAL-Fc (250 µg per mouse)-treated mice excised on day 25. Actin served as a loading control. I Circulation and tumor GDF15 protein levels in Ctrl- and GFRAL-Fc (250 µg per mouse)-treated mice on day 25 were detected via ELISA (n = 5). J, K Immunohistochemistry analysis was conducted to assess the expression of GDF15 and Ki67 in tumor tissues, n = 5. The bar graph represents n = 25 measurements collected from 5 mice, each of which included 5 fields randomly selected for one mouse. L Changes in the body weights of the mice treated with Ctrl or GFRAL-Fc (250 µg per mouse) (n = 5). The data represent the means ± s.e.m.s. The numbers above the data points indicate P values calculated via analysis of variance (ANOVA) or two-sided t tests
Western blot assays demonstrated that treatment with the GFRAL-Fc protein decreased GDF15 protein levels in tumor tissue, as confirmed by ELISA and immunohistochemistry (Fig. 3H-K). Additionally, the circulating GDF15 level was also reduced, as evidenced by the ELISA results (Fig. 3I). Furthermore, GFRAL-Fc treatment resulted in decreased expression levels of Ki-67 in tumor tissue sections compared with those in the control groups (Fig. 3J, L).
Collectively, our findings demonstrate that the administration of the GFRAL-Fc fusion protein effectively inhibits tumor progression and prolongs survival in spontaneous HCC mouse models.
GFRAL-Fc reshapes the immune microenvironment within HCC
To further investigate the immunophenotypic changes resulting from GFRAL-Fc treatment, we conducted mass cytometry (CyTOF) analysis to ascertain the immune cell composition within spontaneous HCC cancer tissues after GFRAL-Fc administration. This analysis utilized 35 monoclonal antibodies (mAbs) to delineate immune cell lineages and functional molecules at a single-cell resolution (Fig. 4A). The analysis of the total CD45+ hematopoietic cell population revealed 15 distinct cellular subsets. Subsequent analysis focused on the differences observed among these 15 clusters between the GFRAL-Fc and control groups (Ctrl) (Fig. 4B-D, S4). The results indicated a significant expansion of effector CD4+ T cells, cytotoxic T lymphocytes (CTLs), and antitumoral macrophages (M1) in the GFRAL-Fc groups. This expansion was characterized by suppressed expression of CTLA4, CD25, FOXP3, PDL1 and PD1 in Tregs; of CD62L, Tim3, CTLA4, and PD1 in CD8+ T cells; and of PDL1, SPP1, XBP1, and SIRPα in macrophages (Fig. 4E-H). In contrast, GFRAL-Fc treatment led to a notable decrease in Treg cells and protumor macrophages (M2), which was accompanied by increased expression of Ki-67, CD69, and CD44 in CD8+ T cells, as well as MHC-II, CD86, iNOS, and CD206 in macrophages (Fig. 4E, G, H).
Fig. 4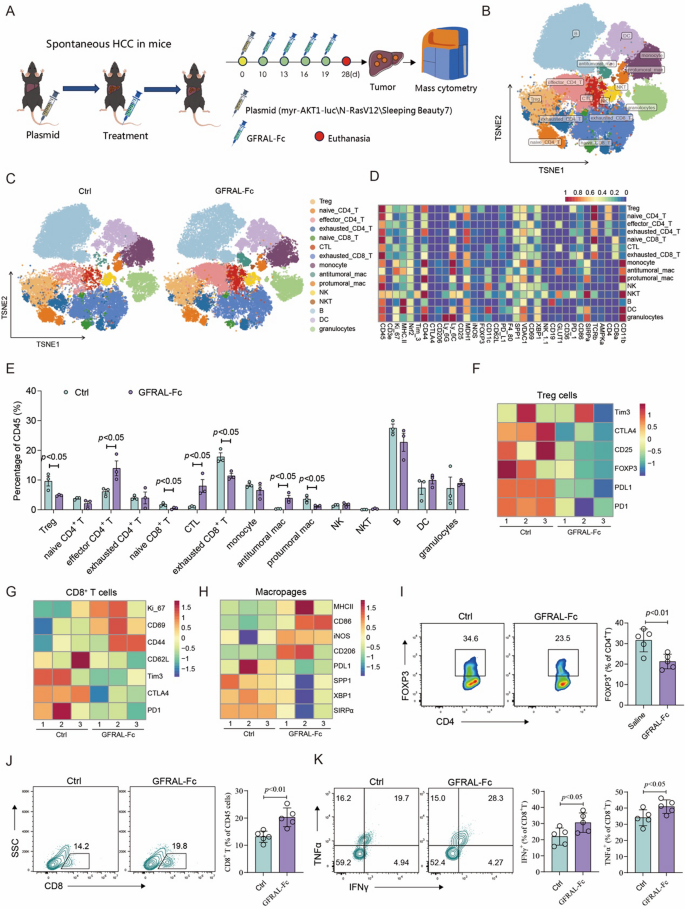
GFRAL-Fc reshaped the tumor immune microenvironment in a spontaneous HCC mouse model.A Schematic of the establishment of the transposon system-induced spontaneous hepatocellular carcinoma model. The intravenous injection of normal saline or GFRAL-Fc was performed on Days 10, 13, 16, and 19 after tumor implantation. The mice were euthanized on day 25 after tumor implantation (n = 5), and the tumor tissues were further analyzed via mass cytometry. B CD45+ immune cells were plotted by t-SNE and density t-SNE by mass cytometry and overlaid with 15 clusters. C Specific distribution of 15 clusters of immune cells in the Ctrl and GFRAL-Fc groups. D The heatmap displays the expression levels of 35 markers of CD45+ clusters within the tumor-infiltrating immune cells. E Comparison of the proportions of 15 cluster cells between the Ctrl groups and the GFRAL-Fc groups. F-H Heatmap displaying the expression levels of Treg cell markers (F) and CD8+ T-cell markers (G, H) in the Ctrl and GFRAL-Fc groups. I Flow cytometry analysis of the percentage of FOXP3+ cells among the CD4+ cells. J, K Flow cytometry analysis of the percentage of CD8+ cells among total CD45 + immune cells and the percentages of IFNγ+ and TNFα+ cells among CD8+ T cells. The data represent the means ± s.e.m.s. The numbers above the data points indicate P values calculated via analysis of variance (ANOVA) or two-sided t tests
We then validated these findings in an independent cohort by analyzing the expression of signature genes of Tregs, CD8+ T cells, and macrophages. In alignment with the CyTOF data, compared with normal saline treatment, GFRAL-Fc administration markedly reduced the percentage of Treg cells but notably increased the percentage of CD8+ T cells, as well as the release of the functional cytokines TNFα and IFNγ released. (Fig. 4I-K). Collectively, these data indicated that the administration of the GFRAL-Fc fusion protein to the HCC mouse model significantly augmented the infiltration of CD8+ cytotoxic T lymphocytes and M1 macrophages while concurrently decreasing the infiltration of M2 macrophages and Treg cells. Consequently, this treatment improved the tumor immune microenvironment and potentiated antitumor immune responses.
GFRAL-Fc attenuates tumor-induced cachexia in vivo
To further determine the role of GFRAL-Fc in liver cancer cachexia, we employed a spontaneous HCC mouse model with humanized GDF15 mice as previously described in detail. Subsequently, we monitored the alterations in total body weight and food consumption in tumor-bearing mice following four intraperitoneal administrations of either the GFRAL-Fc fusion protein or normal saline as control. Our observations indicated that the GFRAL-Fc fusion protein has a notable ability to attenuate body weight loss in tumor-bearing mice from the 25th day onward, and significantly enhances food intake as early as the 15th day, when compared with that in tumor-bearing mice that received normal saline treatment (Fig. 5A, B). We further evaluated gastrocnemius (GAS) and tibialis anterior (TA) muscle weights in tumor bearing mice treated with either GFRAL-Fc or normal saline. Compared with normal saline-treated mice, GFRAL-Fc-treated mice presented greater TA and GAS muscle weights (Fig. 5C, E). Analysis of muscle fiber cross-sectional areas further revealed that GFRAL-Fc treatment attenuated tumor-induced muscle wasting (Fig. 5D, F). qRT-PCR and Immunohistochemical analysis demonstrated that GFRAL-Fc treatment markedly reduced the expression of muscle atrophy markers MuRF1 and Atrogin-1 in both gastrocnemius and tibialis anterior muscles, indicating suppression of ubiquitin-proteasome system-mediated protein degradation pathways (Fig. 5G-J, S5). These findings demonstrated the efficacy of GFRAL-Fc fusion protein treatment in alleviating tumor-induced cachexia in mouse models.
Fig. 5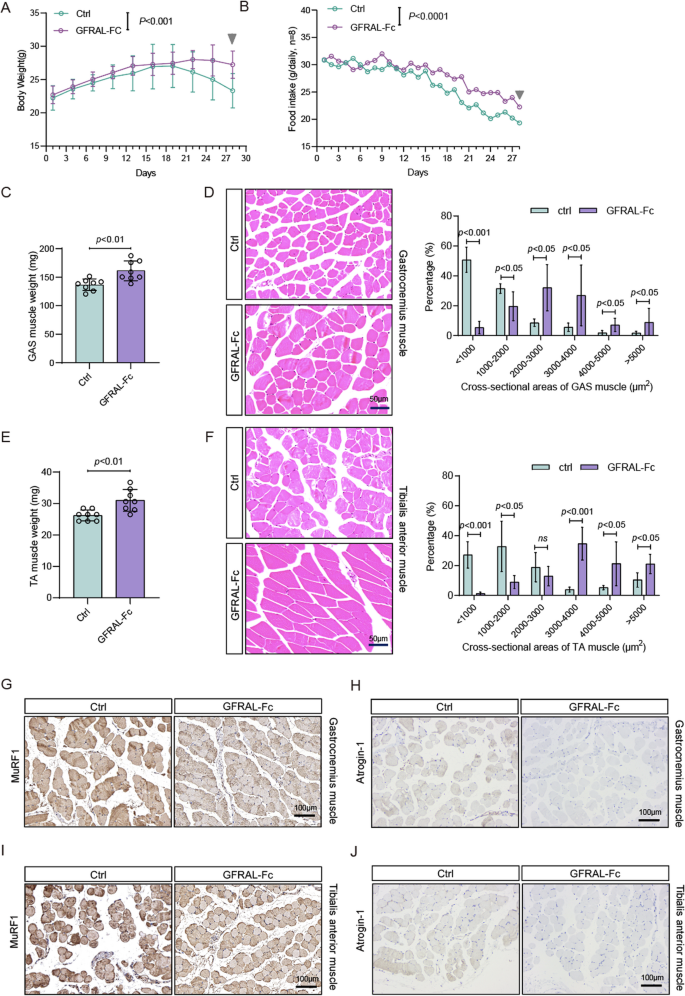
GFRAL-Fc prevents tumor-driven weight loss and tumor-induced muscle wasting. Changes in body weight (A) and food intake (B) of mice bearing spontaneous HCC after saline (Ctrl) or GFRAL-Fc (250 µg per mouse) treatment for 28 days, n = 8. (C) GAS muscle mass measured on Day 28 from mice with the indicated treatments, n = 8. (D) Representative images and quantitative analysis of GAS muscle sections from Ctrl- and GFRAL-Fc (250 µg per mouse)-treated tumor-bearing mice on day 28. The scale bar represents 50 μm, n = 8. The bar graph represents n = 40 measurements collected from 8 mice, each of which included 5 fields randomly selected for one mouse. (E) Tibialis anterior (TA) muscle mass measured on day 28 in mice subjected to the indicated treatments; n = 8. (F) Representative images and quantitative analysis of TA muscle sections from Ctrl- and GFRAL-Fc (250 µg per mouse)-treated tumor-bearing mice on day 28. (G, H) Representative immunohistochemistry of MuRF1 (G) and Atrogin-1 (H) protein expression in gastrocnemius muscle. (I, J) Representative immunohistochemistry of MuRF1 (I) and Atrogin-1 (J) protein expression in anterior muscle, n = 8. The bar graph represents n = 40 measurements collected from 8 mice, each of which included 5 fields randomly selected for one mouse. Data represent the mean ± s.e.m. Numbers above data points denote P values analyzed by ANOVA or two-sided t tests
GFRAL-Fc enhances the effectiveness of PD-1 immunotherapy
Over the past decade, checkpoint inhibitors targeting PD-1/PD-L1 have significantly transformed clinical practice across indications, notably including HCC [7]. Nevertheless, the objective response rate of PD-1 antibody monotherapy in the management of advanced HCC is 15%−20%, often without a significant improvement in overall survival [8, 9]. Recent research suggests that blockade of PD-1 may have the potential to increase Treg cell activity, potentially diminishing the efficacy of immunotherapy [10, 11]. Our study demonstrated that the GFRAL-Fc fusion protein can suppress the differentiation and function of Treg cells within tumor tissues. We thus hypothesized that the combination of anti-PD-1 with GFRAL-Fc might achieve superior antitumor efficacy.
To test this hypothesis, we used a spontaneous HCC mouse model with humanized GDF15 mice to examine the therapeutic outcome of the combination of anti-PD-1 with the GFRAL-Fc fusion protein in vivo. The mice were randomly assigned to groups and received intravenous injections of normal saline (as a control), anti-PD-1, GFRAL-Fc fusion protein, or a combination of anti-PD-1 with the GFRAL-Fc fusion protein every three days (Fig. 6A). The IVIS imaging system demonstrated substantial inhibition of tumor growth in mice that were administered anti-PD-1, the GFRAL-Fc fusion protein, or the combination therapy. Notably, the combination therapy groups exhibited the greater efficacy than the other treatment groups did (Fig. 6B, C). Following the four treatments, mouse livers were dissected, revealing that a significant decrease in the number of tumor nodules and a reduction in the liver-to-body weight ratio among the three treatment groups. Not surprisingly, the combination treatment groups exhibited the most substantial reduction in the number of tumor nodules and in the liver-to-body weight ratio (Fig. 6D-F). Consequently, the coadministration of anti-PD-1 and GFRAL-Fc fusion protein significantly prolonged the survival of tumor-bearing mice, when compared with other individual treatment groups (Fig. 6G). Moreover, an ELISA was used to investigate the GDF15 protein levels in the circulation after the indicated treatments. The results suggested that anti-PD-1 treatment had no effect on GDF15 protein expression; however, the combination therapy resulted in the same notable decrease in GDF15 expression as the individual treatment with GFRAL-Fc (Fig. 6H). The immunohistochemistry results also revealed that single treatment with GFRAL-Fc or combined with anti-PD-1 antibody significantly inhibited the expression levels of GDF15 in the tumor tissues (Figure S6A, B). Furthermore, in line with the reduction in tumor size observed by the IVIS imaging system, immunohistochemical analysis also demonstrated a notable decrease in Ki67 expression within tumor tissues following the three therapeutic interventions. Notably, the group receiving coadministration of the anti-PD-1 and GFRAL-Fc fusion proteins presented the greatest reduction in the Ki67 expression (Figure S6C, D).
Fig. 6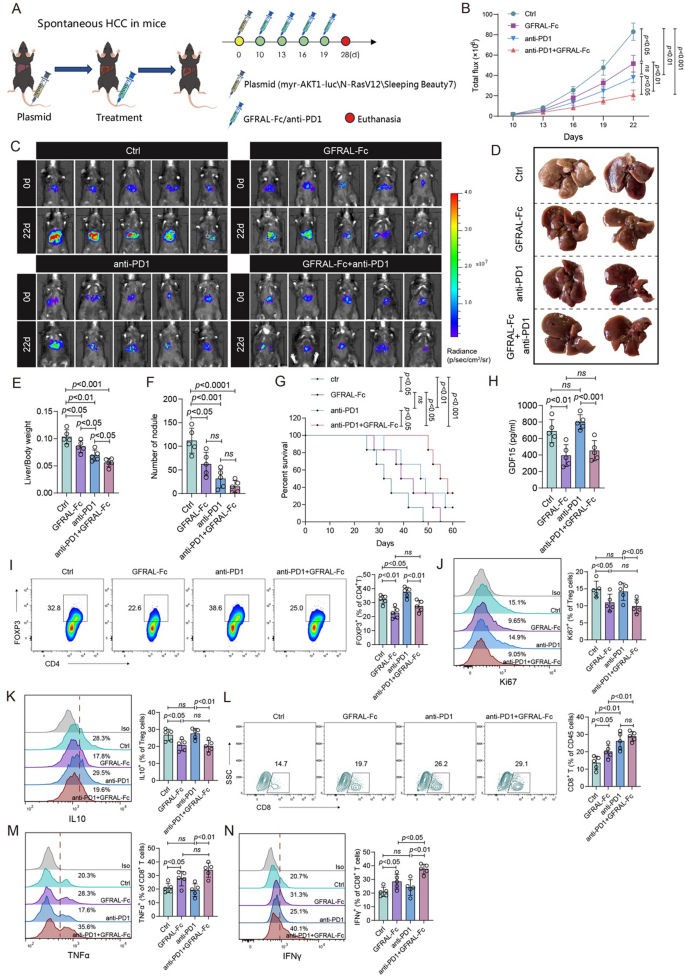
GFRAL-Fc efficiently promotes the therapeutic efficacy of anti-PD1 immunotherapy. A Schematic of the establishment of the transposon system-induced spontaneous hepatocellular carcinoma model. The intravenous injection of normal saline, GFRAL-Fc, anti-PD1, or GFRAL-Fc combined with anti-PD1 was performed on Days 10, 13, 16, and 19 after tumor implantation. The mice were euthanized on day 25 after tumor implantation (n = 5). B Quantification of luminescence levels in mice via the IVIS Spectrum system after the indicated treatments. C Luminescence images of spontaneous HCC model mice following the indicated treatments. E-F The bar plots represent the liver weight-to-body weight ratio (E) On day 25 after the tumors were established, photographs of the livers excised from the mice in the spontaneous HCC model were taken (E) and the number of nodules per liver (F). G Mouse survival after the indicated treatments was evaluated in another 4 groups of mice (n = 5). H ELISA analysis of the protein expression of GDF15 in the circulation from different treatment groups. I-N Flow cytometry analysis was conducted to assess changes in the immune microenvironment in tumor tissues from different treatment groups. I The frequency of FOXP3+ cells in the CD4+ cell population. The frequencies of Ki67+ cells (J) and IL-10+ cells (K) among FOXP3+ Treg cells. L The frequency of CD8+ cells in the CD45+ cell population. Frequencies of TNFα+ cells (M) and IFNγ+ cells (N) among CD8+ cells. The data represent the means ± s.e.m.s. The numbers above the data points indicate P values calculated via analysis of variance (ANOVA) or two-sided t tests
We next studied the alterations in the immune microenvironment following GFRAL-Fc, anti-PD-1, and coadministration of GFRAL-Fc and anti-PD-1. Flow cytometry analysis was conducted on Treg cells and CD8+ T cells isolated from tumor tissues. GFRAL-Fc monotherapy markedly decreased the percentage of Tregs, as well as suppressed the proliferation of Tregs and inhibited the function of Tregs (Fig. 6I-K). Consequently, leading to a higher percentage of CD8+ T cells and enhanced release of the functional cytokines TNFα and IFNγ were observed (Fig. 6L-N). Anti-PD-1 monotherapy did not affect the percentage, proliferation, or function of Treg cells (Fig. 6I-K), but increased the percentage of TNFα- and IFNγ-producing CD8+ T cells (Fig. 6L-N). Notably, the concurrent administration of the GFRAL-Fc fusion protein and anti-PD-1 antibody resulted in a reduction in Treg percentage, proliferation, and functionality to levels comparable to those observed in the GFRAL-Fc-only group of mice (Fig. 6I-K). Furthermore, it significantly elevated the percentages and functionality of CD8+ T cells to their highest levels across the three administrations (Fig. 6L-N). Collectively, these findings confirm that the GFRAL-Fc fusion protein and anti-PD-1 immunotherapy have a substantial synergistic effect on HCC. Concurrent eradication of Treg cells by GDF15 blockade and activation of tumor-infiltrating lymphocytes by PD-1 blockade may represent a general strategy for the effective control of advanced HCC.
GFRAL-Fc has long circulation effects and favorable drug safety
To further investigate the half-life of GFRAL-Fc, we intravenously injected Cy5.5-GFRAL-Fc, Cy5.5-G15A, or Cy5.5-control IgG into spontaneous HCC mice. At 96 h after injection, the Cy5.5 fluorescence signal was captured in the major organs of the mice subjected to different treatments via the IVIS Spectrum system. We found that the Cy5.5 signal from the GFRAL-Fc group was brighter than that from the G15A antibody and IgG control groups when mouse livers were imaged ex vivo (Fig. 7A, B). In addition, the Cy5.5 fluorescence intensity degradation rate in the plasma from the GFRAL-Fc-Cy5.5-treated group was significantly lower than that in the plasma from the G15A-Cy5.5-treated group (Fig. 7C). ELISA-based pharmacokinetic measurements further corroborated these findings, demonstrating that GFRAL-Fc exhibited a significantly extended circulation half-life compared to G15A (Fig. 7D). These findings confirmed the superior pharmacokinetic stability of GFRAL-Fc over the GDF15 antibody G15A.
Fig. 7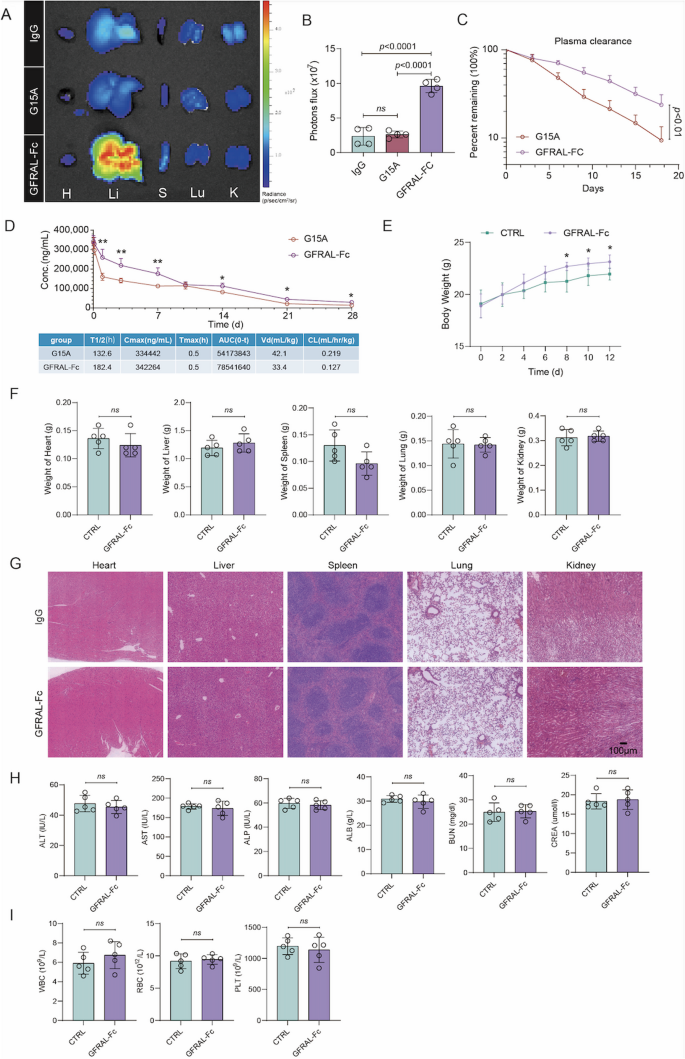
Pharmacokinetic behavior and safety evaluation of GFRAL-Fc.A Cy5.5 fluorescence from major organs in spontaneous HCC model mice 96 h after intravenous injection of Cy5.5-GFRAL-Fc, Cy5.5-G15A, or Cy5.5-control IgG, n = 5. B Quantification of Cy5.5 fluorescence levels in the livers of spontaneous HCC model mice via the IVIS Spectrum system after Cy5.5-GFRAL-Fc, Cy5.5-G15A, or Cy5.5-control IgG treatment for 96 h, n = 5. C Pharmacokinetic profiles of free Cy5.5 and different micelles after intravenous injection. The results are reported as the means ± SDs, n = 5. D Serum concentration-time profiles following single administration (250 µg per mouse). Concentrations were quantified by ELISA at time points from 0.02 to 28 days post-injection. Data are presented as mean ± SEM (n = 3 mice per group). Pharmacokinetic parameters calculated by non-compartmental analysis. (E-I) WT C57BL/6 mice were given five times the normal dose of GFRAL-Fc or normal saline (Ctrl). Each value was determined on day 12 postinjection, n = 5. E Changes in body weight after the indicated treatment. F Changes in the weights of the heart, liver, spleen, lung, and kidney after the indicated treatments. G Histological analyses of major organs excised from GFRAL-Fc- or normal saline-treated mice. H Blood analysis of ALT, AST, ALP, ALB, BUN, and CREA in healthy mice after the indicated treatments. (I) Blood analysis of WBCs, RBCs, and PTL from healthy mice after the indicated treatments. H: Heart; Li: liver; S: spleen; Lu: lung; K: kidney; ALT: alanine transaminase; AST: aspartate aminotransferase; ALP: alkaline phosphatase; ALB: albumin; BUN: blood urea nitrogen; CREA: creatinine; WBC: white blood cell count; RBC: red blood cell count; PLT: platelet count. P values were determined by ANOVA (B) or two-sided t tests E, G, H. The data are presented as the means ± s.e.m.s (*p < 0.05, ns = not significant)
The safety assessment of drugs constitutes an indispensable step in their application process. To explore the potential translational use of our design, we tested whether the GFRLA-Fc fusion protein has potential toxicity and immunogenicity. We first confirmed that the toxicity of the GFRAL-Fc fusion protein to mouse normal hepatocyte AML12 cells or mouse liver cancer Hepa1-6 cells was negligible at different dosages and times via the RTCA system (Figure S7A, B). Moreover, we intravenously injected five times the normal dose of GFRAL-Fc into healthy C57BL/6 mice to assess the immune response and toxicity triggered by GFRAL-Fc in vivo. By monitoring the alterations in total body weight every other day after intraperitoneal administration, our observations demonstrated that, in comparison with the normal saline control group, GFRAL-Fc treatment did not result in a reduction in mouse weight and, furthermore, facilitated an increase in mouse weight starting on the eighth day (Fig. 7E). On the 12th day, the major organs and blood samples were collected from the mice. GFRAL-Fc treatment preserved the weight of these major organs (Fig. 7F), and H&E staining demonstrated the absence of notable damage to major organs in the GFRAL-Fc-treated group (Fig. 7G). Furthermore, liver and kidney function were assessed by analyzing the serum levels of aspartate transaminase (AST), alanine transaminase (ALT), alkaline phosphatase (ALP), albumin (ALB), urea nitrogen (BUN) and creatinine (CREA) (Fig. 7H). Additionally, the hematological status of the mice was evaluated through the analysis of blood parameters (Fig. 7I). The results indicated that all test values in the GFRAL-Fc group were within the normal range and were not significantly different from those in the control group. These findings confirm the excellent biosafety profile of the GFRAL-Fc fusion protein, suggesting its potential for clinical application.