
The number of iNKT cells decreased in a mouse model of HCC
To understand the function of iNKT cells in HCC, we induced liver tumors via administration of 25 mg/kg DEN to 15-day-old male C57BL/6 WT mice40. DEN-induced mouse HCC is highly immunogenic and develops in the background of chronic inflammation; therefore, it is best suited to study antitumor immune responses and the contributions of immune cell populations, such as iNKT cells41. Mice treated with DEN developed multiple macroscopically visible tumors (>3 mm in size) and smaller pre-cancerous lesions (<3 mm) in their livers at 38–42 weeks post-treatment, while histological analysis revealed extensive liver damage, focal hyperplasia, and extensive recruitment of lymphocytes around cancer lesions (Fig. 1A). In addition, we observed an increase in the liver-to-body weight ratio in treated mice compared with untreated WT controls, which was consistent with the presence of enlarged livers and the development of HCC (Fig. 1B). Real-time PCR revealed an increase in the expression of the HCC marker genes Afp and Gpc3 in DEN-treated WT mice compared with those in CTRL mice (Fig. 1C). Consistent with the histological findings, flow cytometry analysis revealed an increased number of lymphocytes in mice with HCC compared with healthy mice (Fig. 1D and Supplementary Fig. 1).
Fig. 1: The number of iNKT cells decreased in HCC.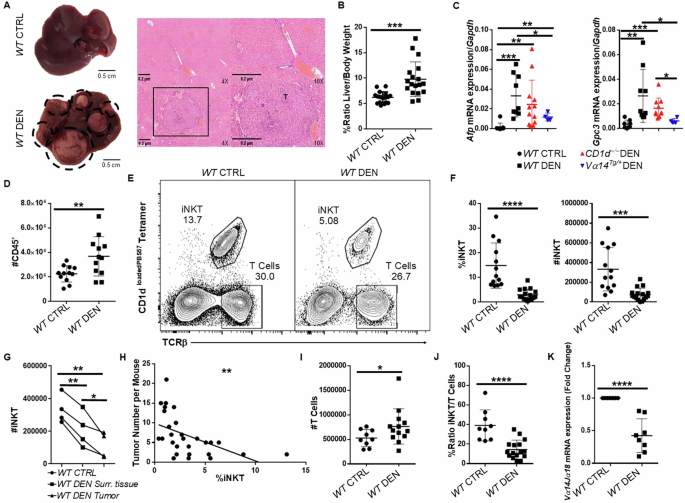
A Liver images from WT CTRL (top) and WT DEN (bottom) mice. H&E histology 38–42 weeks after DEN treatment in ×4 and ×10 magnification. B Increased %Ratio Liver/Body weight in WT DEN mice. C Scatter plots show the mRNA expression of Afp and Gpc3 in the liver from WT CTRL, WT DEN, CD1d−/− DEN, and Vα14Tg/+ DEN mice. D Number of CD45+ cells are shown. E FACS plots of total liver lymphocytes from WT and WT DEN mice showing the percentage of iNKT (Tetr+TCRβ+) and conventional T (Tetr−TCRβ+) cells. F Scatter plots showing the average percentage and number of iNKT cells. G Scatter plot shows the average number of iNKT cells in WT CTRL mice and in surrounding healthy tissue and within tumors from WT DEN mice. H Scatter plot shows the correlation of the frequency of iNKT cells (X axis) with the number of tumors per mouse (Y axis) in WT DEN mice. p < 0.01, R2 = 0.2915. I Scatter plot shows the number of T cells. J Scatter plot shows the % Ratio iNKT/T cells in the liver. K Scatter plot shows the average Vα14 Jα18 mRNA expression in WT and WT DEN mice. Bars represent mean ± SD from 18 independent experiments for macroscopic analysis with one WT and one WT DEN mouse, 9 independent experiments for mRNA of Afp and Gpc3 with one WT, one WT DEN, one or two CD1d−/− mice and 4 experiments included one Vα14Tg/+ DEN mouse, and at least 9 independent experiments for flow cytometry analysis with one WT and one-three WT DEN mice, 4 independent experiments for flow cytometry analysis between surrounding tissue and tumor with one WT DEN mouse each and 7 independent experiments for mRNA of Vα14 Jα18 transcript with one WT and one or two WT DEN mice each. *, p < 0.05, **, p < 0.01, ***, p < 0.001, ****, p < 0.0001 by t test.
We next sought to examine the presence of iNKT cells in HCC livers, using CD1d tetramers loaded with the glycolipid PBS57. Our flow cytometry analysis revealed a significant decrease in both the percentage and number of iNKT cells (Tetr+TCRβ+) in total liver from WT DEN mice compared with those in the livers from WT CTRL animals (Fig. 1E, F), with no changes in the ratio of iNKT cells subpopulations (Supplementary Fig. 2). In addition, when possible, tumor tissue (tumoral) was separated from the surrounding healthy liver tissue (non-tumoral) in WT DEN-treated mice, to specifically examine the presence of intratumoral iNKT cells. Importantly, the number of intratumoral iNKT cells was also lower than that in the surrounding healthy tissue from mice with HCC (Fig. 1G). Additionally, the frequency of total liver iNKT cells in mice with HCC was inversely correlated with the number of developed tumors in WT DEN-treated mice (Fig. 1H), indicating a potential beneficial role of iNKT cells in tumor control. No observable changes were detected in the frequency or number of iNKT cells in the spleen (Supplementary Fig. 3A, B), indicating a specific loss of hepatic iNKT cells during HCC development in mice. In contrast, we detected an increase in the number of conventional T cells in the livers of mice with HCC compared with healthy mice (Fig. 1I); consequently, the iNKT/T cell ratio decreased in the WT DEN-treated mice (Fig. 1J). Furthermore, the frequency and number of macrophages (CD11b+F4/80+) were greater in WT DEN than in WT CTRL mice (Supplementary Fig. 3C, D).
Because iNKT cell activation results in downregulation of surface TCR expression, flow cytometry may underestimate the presence of iNKT cells, if they are activated in HCC. To validate the reduction in iNKT cells in HCC, we assessed the expression levels of Vα14 Jα18 transcripts, which are unique to iNKT cells. As shown by qPCR, Vα14 Jα18 mRNA levels in the liver were significantly lower in WT DEN than in WT CTRL mice (Fig. 1K). Collectively, our analysis revealed that liver iNKT cells were less abundant in mice with HCC, although the total number of conventional T cells and macrophages increased.
The functionality of iNKT cells was impaired in HCC
We next investigated whether iNKT cells from the HCC microenvironment are competent to mount an effective immune response. To address this, we examined the expression of CD69, which is induced upon TCR engagement and is a common activation marker for T cells, on iNKT cells from WT DEN-treated mice. Under baseline conditions, the majority of hepatic iNKT cells in healthy mice expressed CD69, consistent with their pre-activated phenotype (Fig. 2A, left panel). In contrast, in HCC-bearing mice, CD69 expression was reduced, with only ~60% of hepatic iNKT cells expressing this activation marker (Fig. 2A, B), suggesting impaired iNKT cell activation in the tumor context. Furthermore, an increased percentage of hepatic iNKT cells expressed high levels of PD1, which is a marker of T cell exhaustion, suggesting that iNKT cells may be dysfunctional in the context of HCC (Fig. 2C, D).
Fig. 2: The functionality of iNKT cells was impaired in HCC mice.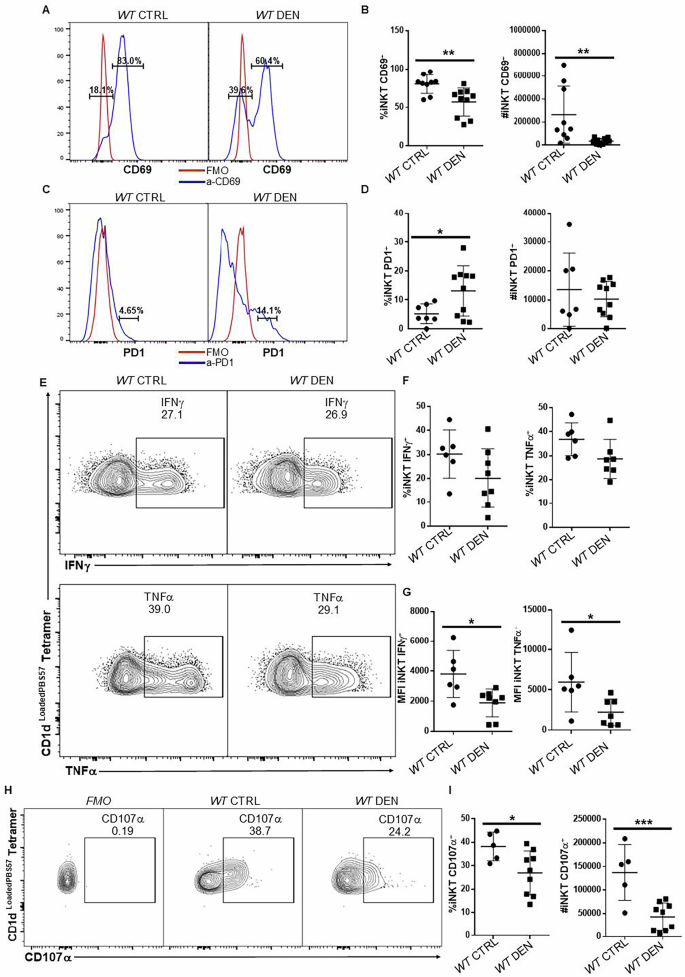
A Histograms show the CD69 expression in iNKT cells from WT and WT DEN mice. Red line shows the isotype control staining and blue line shows staining with a-CD69 in the indicated samples. B Scatter plots show the average percentage and number of iNKT cells expressing CD69 in healthy and HCC mice. C Histograms show the expression of PD1 in iNKT cells from WT and WT DEN mice. Red line shows staining with isotype control antibody and blue line shows a-PD1 staining. D Scatter plots show average PD1 expression in iNKT cells from the indicated mice. E FACS plots show the expression of IFNγ and TNFα in hepatic iNKT cells after PMA/ION stimulation in vitro. F Scatter plots show the average percentage of IFNγ and TNFα in iNKT cells from WT and WT DEN mice. G Scatter plots show the MFI of IFNγ and TNFα in iNKT cells from WT and WT DEN mice. H FACS plots show the surface expression of CD107α (LAMP1) in iNKT cells from WT CTRL and WT DEN mice after PMA/ION stimulation in vitro. a-CD107α was added in the media for 4 h. I Scatter plots show the average percentage of iNKT cells that stained positive for CD107α. Bars represent mean ± SD from 9 independent experiments for activation with one WT and one or two WT DEN mice and 7 independent experiments for exhaustion analysis with one WT and one or two WT DEN mice and 6 independent experiments for the ability of iNKT cells to produce IFNγ and TNFα, with one WT and one or two WT DEN mice each and 5 independent experiments for the CD107α presence with one-two WT and two-three WT DEN mice. *, p < 0.05 by t test.
To directly examine the ability of iNKT cells to produce cytokines, we stimulated lymphocytes with phorbol 12-myristate 13-acetate (PMA) and ionomycin (ION) in vitro. Flow cytometry analysis revealed that the percentage of iNKT cells that were able to express IFNγ and TNFα was comparable between healthy and HCC mice (Fig. 2E, F). Notably, however, iNKT cells from HCC livers expressed significantly lower amount of IFNγ and TNFα on a per-cell basis (Fig. 2G). In addition, HCC iNKT cells exhibited significantly reduced CD107α surface expression after PMA/ION stimulation compared to those from healthy control mice (Fig. 2H, I), indicating an impaired degranulation response in the context of HCC, although expression of granzyme B and perforin was normal (Supplementary Fig. 4). Taken together, in addition to the reduced presence of iNKT cells in HCC livers, our results demonstrated that the remaining iNKT cells exhibited impaired activation, increased exhaustion, and overall compromised cytokine production and degranulation capacity.
iNKT cells were apoptotic in HCC
To investigate how the gene expression program of iNKT cells changes in the context of HCC, we performed global transcriptomic analysis of iNKT cells FACS-sorted from WT CTRL and WT DEN livers. Our analysis revealed that 156 genes were differentially expressed between iNKT cells from healthy mice and those from HCC mice, with at least a 2-fold change (DESeq, p < 0.05) (Fig. 3A). Of those, 45 genes were downregulated and 111 were upregulated in iNKT cells from HCC livers. Strikingly, genes that are associated with cell death and impaired biosynthetic processes, such as Rock1 and Sigmar1, were upregulated in iNKT cells from HCC mice, indicating that iNKT cell fitness was compromised in the context of HCC (Fig. 3B, C). Consistent with this finding, flow cytometry analysis revealed a significant increase in the expression of active caspase 3 in iNKT cells from HCC mice compared with those from healthy mice (Fig. 3C, E), which indicates that these cells were apoptotic. In contrast, expression of active caspase 1, which is involved in pyroptosis, remained unaltered in iNKT cells, between healthy and HCC mice (Supplementary Fig. 5). Thus, our observations indicate that the HCC microenvironment may trigger induction of apoptotic pathways in iNKT cells, thus leading to severe loss and compromised function of this immune cell subset.
Fig. 3: iNKT cells were apoptotic in HCC.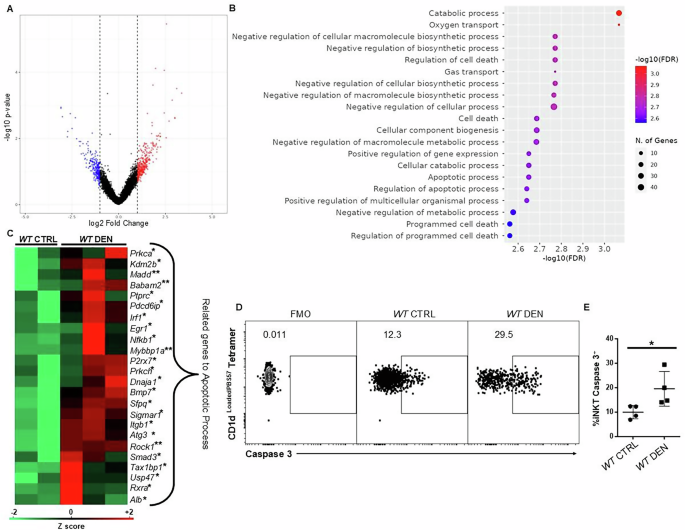
A Volcano plot showing the upregulated and downregulated genes in iNKT cells from WT CTRL and WT DEN mice. B Gene ontology analysis showing the pathways enriched among the genes that were differentially expressed. C Heatmap showing the expression of genes associated with the apoptotic process in iNKT cells from WT and WT DEN mice. D FACS plots show the expression of active caspase 3 on iNKT cells in WT and WT DEN mice. E Scatter plot showing the average expression of active caspase 3 in iNKT cells from WT DEN mice. Bars represent mean ± SD from 3 independent experiments, with one or two WT and one or two WT DEN mouse each. *, p < 0.05 by t test.
Adoptive transfer of iNKT cells may suppress liver carcinogenesis
Because iNKT cells were reduced and dysfunctional in HCC livers we hypothesized that an excess number of iNKT cells may protect from HCC. To test this hypothesis, we first analyzed mice that express a pre-rearranged Vα14 Jα18 TCRα chain (Vα14Tg/+ mice); thus, they overproduce iNKT cells from birth42. Similar to WT iNKT cells, the majority of hepatic Vα14Tg/+ iNKT cells expressed NK1.1 and were able to produce inflammatory cytokines, such as IFNγ and TNFα (Supplementary Fig. 6). Despite the higher initial iNKT cell number, Vα14Tg/+ mice developed the same number of tumors and foci as WT mice did (Supplementary Fig. 7A, B), albeit with significantly smaller size (Supplementary Fig. 7B), indicating that iNKT cells may restrict the growth of individual tumors, although they may be detrimental for tumor initiation. Therefore, we hypothesized that the provision of exogenous iNKT cells in established tumors may control tumor growth. To examine this hypothesis, we adoptively transferred FACS-sorted iNKT cells from healthy mice into WT mice exposed to DEN before and after tumor establishment. We injected iNKT cells intravenously at 1, 3, or 6 months after DEN treatment (WT DEN 1 m, 3 m, and 6 m, respectively), and mice were euthanized 9 months after DEN treatment (Fig. 4A). Using flow cytometry, we identified the adoptively transferred iNKT cells within the livers of mice, demonstrating that these cells preferentially localized to the liver (Supplementary Fig. 8).
Fig. 4: Adoptive transfer of iNKT cells suppressed liver carcinogenesis.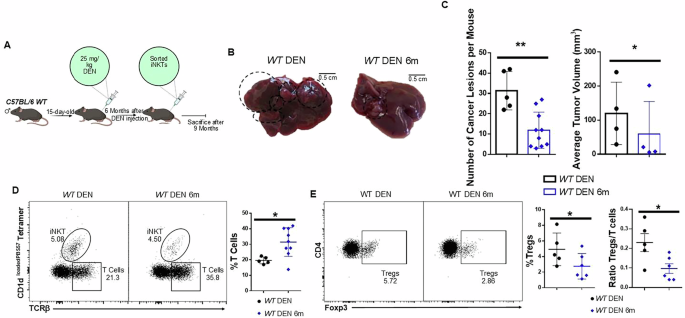
A Graphical illustration of the experimental procedure. B Liver images from WT DEN, and WT DEN with adoptive transfer of iNKT cells (WT DEN 6 m) 38–42 weeks after DEN treatment. C Scatter plots show the number of cancer lesions and bar plot shows the average tumor volume D FACS plots and scatter plots show the average percentage of T cells in WT DEN, and WT DEN 6 m mice. E FACS plots show TCRβ+CD4+Foxp3+ lymphocyte population and scatter plots show the average frequency of Treg cells and the ratio Tregs/T cells in WT DEN and WT DEN 6 m mice. Tumor volumes were measured in biological duplicates, and the mean volume of each pair was considered a single biological replicate for analysis. Bars represent mean ± SD from 4 independent experiments, with one or two WT DEN and 1–3 WT DEN with iNKT cell adoptive transfer mice. *, p < 0.05, **, p < 0.01by t test.
We found that adoptive transfer of iNKT cells at 6 months post-DEN injection resulted in consistently lower number of cancer lesions and reduced tumor volume compared to control mice that did not receive iNKT cells (Fig. 4B, C), or to mice that received iNKT cells during the early phases of HCC development (1- or 3- months following DEN treatment) (Supplementary Fig. 9). Collectively, these results suggest that iNKT cells control the growth of developing tumors when administered at later time points, while they are ineffective as an early preventive measure. Importantly, mice injected with iNKT cells exhibited significantly decreased frequency of Treg cells, while the total frequency of T cells increased—although their absolute numbers were unaffected (Supplementary Fig. 10)—thus leading to a lower Treg/T cell ratio (Fig. 4D, E), which serves as a reliable prognostic marker for cancer patients43. Taken together, our findings suggest that iNKT cells may act therapeutically to inhibit progression of established HCC, by promoting a less immunosuppressive tumor microenvironment.
CD1d-deficient mice exposed to DEN showed reduced tumor burden
Our results imply a complex role for iNKT cells in HCC development, where they influence tumor dynamics by restricting tumor growth, but may not help in halting tumor initiation. To enhance our understanding on the requirements for iNKT cells in HCC development, we analyzed CD1d−/− mice, which lack iNKT and type II NKT cells, due to inhibition of NKT cell positive selection in the thymus44. Intriguingly, compared with WT mice, CD1d−/− mice presented significantly fewer foci and tumors after DEN treatment (Fig. 5A, B), although the tumor incidence was similar between the two mouse strains (Fig. 5C). The few tumors that developed in CD1d−/− mice were significantly larger than the tumors developed in WT mice (Fig. 5D); conversely, Vα14Tg/+ mice developed tumors with lower size (Supplementary Fig. 7B), indicating that iNKT cells may help to reduce tumor growth. No significant differences were observed in body or liver weight (Fig. 5E, F), and Afp or Gpc3 mRNA levels between WT and CD1d−/− mice after DEN treatment (Fig. 1C).
Fig. 5: CD1d-deficient mice showed reduced tumor burden.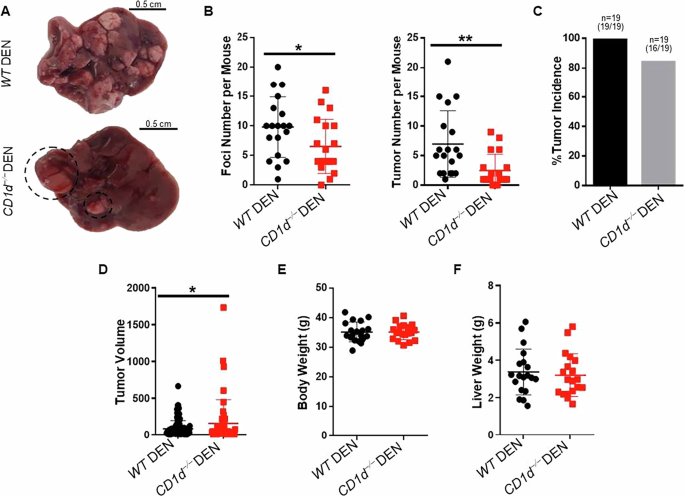
A Liver pictures from WT DEN (top) and CD1d−/− DEN (bottom) mice. B Scatter plots show foci and tumor number. C Bar plot shows the tumor incidence in WT DEN and CD1d−/− DEN mice. D Bar plot shows the tumor volume in WT DEN and CD1d−/− DEN mice. E Scatter plot shows body weight in WT DEN and CD1d−/− DEN mice. F Scatter plot shows liver weight in WT DEN and CD1d−/− DEN mice. Bars represent mean ± SD from 19 independent experiments with multiple mice for each condition. *, p < 0.05, **, p < 0.01 by t test.
Consistent with these findings, we found that tumors developed in CD1d−/− mice showed greater proliferation than WT tumors, as shown by Ki67 immunofluorescence analysis (Supplementary Fig. 11A, B). Additionally, we measured the mRNA expression of c-Jun, which has been associated with increased cell proliferation. Our results revealed that the mRNA levels of c-Jun were significantly higher in CD1d−/− DEN mice than in WT DEN mice (Supplementary Fig. 11B).
To further investigate whether the liver microenvironment in CD1d−/− mice exhibit enhanced immunosuppressive characteristics, we analyzed the mRNA expression of key immunoregulatory cytokines following DEN treatment. Anti-inflammatory cytokines Il4 and Il10 showed significantly increased mRNA expression in CD1d−/− DEN mice compared to WT DEN mice, while expression of Tgfβ remained unchanged, albeit at high levels (Supplementary Fig. 11C). Interestingly, expression of the pro-inflammatory cytokine Il6 was significantly reduced in CD1d−/− DEN-treated mice relative to WT DEN-treated mice (Supplementary Fig. 11C). Given that TGFβ alone promotes immunosuppression, but in combination with IL6 drives pro-inflammatory responses and Th17 differentiation, its unaltered expression alongside reduced Il6 levels suggests a bias toward an immunosuppressive environment in CD1d−/− livers. Taken together, these results suggest that the hepatic tumor microenvironment in CD1d−/− DEN mice is skewed toward a more immunosuppressive state, characterized by elevated anti-inflammatory cytokine expression and diminished pro-inflammatory cytokine cues. Furthermore, flow cytometry analysis revealed that the ratio of Treg-to-T cells was significantly greater in liver tumors developed in CD1d−/− than in WT mice (Supplementary Fig. 11D, E). Collectively, these data demonstrate that NKT cells limited the generation of an immunosuppressive environment and impeded cell proliferation following tumor establishment.
iNKT cells promoted initiation of HCC
Because CD1d−/− mice developed fewer liver tumors, although with similar or even larger size, we hypothesized that iNKT cells may be required for HCC initiation. To test this hypothesis, we examined HCC development at various intervals (5, 7, and 9 months) after DEN treatment in WT, Vα14Tg/+ and CD1d−/− mice (Fig. 6A). At 5 months, WT DEN mice developed a few pre-cancerous lesions without any tumor development, whereas CD1d−/− mice developed no pre-cancerous lesions or tumors (Fig. 6B, upper panel, and C). At 7 months, WT DEN mice presented both pre-cancerous lesions and small tumors, whereas CD1d−/− DEN mice still showed no lesions or tumors (Fig. 6B, middle panel, and C). In contrast, Vα14Tg/+ mice displayed significantly more lesions than WT mice did at 5 months after DEN treatment, followed by an equivalent number of small tumors at 7 months (Fig. 6B, C). By 9 months, both WT DEN and CD1d−/− DEN mice developed HCC, as expected. However, compared with WT mice, CD1d−/− mice had significantly fewer foci and tumors (Fig. 6B, lower panel, C). Consistent with the previous time points, Vα14Tg/+ mice displayed a phenotype comparable to that of WT mice 9 months after DEN treatment. Furthermore, we used flow cytometry to investigate whether the presence of M1-like and M2-like phenotypes of macrophages, which have anti- and pro-tumor functions, respectively. However, we did not observe any changes in macrophage phenotypes between WT and CD1d−/− mice (Supplementary Fig. 12). Taken together, our results show that an increased number of iNKT cells during the pre-cancerous phase of HCC accelerated tumor development, whereas the absence of iNKT cells resulted in a delay in HCC development.
Fig. 6: iNKT cells promoted initiation of HCC.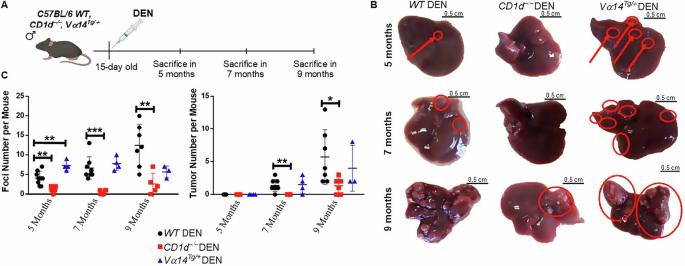
A Graphical illustration of the experimental procedure. B Liver images from WT DEN, CD1d−/− DEN and Vα14Tg/+ DEN mice in 5, 7 and 9 months after DEN treatment. Red arrows: foci. C Scatter plots show the foci and tumor numbers during HCC development in WT DEN, CD1d−/− DEN and Vα14Tg/+ DEN mice. Bars represent mean ± SD from 3 independent experiments, with 1–3 mice in each time point. *, p < 0.05, **, p < 0.01 and ***, p < 0.001 by t test.
iNKT cells contributed to liver damage during DEN-induced inflammation
Our results suggest that iNKT cells support the initiation of HCC after DEN treatment in mice. Therefore, we investigated the function of iNKT cells during HCC initiation 48 h after DEN treatment in 15-day-old mice. Histological analysis showed several damaged lesions in DEN-treated livers (Fig. 7A), while blood alanine aminotransferase (ALT) and aspartate aminotransferase (AST) levels were elevated, indicating mild liver damage upon short-term DEN treatment (Fig. 7B). The percentage and number of both iNKT and conventional T cells were lower in DEN-treated WT mice than in untreated mice (Supplementary Fig. 13A, B). Interestingly, iNKT cells showed an activated phenotype, as assessed by the shift in CD69 expression (Fig. 7C, D), whereas conventional T cells did not show signs of activation (Supplementary Fig. 13C).
Fig. 7: iNKT cells contributed to liver damage during DEN-induced inflammation.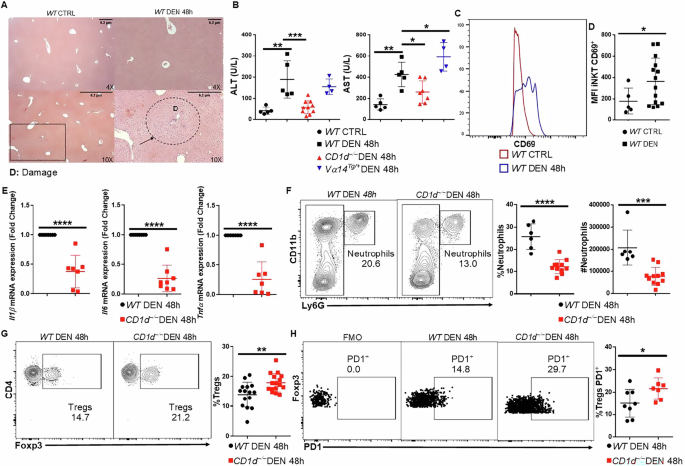
A H&E histology from WT CTRL and WT DEN 48 h after DEN injection in ×4 and ×10 magnification. Black arrow, damaged lesions. B Scatter plots show the levels of liver transaminases ALT and AST from WT CTRL, WT DEN, CD1d−/− DEN, and Vα14Tg/+ DEN mice 48 h after DEN administration. C Scatter plot shows the MFI of CD69 in iNKT cells. D Scatter plot shows the average expression of CD69 in iNKT cells from WT CTRL and WT DEN 48 h after DEN. E Scatter plots show the average mRNA expression of the inflammatory markers Il1β, Il6, and TNFα in WT DEN and CD1d−/− DEN 48 h after DEN injection. F FACS plots of CD11b+Ly6G+ and scatter plots show the average percentage and number of neutrophils. G FACS plots and scatter plot show TCRβ+CD4+Foxp3+ lymphocyte population. H FACS plots and scatter plot show the percentage of activated (PD1+) Tregs. Bars represent mean ± SD from 5 independent experiments for ALT and AST measurements with one WT CTRL, one WT DEN and two CD1d−/− DEN mice together with one Vα14Tg/+ DEN except from one experiment, 5 independent experiments for CD69 presence in iNKT with one WT CTRL and 1–3 WT DEN mice, 7 independent experiments for Il1β and Tnfα expression with one WT DEN and one CD1d−/− DEN and 8 independent experiments for Il6 expression with one WT DEN and one CD1d−/− DEN mice, 6 independent experiments for percentage and number of neutrophils with one WT DEN and one or two CD1d−/− DEN mice, 6 independent experiments for Tregs percentage with one-three WT DEN mice and one- three CD1d−/− DEN mice and 3 independent experiments for activation of Tregs with one- three WT DEN mice and one- three CD1d−/− DEN mice. *, p < 0.05, **, p < 0.01, ***, p < 0.001, ****, p < 0.0001 by t test.
Remarkably, CD1d−/− DEN mice presented significantly lower ALT and AST levels than WT DEN mice, indicating reduced liver damage (Fig. 7B). Conversely, Vα14Tg/+ mice presented significantly elevated AST levels than did WT DEN mice, indicating an increased degree of liver damage (Fig. 7B).
To assess inflammation levels, we first quantified by qPCR the mRNA expression levels of Il1β, Il6, and Tnfα, which have pathogenic roles in the liver. All three cytokines were found to be expressed at lower levels in CD1d−/− than in WT mice treated with DEN (Fig. 7E), suggesting absence of inflammation in mice lacking iNKT cells. Consistent with these findings, flow cytometry analysis during HCC initiation revealed that CD1d−/− DEN mice presented significantly lower percentage and number of neutrophils (CD11b+Ly6G+) than WT mice treated with DEN (Fig. 7F). In contrast, the frequency and number of neutrophils were unaffected in Vα14Tg/+ DEN compared with WT DEN mice (Supplementary Fig. 14A, B). Additionally, the percentage and activation45,46 of Treg cells (TCRβ+CD4+Foxp3+) were notably greater in the CD1d−/− DEN than in WT DEN mice (Fig. 7G, H), but lower in Vα14Tg/+ DEN mice (Supplementary Fig. 14C–E). Collectively, these results indicate that iNKT cells physiologically function to promote DEN-induced HCC, which may in turn contribute to HCC in mice.