
More than 750,000 New Zealanders currently live in areas at risk of major flooding – a number that could rise to 900,000 with three degrees of global warming.
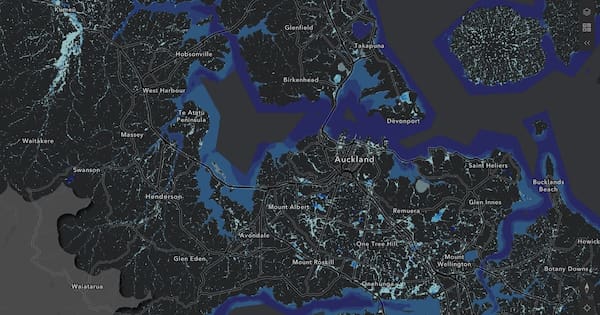
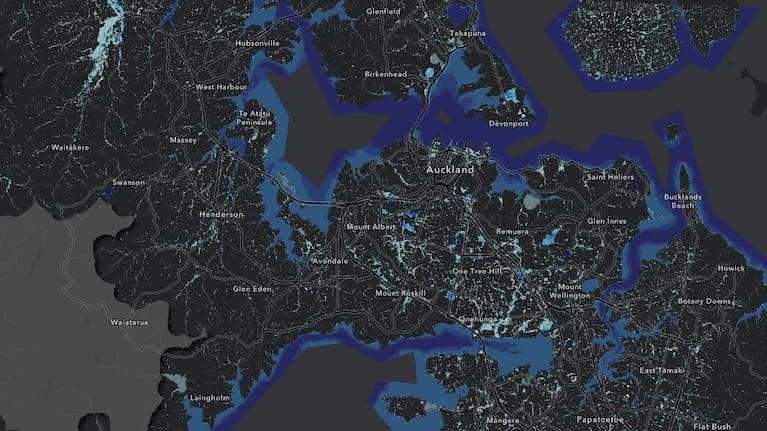
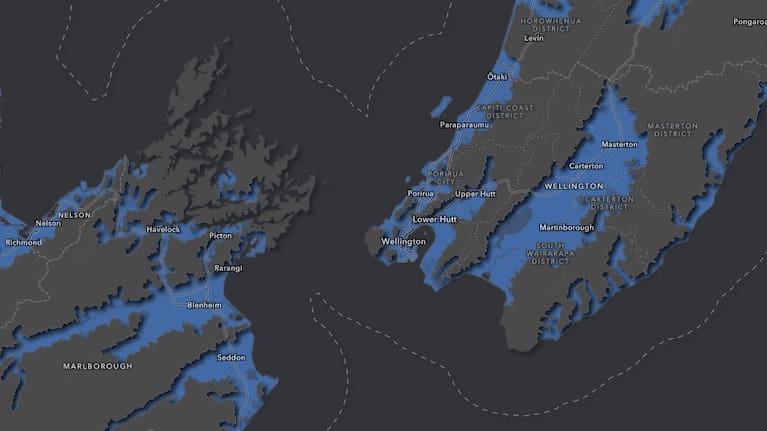
The figures come from a five-year national research programme led by Earth Sciences New Zealand, which has also launched the country’s first consistent nationwide flood hazard viewer.
The online tool allows people to see whether their homes or communities fall within areas at risk from one-in-100-year rainfall events, and how that exposure could change under future climate scenarios.
“Currently it’s around 750,000 people who are affected — with three degrees of warming that could go up to 900,000,” said Dr Emily Lane, principal hazards scientist at Earth Sciences NZ. “That’s the number of people whose houses are directly exposed to flooding.”
She said the indirect impacts are far greater.
“Even if your house doesn’t flood, if you can’t get to work, or your children can’t get to school, or there’s a supply chain taken out because of flooding — the effects are on a far wider group of people.”
A new national picture
Until now, flood maps were managed by local and regional councils, often using different methods. Lane said this new viewer fills major gaps and allows New Zealanders to compare flood risk across regions for the first time.
“One of the best things you can do to keep people safe is having them know they are in a hazardous place,” she says.
“While it might be uncomfortable to discover that, it’s actually better to know than to live in ignorance until your house does get flooded.”
The viewer links to existing regional maps where available, or provides baseline data for areas where local information hasn’t yet been produced.
“In the past, some regional councils already had that information, but it wasn’t there everywhere. With this, you can go to one place and see if flooding looks like a hazard around where you live,” Lane said.
She encouraged anyone buying property to check flood information before signing.
“It’s far better to know. Insurance companies already have this kind of data from overseas providers, so it’s better that everyone can access the same information and understand their risk.”
Billions of dollars in buildings and infrastructure at stake
Researchers estimate around $235 billion worth of buildings are currently exposed to major flood events — a figure that could reach $288 billion with three degrees of warming.
“That’s just the current housing stock,” Lane said. “If we keep building in flood-hazard places, that could be far worse.”
She says the findings underline the need for smarter planning decisions.
“We need to make sure we don’t build any more in the most hazard-prone areas and over time think about how we can move people out of those zones. It’s difficult and will take time and money, but starting by not building any more is really important.”
Next steps: Towards a national flood map
The Government recently announced plans for an official National Flood Map, which will integrate rainfall and coastal flood risks.
Lane said the new research has laid vital groundwork for that.
“I view that as a success of this project to show both that it’s possible and that it’s important,” she said. “That national map will be very important because it pulls together freshwater flooding, coastal flooding, and local council maps to provide good information all the way down to specific houses.”
She hoped the new viewer and the upcoming national map will help communities, councils and central government make more informed decisions about adaptation and resilience.
“Adaptation is really important, but the starting point is having the right information,” Lane says. “That’s how resilience is built — by knowing that you’re in a hazard zone and being ready for it.”