
Data Source
For the calculation of the SIR, we utilized several public datasets provided by different sources. Marco Mingione et al. made the data on positive cases directly available for download on their GitHub page17. We define positive cases as laboratory-confirmed human WNV cases meeting EU criteria, including neuroinvasive disease and non-neuroinvasive fever; asymptomatic blood-donor detections and imported cases are excluded16,20,21. Detection practices evolved across years and regions (e.g., testing intensity for WNF, donor screening uptake); therefore, the SIR standardizes for age composition but remains sensitive to heterogeneity in case ascertainment.For population data (provincial, single year of age) we used the official ISTAT endpoints following the I.Stat → IstatData migration: 2019–2024 from the IstatData DataBrowser (dataset DCIS_POPRES1) and 2012–2018 from the legacy interface, harmonizing NUTS-3 identifiers and age strata across sources22,23.
ISTAT is a public organization that provides statistical information about the Italian territory and population.
Table 1 describes all the variables used for the calculation of the SIR.
Table 1 List of variables, with respective definitions and data sources, used to compute Standardized Incidence Ratio.Observed number of positives (Op, y)
We define Op, y as the annual count of laboratory-confirmed human West Nile virus infections assigned to the province (p) of exposure and stratified by age classes, as reported in the national ISS surveillance bulletins in year y. In line with the EU surveillance case definition (Decision (EU) 2018/945) and its adoption in Italy, confirmed cases meet clinical and laboratory criteria20. For the purpose of incidence estimation, we include clinical presentations classified as neuroinvasive disease and non-neuroinvasive fever, while we exclude asymptomatic detections in blood donors and imported cases. Weekly bulletin counts are aggregated to yearly totals by province and age group before computing the SIR. Human case data are taken from the curated, bulletin-derived open dataset by Mingione et al., which standardizes provincial identifiers and age strata and provides the per-year CSV files used here16. The ISS bulletins and the integrated national plan describe surveillance flows, case classifications, and reporting by province of exposure21,24.
The data on human positive cases for WNV can be downloaded from the GitHub repository (https://github.com/fbranda/west-nile)17. The file “latest-wnv.csv” contains all positive WNV cases, including humans, horses, mosquitoes, and birds. The data are provided at the provincial level and cover the period 2012–2024. We aggregated the data by age group and symptoms to avoid information loss. The final dataset is available on the Dryad platform.
Age-specific number of positive cases of reference population (Pi, y)
Using the surveillance dataset curated by Mingione et al.16, it has been possible to estimate the number of WNV-positive cases in the reference population, stratified by age groups. Specifically, the data are divided into the following five age groups: “<=14, 15–44, 45–64, 65–74, >=75.” We define 𝑖 as the age-group index. The reference population, as detailed in the section “Standardized Incidence Ratios Computation,” consists of all provinces that tested positive in the reference year.
Resident population at provincial (ni, p, y) and national levels (Ni, y)
The total resident population at provincial level (ni, p, y) was retrieved from the ISTAT data warehouse. Following the recent migration from I.Stat to the new IstatData platform, provincial resident-population series by single year of age are split across two official endpoints. For years 2019–2024 we retrieved data from the IstatData DataBrowser (dataset DCIS_POPRES1). For years 2012–2018 we used the legacy ISTAT interface providing annual population estimates by single year of age. We harmonized province identifiers (NUTS-3), age strata, and field names across sources and verified year-to-year continuity prior to computing SIR22,23.
The reconstruction process takes into account demographic flows such as births, deaths, migration and acquisition of citizenship. The data are stratified by age, with a resolution of 1 year, from 0 to over 100 years, and additionally grouped by provinces. The population values at national level (Ni, y) were then calculated directly by an aggregation process.
Standardized Incidence Ratios computation (SIR)
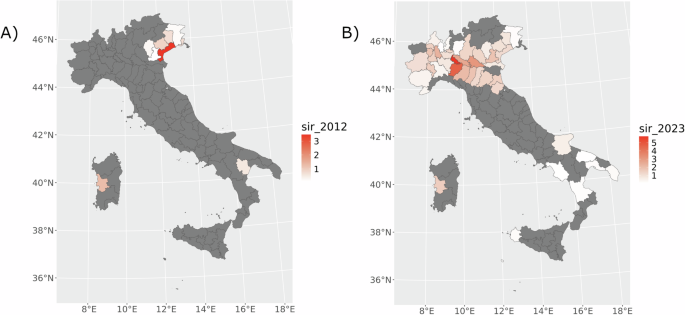
In this study, we focused on calculating the Standardized Incidence Ratio (SIR) for WNV cases in humans. This index compares the number of recorded positive cases, in our case at the Italian provincial level, with the expected number of positive cases in the reference population, in our analysis the subset of Italian provinces reporting at least one case in each given year (2012–2024).
The SIR eliminates the effect of population size in a province, as it is standardized by the population of both the province under examination and the reference population25. This standardization enables comparisons between provinces with different population sizes. Consequently, the SIR facilitates epidemiological analyses while minimizing potential biases associated with different study areas. In this framework, the SIR is a relative, age-adjusted metric: SIR > 1 indicates more cases than expected given the province’s age structure (excess risk relative to the reference), SIR = 1 indicates parity with expectation, and SIR < 1 indicates fewer cases than expected. The SIR complements—rather than replaces—crude incidence per 100,000, especially when comparing small areas or sparse counts. Its use and interpretation are well established in disease mapping and public-health surveillance26,27.
A critical aspect of calculating the SIR is the choice of the reference population. In the case of WNV, many provinces report no positive cases. This could introduce bias in the distribution of SIR values, leading them to all exceed 1, thereby failing to provide meaningful information.
To solve this problem, we included only those provinces in the reference population that reported at least one positive case in the year in question. This approach ensured that the resulting SIR values were between less than 1 and more than 1, thus providing the desired insight.
The SIR value also considers the possible effects of age and gender within the analyzed population. Advancing age substantially increases the risk of WNV neuroinvasive disease and the likelihood of clinical detection and reporting; therefore, age strongly influences observed case counts and motivates age standardization in our analyses28,29. In some cases, age-specific information was not available in the downloaded dataset. In order to avoid underestimating the number of positives, we standardized these data using the average population across all age groups.
We calculated the SIR for each available year between 2012 and 2024. The mathematical expression of the SIR is as follows:
$$SI{R}_{p,y}=\frac{{O}_{p,y}}{{E}_{p,y}}$$
(1)
where Op, y and Ep, y are the observed and the expected number of recorded cases for province p and year y, respectively. Ep, y is defined as:
$${E}_{p,y}=\mathop{\sum }\limits_{i=1}^{5}{R}_{i,y}^{P}\ast {n}_{i,p,y}$$
(2)
in which \({R}_{i,y}^{P}\) is the age-specific incidence rates of the reference population and ni, p, y is the age-specific population size for the given locality. In particular \({R}_{i,y}^{P}\) is calculated using the formula:
$${R}_{i,y}^{P}=\frac{{P}_{i,y}}{{N}_{i,y}}$$
(3)
\({R}_{i,y}^{P}\) is obtained dividing the number of positive cases by age of the reference population Pi, y with the age-specific reference population size Ni, y.