
Mice and drug treatments
All mouse experiments were approved by CSHL Internal Animal Care and Use Committee (protocol number 21-4). All relevant animal use guidelines and ethical regulations were followed. Mice were maintained under specific pathogen-free conditions. Housing was on a 12-h/12-h light/dark cycle under standard temperature and humidity of approximately 18–24 °C and 40–60%, respectively. The following mice from The Jackson Laboratory were used: 3-month-old C57BL/6 J mice (000664), 18- to 20-month-old C57BL/6 J mice (000664) and 6-week-old and 18-month-old B6.SJL-Ptrca Pepcb/BoyJ (CD45.1 mice) (002014) and 17- to 25-month-old Lgr-EGFP-IRES-creERT2 mice (008875). Mice of both sexes were used at 3 months of age and 18–20 months of age for the aging experiments and females of 6–10 weeks old for T cell isolation. For dasatinib and quercetin treatments, mice were administered dasatinib (50 mg kg−1) (Sigma, CDS023389-25MG) and quercetin (Sigma, Q4951-100G) resuspended in 10% ethanol, 30% polyethylene glycol and 60% Phosal by oral gavage twice a week for 6 weeks as described previously21. For abdominal irradiation experiments, mice were irradiated locally once with 15 Gy in the abdomen with the help of a lead protector device covering the rest of the body. For Edu administration, Edu (Thermo Fisher Scientific, A10044) was injected at 0.5 mg kg−1 4 h before euthanasia as described elsewhere44. For BODIPY 500/510, C1,C12 administration, BODIPY 500/510, C1,C12 (Thermo Fisher Scientific, D3823) was administered by oral gavage (10 μl g−1 body weight) 2 h before euthanasia as described previously51. For adoptive T cell transfer, mice were treated with one intraperitoneal injection of cyclophosphamide 200 mg kg−1 (Sigma, C0768) 18 h before T cell injection as described elsewhere25. For bone marrow transplant, mice were treated with three consecutive daily doses of busulfan 30 mg kg−1 (Sigma, B2635-10G) a week before. Ovalbumin-Texas red (Thermo Fisher Scientific, O23021) was administered by oral gavage at 1 mg kg−1 1 h before euthanasia as described previously52. Immunization with ovalbumin was performed by administering 1 mg OVA (Sigma, A7641) by oral gavage three times at 1-week intervals as described elswehere53. Mice were kept in group housing. Mice had free access to food and water and were fed PicoLab Rodent Diet 20 (LabDiet). Mice were randomly assigned to the experimental groups.
Human samples
De-identified human normal colon tissue samples were obtained from colon adenocarcinoma patients (female 91 years of age, female 51 years of age and male 83 years of age) undergoing surgical resection procedures at Huntington Hospital, with written informed consent. All human studies complied with all relevant guidelines and ethical regulations and were reviewed and approved by the Northwell Health Biospecimen Repository (protocol number 1810).
Intestinal crypt isolation and flow cytometry
As previously reported6,44, whole small intestine was removed, washed with cold PBS − /−, opened laterally and cut into 3–5 mm fragments. Pieces were washed multiple times with ice cold PBS − /− until clean, washed 2–3 with ice cold 1X PBS, and incubated in PBS/EDTA (7.5 mM) with mild agitation for 30 min at 4 C. Crypts were then mechanically separated from the connective tissue by shaking, and filtered through a 70-μm mesh into a 50 ml conical tube to remove villus material and tissue fragments. Crypts were removed from this step for crypt culture experiments and embedded in Matrigel (Corning 356231 growth factor reduced) with crypt culture media. Crypts were removed from this step for protein isolation. For EpCAM+ cell isolation, the crypt suspensions were dissociated to individual cells with TrypLE Express (Thermo Fisher Scientific, 12604039) and stained for flow cytometry. Epithelial cells were isolated as SYTOX−, CD45− EpCAM+ with a BD FACS Aria II SORP cell sorter into supplemented crypt culture medium for culture. For experiments with Lgr5-GFP mice, cells were sorted as GFP−, CD24+ or GFP+ uPAR+ or GFP+ uPAR− with a BD FACS Aria II SORP cell sorter into supplemented crypt culture medium for culture. uPAR+ and uPAR− populations were isolated as DAPI−, uPAR+/− with a SONY cell sorter(SH800S). For immune phenotyping, dissociated crypt suspensions were stained for flow cytometry. For this, Fc receptors were blocked using FcR blocking reagent, mouse (Miltenyi Biotec). The following fluorophore-conjugated antibodies were used: PE-uPAR (FAB531P, R&D systems, lot ABLH0521021), AF700-uPAR (FAB531N, R&D systems, lot AFNL0122081), BV785-CD45.1 (110743, BioLegend, lot B319039), AF488-CD3 (100210, BioLegend, lot B364217), BUV395-CD4 (563790, BD Biosciences, lot 1165066), PE-Cy7-CD8 (100722, BioLegend, lot B282418), BV421-CD62L (104435, BioLegend, lot B283191), APCCy7-CD44 (560568, BD Biosciences, lot 1083068), BV650-LAG3 (125227, BioLegend, lot B333220), BV510-PD1 (BioLegend, 135241, lot B342120), BV605-CD25 (102035, BioLegend, lot B354812), APC-EpCAM (118214, BioLegend, lot B280290), FITC-CD45 (103102, BioLegend, lot 2041142), FITC-MHC-II (11-5321-82, Invitrogen, lot 2442242), PE-CD153 (12-1531-82, Invitrogen, lot 2504402), BV510-PD1 (135241, BioLegend, lot B342120), BV711-CD45.2 (109847, BioLegend, lot B348415), PE-Texas red-CD28 (102124, BioLegend, lot B376397), BUV737-KLRG1 (741812, BD Biosciences, lot 2327039), BUV395-CD11b (563553, BD Horizon, lot 3346840), PerCP-Cy5.5-CD11c (117328, BioLegend, lot B332774), APC-Cy7-Ly6C (128026, BioLegend, B309226), BV605-Ly6G (563005, BD Biosciences, lot 3187156), PE-TR-F4/80 (61-4801-82, Invitrogen, 2452260), AF700-uPAR (FAB531N, R&D systems, lot 1656339), PE-CD19 (553786, BD Pharminogen, 1312594), BV650-CD19 (563235, BD Biosciences,4213621), PE-Cy7-CD3 (100220, BioLegend, B401339), BV711-CD24 (101851, BioLegend, B446985). Ghost UV 450 Viability Dye (13-0868-T100, Tonbo Biosciences lot D0868083018133) or SYTOX Blue dead cell stain (Thermo Fisher Scientific, S34857; lot2491422) or DAPI (Sigma, 32670-5MG-F) was used as viability dye. Flow cytometry was performed on a LSRFortessa instrument (BD Biosciences), and data were analyzed using FlowJo (TreeStar).
Bone marrow isolation and flow cytometry
For whole bone marrow isolation, single-cell suspensions were prepared by crushing the femurs, tibias, and iliac crests of each mouse using a mortar and pestle on ice. The resulting suspensions were filtered through a 70 μm cell strainer, and red blood cells were lysed using ACK lysing buffer (Gibco) for 5 min on ice. Lysis was quenched with a twofold volume of FACS buffer (1× PBS supplemented with 2% FBS), followed by centrifugation at 300 × g for 5 min at 4 °C. To block Fc receptors, cells were incubated with FcR blocking reagent, mouse (Miltenyi Biotec) for 10 min at 4 °C. CD45.1− and CD45.2+ populations were isolated as DAPI−, CD45.1− and CD45.2+ with a SONY cell sorter (SH800S). For immune phenotyping, single-cell suspensions were stained for flow cytometry. For this, Fc receptors were blocked using FcR blocking reagent, mouse (Miltenyi Biotec). The following fluorophore-conjugated antibodies were used: BV785-CD45.1 (110743, BioLegend, lot B319039), BV711-CD45.2 (109847, BioLegend, lot B348415), BV650-CD19 (563235, BD Biosciences, 4213621), PE-Cy7-CD3 (100220, BioLegend, B401339), PerCP-Cy5.5-CD11c (117328, BioLegend, lot B332774), BUV395-CD11b (563553, BD Horizon, lot 3346840), APC-Cy7-Ly6C (128026, BioLegend, B309226), BV605-Ly6G (563005, BD Biosciences, lot 3187156), FITC-MHC-II (11-5321-82, Invitrogen, lot 2442242). Ghost UV 450 Viability Dye (13-0868-T100, Tonbo Biosciences lot D0868083018133) or DAPI (Sigma, 32670-5MG-F) was used as viability dye. Flow cytometry was performed on a LSRFortessa instrument (BD Biosciences), and data were analyzed using FlowJo (TreeStar).
Peripheral blood isolation and flow cytometry
Peripheral blood was collected via submandibular puncture using an 18 G needle. A 15 μl aliquot of whole blood was lysed in ACK lysing buffer (Gibco) for 5 min on ice. Lysis was quenched with a twofold volume of FACS buffer, followed by centrifugation at 300 × g for 5 min at 4 °C.
Fc receptors were subsequently blocked using FcR blocking reagent, mouse (Miltenyi Biotec). The following fluorophore-conjugated antibodies were used: BV785-CD45.1 (110743, BioLegend, lot B319039), BV711-CD45.2 (109847, BioLegend, lot B348415), BV650-CD19 (563235, BD Biosciences, 4213621), PE-Cy7-CD3 (100220, BioLegend, B401339), PerCP-Cy5.5-CD11c (117328, BioLegend, lot B332774), BUV395-CD11b (563553, BD Horizon, lot 3346840), APC-Cy7-Ly6C (128026, BioLegend, B309226), BV605-Ly6G (563005, BD Biosciences, lot 3187156), FITC-MHC-II (11-5321-82, Invitrogen, lot 2442242). Ghost UV 450 Viability Dye (13-0868-T100, Tonbo Biosciences, lot D0868083018133) or DAPI (Sigma, 32670-5MG-F) was used as viability dye. Flow cytometry was performed on a LSRFortessa instrument (BD Biosciences), and data were analyzed using FlowJo (TreeStar).
scRNA-seq
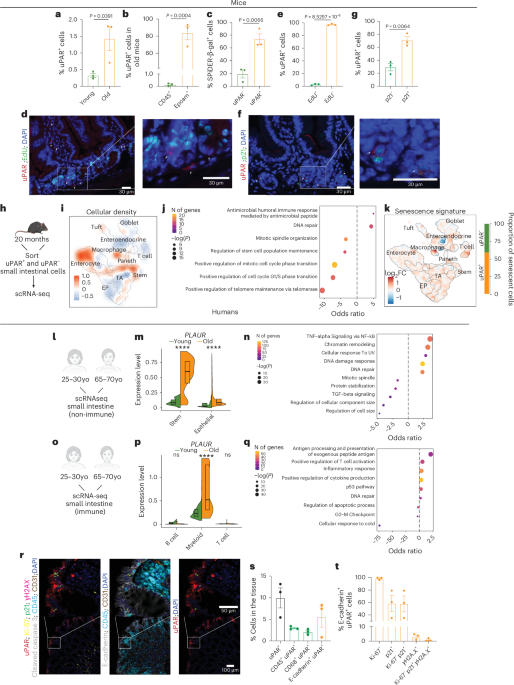
Three scRNA-seq experiments were conducted in mice: 1) whole small intestine from young and old UT or uPAR CAR T (m.uPAR-m.28z)-treated mice 6 weeks after treatment, 2) sorted uPAR+ or uPAR− cells from aged intestines, and 3) whole small intestine from young (3 months) mice were treated with UT or uPAR CAR T cells 15 months after treatment. In the CAR T treatment dataset a total of four replicates per treatment groups (uPAR & UT) with stratified sampling of age and sex (two males and two females per age and treatment group). For the uPAR+ or uPAR− dataset there were two replicates per sample totaling two females and two males. For the dataset from young mice treated with uPAR CAR T cells for 15 months there is one replicate each from the UT- and uPAR-treated groups. Additionally, we analyzed publicly available human scRNA-seq data from a previous study35. Analysis of the human data was conducted on the duodenum, jejunum and ileum of young (aged 25–30 years) and old (aged 65–70 years) patients and intestinal immune cells from young (aged 25–30 years) and old (aged 65–70 years) patients. Single-cell datasets for each experiment were independently assessed for data quality following the guidelines described previously54,55. After QC, Seurat (v4.0.3 (ref. 56)) was used for normalization, graph-based clustering and differential expression analysis. Each dataset was normalized using SCTransform and the 2,500 most variable genes were identified with SelectIntegrationFeatures. The CAR T cell treatment dataset was integrated by sample into a singular dataset via using the PrepSCTIntegration, FindIntegrationAnchors, and IntegrateData functions57. Likewise, the uPAR sorted dataset was integrated by the sex of the samples using the PrepSCTIntegration, FindIntegrationAnchors, and IntegrateData functions to retain differences in clustering between treatment conditions. MAGIC imputation was conducted on integrated data to impute missing values and account for technical noise58. RunPCA was implemented on the integrated datasets to identify the top principal components that were used for UMAP analysis and clustering. Louvain clustering at a resolution of 1 was implemented. Clusters were labeled in accordance with expression levels of intestinal epithelial subtype signatures identified previously33. Scores were assigned calculating the average z-score of the average expression of the genes in each cell. Wilcoxon rank-sum tests to determine if differences in metagene scores was significant was conducted using the wilcox.test function in stats (v4.1.0, R Core Team, 2021). Senescent cells were identified by first creating metagene scores for senescence using the signatures described previously34. Cells expressing the metagene signature greater than the inflection point of the distribution of expression were deemed to be senescent. Differential expression analysis was conducted using the FindMarkers function with the MAST method to correct for covariates such as sex and evaluate differences within the transcriptome59. Gene set enrichment analysis was conducted on differentially expressed genes (of either logFC >0.1 or < −0.1 and adjusted P <.05) using the enrichR package (v3.2 (ref. 60)). Monocle3 (v1.3.4 ref. 61)) was used for pseudotime trajectory analysis of the CAR T treatment dataset.
Organoid culture for crypts and isolated cells
Isolated crypts were counted and embedded in Matrigel (Corning, 356231 growth factor reduced) at 5–10 crypts μl−1 and cultured in a modified form of medium as described previously62. Unless otherwise stated, Advanced DMEM (Thermo Fisher Scientific, 12491023) with 10% penicillin/streptomycin (GeminiBio, 400-109) was supplemented by EGF 40 ng ml−1 (Peprotech, 315-09), Noggin 50 ng ml−1 (Peprotech, 250-38), R-spondin 62.5 ng ml−1 (Peprotech, 315-32), N-acetyl-L-cysteine 1 μM (Sigma-Aldrich, A9165), N2 1X (Gibco, 17502-048), B27 1X (Gibco, 17504-044), CHIR-99021 10 μM (Tocris, 4423) and Y-27632 dihydrochloride monohydrate 20 ng ml−1 (Tocris, 1254). Then, 25 μl drops of Matrigel with crypts were plated onto a flat-bottom 48-well plate (Corning, 3524) and allowed to solidify for 5–6 min in a 37 °C incubator. Five hundred microliters of crypt culture medium were then overlaid onto the Matrigel, changed every other day and maintained at 37 °C in fully humidified chambers containing 5% CO2. Clonogenicity (colony-forming efficiency) was calculated by plating 50–300 crypts per well and assessing organoid formation 3–7 days or as specified after initiation of cultures. Organoids were propagated as previously described6,44. For secondary subculture experiments, primary organoids were separated for a duration of 6 min using TrypLE Express (Thermo Fisher Scientific, 12604039) at a temperature of 37 °C. The resulting dissociated single cells were counted and plated equally in Matrigel and left to solidify. GFP⁺ Lgr5⁺ ISCs (ISCs; CD45⁻, EpCAM⁺, CD24−, Lgr5-GFP⁺) were sorted by flow cytometry into uPAR⁺ and uPAR⁻ populations in equal numbers, along with Paneth cells (CD45⁻, EpCAM⁺, CD24⁺). Cells were centrifuged at 300 × g for 5 min. A total of 50,000 uPAR⁺ or uPAR⁻ ISCs were resuspended in crypt culture medium containing an equal number of Paneth cells and seeded into 25–30 μl Matrigel (Corning) per well, in a flat-bottom 24-well plate. After solidification, Matrigel was supplemented with crypt medium containing 1 μM Jagged (Anaspec). Crypt culture medium was replaced every 2–3 days, and organoids were quantified on day 8 of culture. The culture medium was refreshed every other day with fresh crypt media, and the organoids were maintained at 37 °C in a fully humidified chamber with 5% CO2. Several random, non-overlapping brightfield images were acquired from each well using a Nikon Eclipse TS2 microscope equipped with 4×/0.13 NA and 10×/0.25 NA objective lenses. Organoids were imaged directly in their culture wells. Quantification was performed using Fiji software as described previously4,6,63,64,65,66,67,68,69,70,71, and viability was assessed based on morphological criteria, including lumen appearance and overall structural integrity. Organoids exhibiting a darkened lumen and disrupted or collapsed structure were classified as nonviable. In contrast, organoids with an intact structure and clear, well-defined borders were considered viable. The classification was guided by both image-based metrics and visual inspection to ensure accurate distinction between live and dead organoids as performed previously4,6,63,64,65,66,67,68,69,70,71.
Organoid transduction
Organoids derived from 18-month-old mice were mechanically dislodged from the culture plate using cold Cell Recovery Solution (Corning) and transferred to a 1.5 ml microcentrifuge tube. After removing the CRS and Matrigel, organoid pellets were incubated with 500 μl TrypLE Express at 37 °C. To facilitate dissociation, the organoids were pipetted gently every 2 min during the incubation. The reaction was then quenched with crypt culture medium. For viral transduction, 10 μg ml−1 Polybrene (Sigma-Aldrich) was added to crypt culture medium containing the blasticidin-resistant Cas9-expressing lentivirus (Addgene, catalog no. 52962) and mixed gently. Dissociated intestinal organoids were resuspended in the virus-containing medium and transferred to a 48-well plate. Plates were centrifuged at 600 × g for 1 h at room temperature and subsequently incubated at 37 °C for 4 h. After incubation, cells were embedded in Matrigel and plated for culture. To select for organoids transduced with the blasticidin resistance cassette, crypt culture medium containing 1 μg ml−1 blasticidin was added 3 days after transduction. After selection and confirmation of Cas9 expression in aged intestinal organoids, Cas9⁺ organoids were transduced with a puromycin-resistant lentiviral plasmid (pUSEPR (U6-sgRNA-EFS-Puro-P2A-TurboRFP)72 encoding either a non-targeting control sgRNA or sgRNAs targeting Plaur (guide 1: AAGGATGAGGACTACACCCG or guide 2: AACTACACCCACTGCAATGG), as described above, to generate control and Plaur KO organoids. To select for successfully transduced cells, crypt culture medium containing 1 μg ml−1 puromycin was added 3 days after transduction.
Organoid bulk RNA sequencing
Young (3 months) and old (18 months) mice were treated with 0.5 × 10⁶ untransduced T cells (UT) or uPAR CAR T cells (m.uPAR-m.28z). Mice were harvested 8 weeks after infusion, and organoids were generated from their intestinal crypts. 5 days after generation, organoids were harvested as described above and subjected to bulk RNA sequencing. The resulting RNA-seq data were analyzed by removing adaptor sequences using CutAdapt73. RNA-seq reads were then aligned with STAR74, and the transcript count was quantified using featureCounts75 to generate a raw-count matrix. Differential gene expression analysis and adjustment for multiple comparisons were performed using the DESeq2 package76 between experimental conditions, with at least two independent biological replicates per condition, implemented in R (http://cran.r-project.org/). Genes were determined to be differentially expressed based on a greater than twofold change in gene expression with an adjusted P value of less than 0.05. For lollipop visualization of enriched pathways, differentially expressed genes were calculated with DESeq2 using the method ashr77 for LFC shrinkage and preranked based on log2FC. Preranked genes were analyzed using GSEA78 to calculate enriched pathways based on Molecular Signature Database
Hallmark 2025 signatures and an ISC signature33. Graphs were generated by the GSEA program or plotted in R using the ggplot2 package. P values in GSEA were calculated using a two-sided non-parametric permutation test, where phenotype labels were randomly permuted 1,000 times to generate a null distribution of enrichment scores, with false discovery rate correction applied for multiple comparisons. The normalized enrichment score accounts for differences in gene set size by normalizing the enrichment score to the mean enrichment score of the same gene set across all permutations and is calculated using a weighted Kolmogorov-Smirnov test.
Histological analysis
Tissues and organoids were fixed overnight in 10% formalin, embedded in paraffin and cut into 5-μm sections. Sections were subjected to hematoxylin and eosin (H&E) staining. Immunohistochemical staining was performed following standard protocols. The following primary antibodies were used: uPAR (AF534, R&D systems, lot DCL0724051, cleaved caspase-3 (9664S, Cell Signaling Technology, lot 22), EpCAM (93790S, Cell Signaling Technology, lot 3), Olfm4 (39141S, Cell Signaling Technology, lot 4), F4/80 (70076S, Cell Signaling Technology, lot 9), p21 (ab107099, Abcam,1067675-2), E-cadherin (AF748,R&D, CYG0424111). The following secondary antibodies were used: HRP Horse anti-goat IgG (MP-7405, Vector Laboratories, lot ZJ0718), HRP horse anti-rabbit IgG (MP-7401, Vector Laboratories, lot ZH0609), AF488-donkey anti-rabbit IgG (A21206, Invitrogen, 2376850) and AF594-donkey anti-goat (A11058, Invitrogen, 2445414), AF488-donkey anti-rat IgG (A21208, Invitrogen, 2482958) and AF488-donkey anti-goat IgG (A11055, Invitrogen, 2747580). For detection of EdU, the Click-iT Plus EdU Alexa Fluor 647 and 488 Imaging Kit (Thermo Fisher, C10640 or C10637) was used.
Multiplex immunofluorescence
Multiplex immunofluorescence was performed on 5-μm FFPE human tissue sections. Sections were deparaffinized, rehydrated, and subjected to two-step antigen retrieval using Citrate buffer (pH 6.0), followed by Tris-EDTA buffer (pH 9.0). Slides were then blocked in PBS containing 3% bovine serum albumin (BSA), stained with DAPI, and imaged to capture baseline autofluorescence. Staining was performed manually in sequential cycles using a ClickWell slide holder with a sealed chamber. Each cycle consisted of primary antibody incubation, followed by secondary antibody staining when necessary. All washes were performed using TBST, and all rounds of imaging and slide storage were done in a solution of PBS with 50% glycerol. Slides were scanned after each round using the CellDive instrument (Leica), which provided automated imaging, autofluorescence subtraction, image registration to baseline DAPI, and field-of-view stitching using the CellDive image acquisition and processing software. After imaging, fluorophore inactivation was performed using 0.1 M Na2CO3 with 3% H2O2 for 15 min at room temperature. This staining-imaging-inactivation cycle was repeated for a total of 8 markers, using DAPI, FITC, Cy3, Cy5 and Cy7 channels for acquisition. Staining quality and fluorescence removal were verified after each round. The fully stitched images were imported into HALO image analysis software (Indica Labs) for analysis. Cell segmentation was performed using the ‘traditional’ nuclear segmentation option, with analysis settings optimized for each staining category. The following antibodies were used: uPAR (AF807, R&D), AF555-Ki-67 (558617, BD Biosciences), AF647-γH2A.X (ab195189, Abcam), AF488-E-cadherin (3199S, Cell Signaling Technology), AF647-p21 (8587S, Cell Signaling Technology), AF488-CD31 (42777, Cell Signaling Technology), AF555-CD45 (19744, Cell Signaling Technology), AF750 cleaved caspase-3 (97774S, Cell Signaling Technology), and AF555-donkey anti goal (A21432, Invitrogen).
SA-β-gal staining
SA-β-gal staining was performed as previously described79 at pH 5.5 for mouse tissues. Specifically, fresh frozen tissue sections were fixed with 0.5% glutaraldehyde in phosphate-buffered saline (PBS) for 15 min, washed with PBS supplemented with 1 mM MgCl2 and stained for 5–8 h in PBS containing 1 mM MgCl2, 1 mg ml−1 X-gal, 5 mM potassium ferricyanide and 5 mM potassium ferrocyanide. Tissue sections were counterstained with eosin. Three fields per section were counted with ImageJ and averaged to quantify the percentage of SA-β-gal+ area per field. For SPiDER-β-gal experiments, intestinal crypts were dissociated into single-cell suspensions and cultured with SPiDER-β-gal substrate at 37 C for 30 min at 37 °C according to manufacturer’s instructions (Dojindo, SG02-10). Subsequently, cells were stained with PE-uPAR (FAB531P, R&D systems, lot ABLH0521021). DAPI (Sigma, 32670-5MG-F) was used as viability dye. Flow cytometry was performed on a LSRFortessa instrument (BD Biosciences), and data were analyzed using FlowJo (TreeStar).
Intestinal permeability assay
Mice were fasted for 6 h before starting the test and a pre-test plasma sample was collected after this time. Subsequently, mice were administered by oral gavage 150 μl of 80 mg ml−1 FITC-Dextran (4 kDa) (Sigma-Aldrich; FD4-250 mg). Plasma sample collection was repeated 4 h post-gavage. The pre- and post-plasma samples were diluted 1:10 in PBS and a total volume of 100 μl transferred to a black 96-well plate. Pre- and post-plasma fluorescence levels were determined in a plate reader at 530 nm with excitation at 485 nm. Results were normalized to the average of the control group.
Isolation, expansion and transduction of mouse T cells
B6.SJL-Ptrca Pepcb/BoyJ(CD45.1 mice) were euthanized and spleens were collected. After tissue dissection and red blood cell lysis, primary mouse T cells were purified using the mouse Pan T cell Isolation Kit (Miltenyi Biotec, 130-095-130). Purified T cells were cultured in RPMI-1640 (Invitrogen, 11-875-085) supplemented with 10% FBS (Corning, 35-010-CV), 10 mM HEPES (Thermo Fisher Scientific, 15630080), 2 mM L-glutamine (Thermo Fisher Scientific, 25030164), MEM non-essential amino acids 1x (Thermo Fisher Scientific, 11140076), 55 µM β-mercaptoethanol (Thermo Fisher Scientific, 21985023), 1 mM sodium pyruvate (Thermo Fisher Scientific, 11360070), 100 IU ml−1 recombinant human IL-2 (Proleukin, Novartis) and mouse anti-CD3/28 Dynabeads (Gibco, 11452D) at a bead/cell ratio of 1:2. T cells were spinoculated with retroviral supernatant collected from Phoenix-ECO cells 24 h after initial T cell activation as described previously80,81 and used for functional analysis 3–4 days later.
Genetic modification of T cells
The mouse SFG γ-retroviral m.uPAR-m28z plasmid has been described previously25 and was obtained from Memorial Sloan Kettering Cancer Center. In this construct the anti-mouse uPAR single-chain variable fragment is preceded by a mouse CD8A leader peptide and followed by the Myc-tag sequence (EQKLISEEDL), mouse CD28 transmembrane and intracellular domain and mouse CD3z intracellular domain80,81. A plasmid encoding the SFGγ retroviral vector was used to transfect gpg29 fibroblasts (H29) to generate VSV-G pseudotyped retroviral supernatants, which were used to construct stable retrovirus-producing cell lines as described elsewhere80,82.
Antigen presentation experiments
Were performed as described previously45. In brief, 5 × 10³ sort-purified CD45− EpCAM+uPAR+ or uPAR− cells were cultured with 5 × 10⁴ OT-II T cells in the organoid culture medium described above (without Matrigel), with or without 15 μg ml−1 ovalbumin peptide (Anaspec, AS-27024) at 37 °C for 72 h. T cell proliferation was assessed using the CellTrace Violet proliferation kit (Thermo Fisher Scientific, C34557) per manufacturer’s instructions.
Cytokine analysis
Intestinal crypts were isolated and protein was extracted in lysis buffer (20 mM Tris HCl (pH 7.5), 0.5% Tween 20 (Sigma, P1379) and 150 mM NaCl, 1:100 protease inhibitor (Thermo Fisher Scientific, 87786). Protein concentration was determined with BCA protein assay kit (Thermo Fisher Scientific, 23228). Cytokine measurement on the protein lysates was performed by Eve Technologies.
Detection of granzyme B or IgA levels or lipocalin-2 levels
Levels of granzyme B, total IgA, anti-OVA IgA and lipocalin-2 from mouse plasma were evaluated by ELISA according to the manufacturer’s protocols (Abcam, ab238265, granzyme B; Thermo Fisher Scientific, BMS6029, granzyme B; Abcam, ab157717, total; Chondrex, 3018, anti-OVA; and R&D Systems, MLCN20, lipocalin-2).
Taxonomic microbiota analysis/metagenomics
Metagenomics sequencing analysis of fecal samples was performed by Transnetyx as described previously83. Briefly, fresh mouse fecal samples were placed in barcoded sample collection tubes containing DNA stabilization buffer and shipped to Transnetyx where DNA extraction, library preparation, sequencing, data preprocessing and preliminary analysis were performed. These analyses involved first aligning individual sequences using 31 base k-mers to the One Codex Database. Sequencing artifacts are then filtered out of the sample based on the relative frequency of unique k-mers per sample. Finally, the relative abundance of microbial species was estimated as a function of the number of reads covering that genome and the genome’s size. Bray-Curtis dissimilarity was utilized for beta diversity estimation. PCoA analysis and PERMANOVA testing were conducted on Bray-Curtis dissimilarity matrices of microbe abundance across samples using the ggvegan package in R.
Quantification, reproducibility and statistical analysis
Unless specified, statistical analysis was performed using GraphPad Prism v.6.0 or 7.0 (GraphPad software). Data distribution was assumed to be normal but this was not formally tested. Flow cytometry data was analyzed with FlowJo 10.8.1 (FlowJo). Images were analyzed with Image J-Fiji (NIH). No statistical methods were used to predetermine sample size in the mouse studies, and no method of randomization was used to assign mice to treatment groups, but groups were balanced by sex. No data were excluded from the analysis except for flow cytometry experiments if the viability of the sample was less than 30%. Experiments were repeated in replicates and/or from different subjects in independent experiments. Information on experimental repetition and replicates is provided in the figure legends. All attempts at replication were successful. Mouse conditions were observed by an operator who was blinded to the treatment groups in addition to the main investigator who was not blind to group allocation. Data collection and analysis were not performed blind to the conditions of the experiments. Figures were prepared with BioRender.com for scientific illustrations and Illustrator CC 2022 (Adobe).
Reporting summary
Further information on research design is available in the Nature Portfolio Reporting Summary linked to this article.