
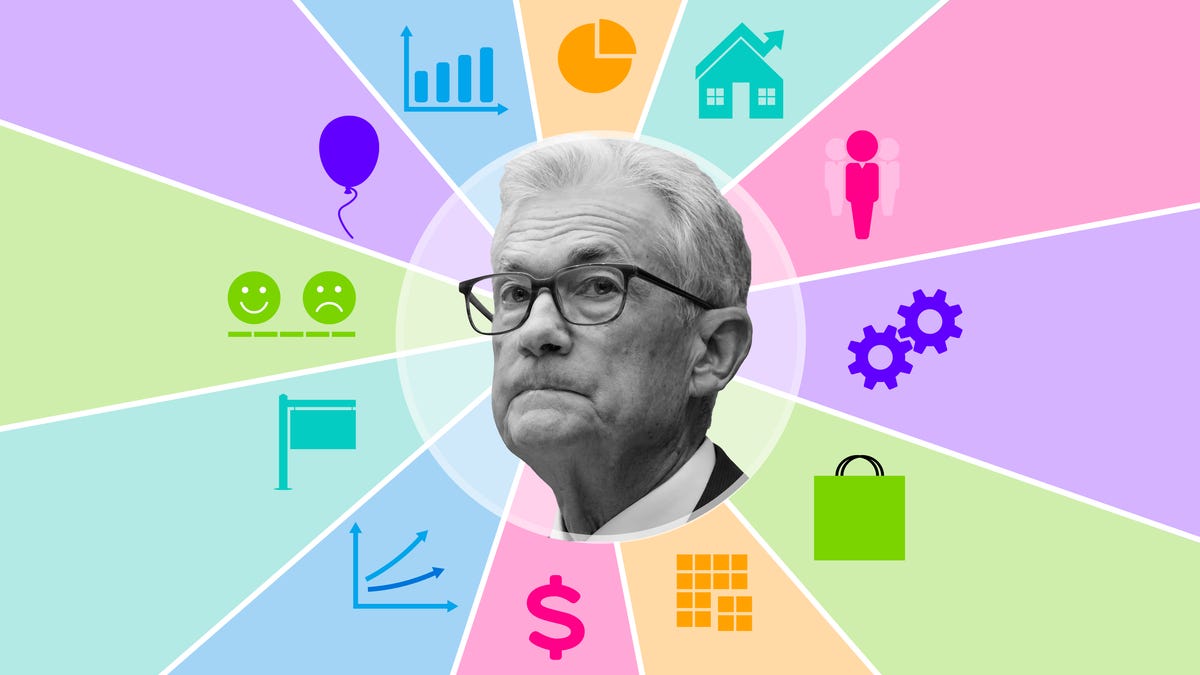
Is the job market still growing?
How happy are U.S. consumers?
Did the economy grow again in the second quarter after stumbling in the first?
We’ll get answers to those questions and more this week. But most analysts predict only minor changes from the previous months. The only exception: GDP. It tumbled in the first quarter as companies stocked up on imported goods ahead of President Donald Trump‘s new tariff policies.
As the week closes, the tariffs and their impact may still be the biggest question weighing on the U.S. economy. It’s a big enough unknown that few interest rate traders expect Fed chief Jerome Powell and the rest of the policymaking committee to announce an interest rate cut at 2 p.m. ET Wednesday.
Will the Fed cut interest rates this week?
Unable to view our graphics? Click here to view them.
While the charts below may not match the level of detail used by Fed officials, they still offer valuable insights into the broader economic landscape. Among them is the Consumer Price Index (CPI), which – though not the Fed’s preferred inflation gauge – remains a closely watched indicator. The June CPI report, released on July 15, showed inflation continuing to inch upward. This trend could further complicate President Donald Trump’s repeated calls for the Fed to keep cutting short-term interest rates.
How is the U.S. economy doing?What is the U.S. unemployment rate?
U.S. unemployment rate dipped to 4.1% in June. The monthly number, which represents the percentage of people who are unemployed and looking for work is expected turn back up to 4.2% when the July jobs report is released on Friday, Aug. 1.
What the data shows: The unemployment rate has been relatively steady for the past year, hovering around the 10-year monthly median rate of 4.1%. Economists such as Nancy Vanden Houten at Oxford Economics have speculated that corporate decision makers have been stymied by the uncertainty surrounding tariffs: “The June (Job Openings and Labor Turnover Survey) painted a familiar picture of the labor market: Hiring remains quite low, but so do layoffs.”
Hiring has also held steadily throughout the year – although well below the 10-year median rate of 226,000 jobs per month. Analysts expect Friday’s jobs report will show the economy added about 100,000 more jobs in July.
How big is the U.S. economy?
The U.S. economy produced about $30 trillion of goods on an inflation-adjusted annualized basis in the first quarter, but real GDP, the value of goods adjusted for inflation, fell 0.5% in the quarter because imported goods – which subtract from GDP – jumped more than 50%.
What the data shows: Economists predict the Bureau of Labor Statisics will say the economy grew in the second quarter when it releases its report on Wednesday. Much of that “growth” could come from reduced spending on imports.
How high is inflation?
Inflation, a sustained increase in prices throughout the economy, touched its 10-year median of 2.3% in April – for the first time since pandemic spending set off 40-year high inflation. The Fed policymakers say they prefer inflation at 2%, or “low and stable,” so we can “make sound decisions regarding saving, borrowing, and investment.”
What the data shows: Inflation has fallen significantly but remains above the 2% that the Fed targets. The annual inflation rate as measured by the consumer price index rose to 2.7% in June from 2.4% in May. The July CPI report will be released Aug. 12.
Are consumers still making purchases?
U.S. consumers account for $7 of every $10 spent in the U.S. economy. Retail sales’ median monthly increase has been about 0.4% for the past 10 years. That doesn’t sound like much until you consider a 0.6% increase in June amounted to an extra $4.6 billion of spending.
What the data shows: As the primary engine of the U.S. economy, we bought $720 billion worth of stuff on a seasonally adjusted basis in June. That was a big swing from the -0.9% decline in May. We’ll find out Aug. 15 if we continued to spend in July.
Why are gas prices going down?
Our gasoline purchases aren’t a large part of most of our budgets, but it’s hard to miss the big numbers outside every station and not have some emotional reaction to their swings. That can have a psychological impact on our spending. One report showed a recent improvement in consumer sentiment closely correlated with lower gas prices.
What the data shows: We’re in the midst of the summer driving season where gasoline prices typically peak, but a gallon of regular gas has held steady throughout the summer and several cents below last year’s prices.
So how confident are U.S. consumers now?
The University of Michigan measures U.S. consumer sentiment on a monthly basis. The index been as high as 101 ahead of the pandemic in February 2020 and as low as 50 when inflation peaked at 9.1% in June 2022.
What the data shows: Consumer sentiment has been rising haltingly since bottomed out in May. Michigan will release its final measure of July sentiment on Friday.
Current mortgage rates still elevated
While the Fed’s interest-rate decisions don’t directly affect mortgage rates, they do ripple through the economy and have made the math more difficult for homebuyers.
What the data shows: Since November, mortgage rates have moved in a relatively narrow range – between 6.6% and 7% – and well above the 10-year median, according to Freddie Mac’s weekly mortgage rate survey. Rates are down significantly from the November 2023 peak of 7.8%.
Higher mortgage rates weigh on home sales
Existing home sales are the lion’s share of homes sold each month. The NAR reports each month’s sales at a seasonally adjusted annual rate. Annual home sales peaked in 2005 at 7.08 million units. In September 2024, that number fell to 3.9 million units – lower than sales during any year following the financial crisis.
What the data shows: Not surprisingly as mortgage rates have risen, existing home sales have tumbled. At the same time, average home prices are also rising because fewer homes are on the market. Speculation has been that homeowners are unwilling to sell and give up their low-rate mortgages.
So how are investors looking at this information?
The nation’s stock markets are not the economy, but their movements reflect the combined bets investors are making on the economy. Investors have a keen eye on data points like in the charts above. Significant swings in our spending, or even our thinking, might potentially impact corporate profits in coming quarters.
What the data shows: After a dip in early April because of tariff-related uncertainty, the S&P 500 has steadily climbed, reaching several new highs since June. The upward trend could suggest that investors are increasingly confident the final tariff agreements won’t weigh on the economy as heavily as once feared.