
Ethical approval
This study was approved by the Institutional Review Board of WHO Western Pacific Regional Office (2013.10.CHN.2.ESR), the Chinese Centre for Disease Control and Prevention (201224), and Fudan University (2019–05–0756, 2020-11-0857, 2020-11-0857-S, 2022-02-0950, and 2024-07-1142). Written informed consent was obtained from all caregivers of child participants and enroled adult participants themselves.
Study design and participants
We use epidemiological and measles serological data from two longitudinal cohorts followed in 2013-2024 respectively involving mother-infant pairs (n = 1066, referred to as the mother-infant cohort) and children aged 1–9 years (n = 4188, referred to as the child cohort), as well as an all-ages population-based cross-sectional study (n = 1016) conducted in 2021. All studies were conducted in Anhua County, Hunan Province, China, and included both male and female participants. Detailed profiles of the two cohorts have been provided elsewhere26,27,28. Participants in the three population-based studies were selected to represent local populations within designated age ranges during the study period. Enrolment and eight follow-up visits of cohort participants occurred between September 2013 and August 2024. In the mother-infant cohort, birthing women and their neonates were enroled between September 20, 2013 and October 14, 2015, and child participants were then followed at 2, 4, 6, 12, 24, and 36 months. In the child cohort, participants aged 1–9 years were enrolled between September 23, 2013 and November 25, 2013, and then followed semi-annually between February 25, 2014 and November 13, 2016. Additionally, centralised follow-ups were conducted for both cohorts between July 19 and October 31, 2021 (corresponding to the period during which the cross-sectional study was done), as well as from July 25 to August 13, 2024. For the cross-sectional study, a 2-pronged approach was used for participant recruitment, and detailed study profiles has been published elsewhere29. In brief, initial household-based enrolment was conducted in July 2021, followed by supplemental school-based enrolment in October 2021 to address shortfalls in the predefined sample size for school-age children and childbearing-age women.
Questionnaires (including socio-demographic and obstetric information) and blood sample collection were completed for each participant at each survey. Specifically, all child participants provided 2 ml venous blood samples (cord blood sample for neonates). For adult participants, 2 ml venous blood samples were collected from birthing women in the mother-infant cohort, while those in the cross-sectional study provided 4 ml venous blood samples. The selection of participants in the present study is shown below. For cohort participants, given the insufficient volume of their stored serum samples during the 2nd–6th follow-up visits, a minimum number of participants necessary to understand age-specific measles seropositivity was selected from the original cohorts (n = 2629, including 555 from the mother-infant cohort and 2074 from the child cohort)19. For participants in the cross-sectional study, individuals were selected if they are within the same age range as the cohort children (aged 0–14 years, n = 273) and birthing women (aged 20–45 years, n = 217) followed in 2013–2018 (n = 490), given the age targets of the present study. Information about the history of vaccination and infection has been extracted from participants’ vaccination cards (the official and legal documents to show the completeness of routine vaccination schedules) and official line list of measles cases respectively.
Laboratory procedure
For each blood draw of each selected participant, anti-measles virus IgG antibody concentration was measured using commercial ELISA kits (SERION ELISA classic measles virus IgG, Institut Virion/Serion GmbH, Wurzburg, Germany). All samples were diluted 1:100 in assay diluents before testing. The negative control and standard sera (from the kit) were ready to use without further dilution. The resulting optical density values were converted into concentration units (mIU/ml) based on a calibration curve generated from standard serum using SERION software. We validated the consistency of ELISA results between different testing batches by use of WHO International Standard for anti-measles serum (Fig. S2) and their consistency with the gold-standard plaque reduction neutralisation test (PRNT). The procedure of the PRNT test and the consistency between the two assays have been provided elsewhere19 and are briefly summarized in the Supplementary Text.
Statistical analyses and mathematical modellingCharacterising immunity changes before and after COVID-19 pandemic period
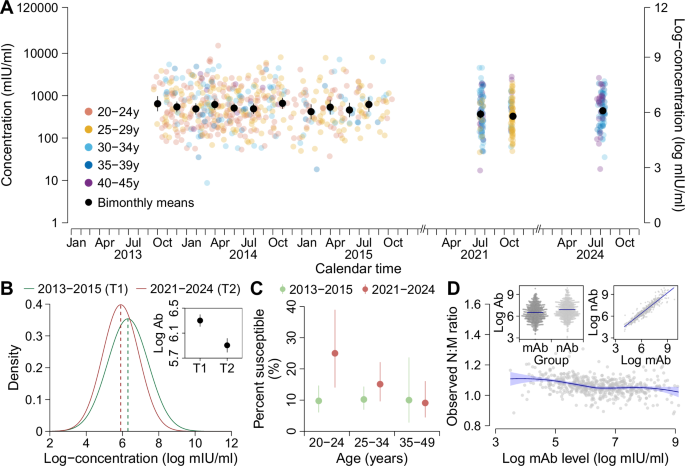
To explore long-term measles immunity profiles before and after the COVID-19 pandemic period, we used serological data from children aged 0-14 years and non-pregnant women of childbearing age (20–45 years) from the three population-based studies. We determined the point estimates of age- or time-specific mean concentrations and proportion of children being susceptible to measles virus infections, along with their 95% confidence intervals (95% CI). The 95% CI of mean concentrations was obtained with t distribution, while the Clopper-Pearson exact binomial confidence interval was calculated for the proportion of susceptible children. We used a generally accepted protective threshold of 200 mIU/ml to define individual immunity/susceptibility30,31. We also calculated the individual transplacental transfer ratio of maternal antibodies, which was defined as the geometric mean of the ratio of the neonate-to-mother log-concentration. We compared group means with a t-test and proportions with the χ² test or Fisher’s exact test. In addition, we built linear regression models to determine the association between maternal and neonatal log-concentrations. Linear mixed models were used to analyse which factors affected individual antibody levels in child and childbearing-age participants.
In addition, we analyse child population susceptibility over time based on their longitudinal vaccination records and antibody concentration predictions. For individuals who are eligible to vaccination (\(\ge\)8 months), we define their susceptibility status as follows: (1) undervaccination for those without any vaccination records and with antibody concentration lower than 10 mIU/ml over all serum samples (the estimated minimum mAb level at 8 months); (2) primary vaccine failure for those with exact vaccination dates but without post-vaccination seroconversion (i.e., the transition from seronegative to seropositive status or a fourfold antibody rise in consecutive serum samples); (3) immunity waning post-vaccination for those with exact vaccination dates and post-vaccination seroconversion but with a subsequent serum sample showing below-threshold concentration
Modelling maternally derived and vaccine-induced immunityCorrecting for potential experimental errors in antibody measurements
Before assessing how maternal immunity levels and various hypothetical SIA activities shift immunity levels in the target populations, we first characterised the impact of batch effects (random effects) on antibody concentration levels (Fig. S2A). The resulting distribution was then used as a prior for inferring batch-specific experiment errors in our Bayesian hierarchical model (Eq. 1, Table S6). Assuming that individual antibody measurements within each batch share a random effect, \({A}_{\varepsilon }\) (i.e., a constant batch-specific measurement error), individual ELISA-detectable log-concentration \({A}_{s,\varepsilon }\) can be modelled as the sum of the “true” log-concentration \({A}_{s}^{*}\) and batch effects \({A}_{\varepsilon }\) as described below:
$${A}_{s,\varepsilon }={A}_{s}^{*}+{A}_{\varepsilon }$$
(1)
Reconstruction of transplacental antibody transfer and infant vaccine responses
With the error-corrected antibody measurements, we then constructed models to understand the mechanisms of transplacental antibody transfer from birthing women and of antibody response dynamics in children from birth. The latter model includes the decay of maternally derived antibodies, as well as vaccine-induced peak antibody increases and subsequent decay. We specifically examined how individual immunity levels immediately prior to vaccination affects their vaccine responses, based on our previously established model frameworks26. We assume that maternally derived and vaccine-induced antibodies will decay exponentially over time. We allow for population-level decay rates of maternally derived (\(\gamma\)) and vaccine-induced antibodies (\(\lambda\)). After each vaccination, we anticipate an immediate increase in individual antibody levels, with the increased level expected to be linearly correlated with the pre-existing antibody level immediately prior to vaccination (referred to as the linear response mechanism below), as supported in our data (Fig. S9).
We first model the transplacental transfer of maternal antibodies and infant antibody dynamics using serological data from the mother-infant cohort only (model A). In light of the observed relationship between log-concentrations in birthing women and the corresponding transplacental transfer ratio (Fig. 1D), we use an exponential function to characterise transplacental transfer of maternal antibodies from birthing women, \({A}_{i,m}\), to their neonates, \({A}_{i,0}\), with a transplacental transfer ratio of \({\eta }_{i}\).
$${\eta }_{i}={\beta }_{m}\,exp (-{\varphi }_{m}{A}_{i,m})$$
(2)
$${A}_{i,0}={{\eta }_{i}A}_{i,m}$$
(3)
We then model the decay of infant maternally derived antibodies as Eq. (4).
$${A}_{i,t}={A}_{i,0}\,exp (-\gamma t)$$
(4)
To predict MCV1-induced peak increase in infant log-concentrations, we use the observed linear relationship between pre-existing log-concentration immediately prior to vaccination, \({A}_{i,\psi=1}\) (\(\psi\): dose number), and peak log-concentration increase, \({\alpha }_{i,\psi=1}\), shown in Eqs. (5)–(6).
$${A}_{i,\psi=1}={A}_{i,0}\,exp (-\gamma {t}_{\psi=1})$$
(5)
$${\alpha }_{i,\psi=1}={\theta }_{\psi=1}-{\kappa }_{\psi=1}{A}_{i,\psi=1}$$
(6)
The exponential decay of post-MCV1 log-concentrations, \({A}_{i,t,\psi=1}\), can be described as:
$${A}_{i,t,\psi=1}=\left({A}_{i,\psi=1}+{\alpha }_{i,\psi=1}\right)\,exp \left(-\lambda \left({t-t}_{\psi=1}\right)\right)$$
(7)
We also model individual MCV2-induced peak log-concentrations, \({A}_{i,t,\psi=2}\), and its subsequent log-concentration decay, shown in Eqs. (8)–(10).
$${A}_{i,\psi=2}=\left({A}_{i,0}\,exp (-\gamma {t}_{\psi=1})+{\alpha }_{i,\psi=1}\right)\,exp \left(-\lambda \left({t}_{\psi=2}-{t}_{\psi=1}\right)\right)$$
(8)
$${\alpha }_{i,\psi=2}={\theta }_{\psi=2}-{\kappa }_{\psi=2}{A}_{i,\psi=2}$$
(9)
$${A}_{i,t,\psi=2}=({A}_{i,\psi=2}+{\alpha }_{i,\psi=2})\,exp \left(-\lambda \left({t-t}_{\psi=2}\right)\right)$$
(10)
where \({A}_{i,\psi=2}\) and \({\alpha }_{i,\psi=2}\) denote the pre-existing antibodies immediately prior to MCV2 and MCV2-induced peak log-concentration increase respectively.
Reconstruction of individual vaccine response across different pre-existing antibody levels
We aim to obtain the impact of various SIA activities on population immunity through aggregating their effects on individual antibody levels in the target populations. This requires a complete picture of individuals’ response mechanisms to a new vaccination event, taking into account their pre-existing antibody level immediately prior to such vaccination. To address this, we extended model A to incorporate antibody measurements in both cohorts (model B). As participants in the child cohort had antibody measurements post-MCV1 only, we instead estimate their initial log-concentration at enrolment. The decay of their initial log-concentration (\({A}_{i,\tau 0}\)) at enrolment \({\tau }_{i,0}\), as well as those from children in the mother-infant cohort (\({A}_{i,0}\)), now follows:
$${A}_{i,t}={A}_{i,0}\,exp \left(-\gamma t\right)$$
(11)
$${A}_{i,t}={A}_{i,\tau 0}\,exp \left(-\lambda \left(t-{\tau }_{i,0}\right)\right)$$
(12)
Then, we focus on determining the mechanisms of individual vaccine responses across different pre-existing antibody levels immediately prior to a new vaccination event \(\psi\). Supported by our data (Fig. S9), we consider two linear vaccine response mechanisms that relate individual peak log-concentration increase post-vaccination to their pre-existing log-concentrations immediately prior to vaccination. First, for individuals with below-threshold log-concentrations immediately prior to vaccination, we assume their vaccine-induced responses align with the MCV1-induced linear response mechanism (refer to Eq. (6) for details). For the second, we consider vaccine-induced responses (\({\alpha }_{i,\psi \ge 2}\)) in individuals with above-threshold log-concentrations immediately prior to vaccination (\({A}_{i,\psi \ge 2}\)) to be consistent with the post-MCV2 induced linear response mechanism, as shown in Eq. (13).
$${\alpha }_{i,\psi \ge 2}={\theta }_{\psi \ge 2}-{\kappa }_{\psi \ge 2}{A}_{i,\psi \ge 2}$$
(13)
Next, we use Eq. (14) to show the decay of peak log-concentration following a new vaccination event:
$${A}_{i,t,\psi }=\left({A}_{i,\psi }+{\alpha }_{i,\psi }\right)\,exp \left(-\lambda \left(t-{\tau }_{i,\psi }\right)\right)$$
(14)
Alternative model form for antibody decay
For both maternally derived and vaccine-induced antibodies, we explored an alternative biphasic model (model C) that accounts for short-term and long-term components of the antibody response, each with separate exponential rates14,32. For example, for maternal antibodies, the model can be expressed as:
$${A}_{t}={A}_{\tau 0}\left(\delta \,exp \left(-{\gamma }_{1}t\right)+\left(1-\delta \right)\,exp \left(-{\gamma }_{2}t\right)\right)$$
(15)
where \(\delta\) is the proportion of the antibody response that is short lived, which was assumed to differ between maternally derived and vaccine-induced antibodies.
The above-mentioned model parameters have been summarised in Table S6. Model fitting was conducted in CmdStanR version 0.5.3. Each model was run with three chains of 3000 iterations each, with a warm-up period of 2000 iterations. Convergence was assessed by visual assessment of chain mixing and by R-hat convergence diagnostic. The WAIC and the expected log pointwise predictive density (ELPD) were used to compare model performance.
Model validation
For model A, we address model validation both within the cohort participants and from a broader population perspective. In the first analysis, we predict individual antibody dynamics among child participants in the mother-infant cohort who had exact vaccination times and were followed in 2021–2024 (n = 82). This prediction is made using the parameter estimates from model A, as well as log-concentrations observed in cohort birthing women and the times of children’s vaccination. In the second analysis, we draw 10,000 random samples from the distribution with a mean and standard deviation of log-concentrations from cohort birthing women, assuming it represents the obstetric population in the real world. We then predict the dynamics of maternally derived immunity in the first year of life using the random draws and the parameter estimates. For model B, we validate its ability to predict individual vaccine response across different pre-existing antibody levels immediately prior to vaccination. This validation is based on the 10,000 random samples drawn from the distribution with a mean and standard deviation of cord blood log-concentrations in the mother-infant cohort (as the initial log-concentrations for children in both cohorts), along with the parameter estimates and vaccination times from both cohorts. In these validation analyses, we assess model performance based on the consistency between the predicted mean log-concentration or susceptibility and those derived from measurements.
Estimating the impact of maternal antibody levels on shifting pediatric immunity profiles
Given the substantial reduction in immunity levels observed in childbearing-age women in 2021–2024 compared to those in 2013–2015, we prospectively explore how this reduction in maternal antibody levels affects pediatric immunity profiles. Using the validated framework of model A, we simulate the decay of maternally derived immunity, peak log-concentration increases following MCV1/MCV2 vaccination, and long-term susceptibility changes from birth to 10 years of age. Such analysis relies on the parameter estimates from model A, random draws (n = 10,000) from birthing women’s log-concentration distribution in different scenarios (baseline: mAb level consistent with its 2013–2015 level; lower mAb scenario: mAb level consistent with its 2021–2024 level), as well as pre-defined timings of MCV1/MCV2 at 8 and 18 months of age. In these scenarios, the log-concentration distributions are presumed to represent the obstetric population during the study period. The susceptibility changes between the two scenarios are defined as the estimated proportion of susceptible children in the lower mAb scenario minus those derived from the baseline scenario.
Additionally, considering the differences in immune status in women of childbearing age—shaped by local measles epidemics and vaccination policy/coverage—we also simulated infant susceptibility changes across different immunisation groups. In particular, we classified non-pregnant women of childbearing-age into three immunisation groups. These included: (1) individuals born in 1978–1986, a period marked by high measles transmission and low coverage of a one-dose MCV schedule; (2) those born in 1987–1997, who experienced high measles transmission and low coverage of the two-dose MCV schedule administered at 8 months and 7 years; and (3) individuals born in 1998–2003, a period with continued high measles epidemic levels but relatively high coverage of the two-dose MCV schedule. For each group, we then simulated the transplacental transfer of their pre-existing immunity to newborns, followed by subsequent antibody decay, using exponential functions as described in Eqs. (2)–(4).
Assessing the impact of various SIA activities on improving population immunity
We then use the two validated models to determine the impact of various hypothetical SIA activities in July 2025 on population immunity in the target populations, including both children and non-pregnant women of childbearing age. Across different SIA scenarios, the population immunity level is determined by the proportion of individuals with above-threshold log-concentration estimates. Individual log-concentration estimates are obtained using their 2021 antibody measurements and the model parameter estimates. For children aged 0–2 years lacking antibody measurements in 2025, we instead estimate their log-concentration distributions through a simulation study. In such a simulation study, we first determined the number of participants to be included (n = 163), which was calculated using the age structure in our study location and the age-specific number of child participants with available antibody measurements from 2021. We next assigned random draws as their initial log-concentrations at birth, similar to the validation analyses. We consider the following SIA scenarios: (1) the absence of SIA (baseline); (2) selective SIA, targeting children who missed routine doses; and (3) non-selective SIA, targeting all children in the selected age groups regardless of their vaccination history. We consider both selective and non-selective SIAs targeting children with different age groups, while all non-pregnant women of childbearing age, regardless of their immune status, were assumed to receive non-selective SIA only. In the simulation study of SIA-induced antibody increases, we assumed a validated linear relationship with pre-existing antibody levels (Eq. (13)), regardless of the target populations. For childbearing-age women with different immune status, the transplacental transfer of their post-SIA immunity to newborns was modelled using exponential functions, with the relevant parameters derived from Eqs. (2)–(3).
All analyses were performed in R, version 4.2.1.
Reporting summary
Further information on research design is available in the Nature Portfolio Reporting Summary linked to this article.