
Annual Highlights:
NOAA ranks 2025 as the third-warmest year in its global temperature record, which dates back to 1850.
Upper ocean heat content was record high in 2025.
Annual sea ice extent for both the Arctic and Antarctic regions ranked among the three lowest years on record.
The Northern Hemisphere snow cover extent was the third lowest on record.
There were 101 named tropical storms across the globe in 2025, which was above average.
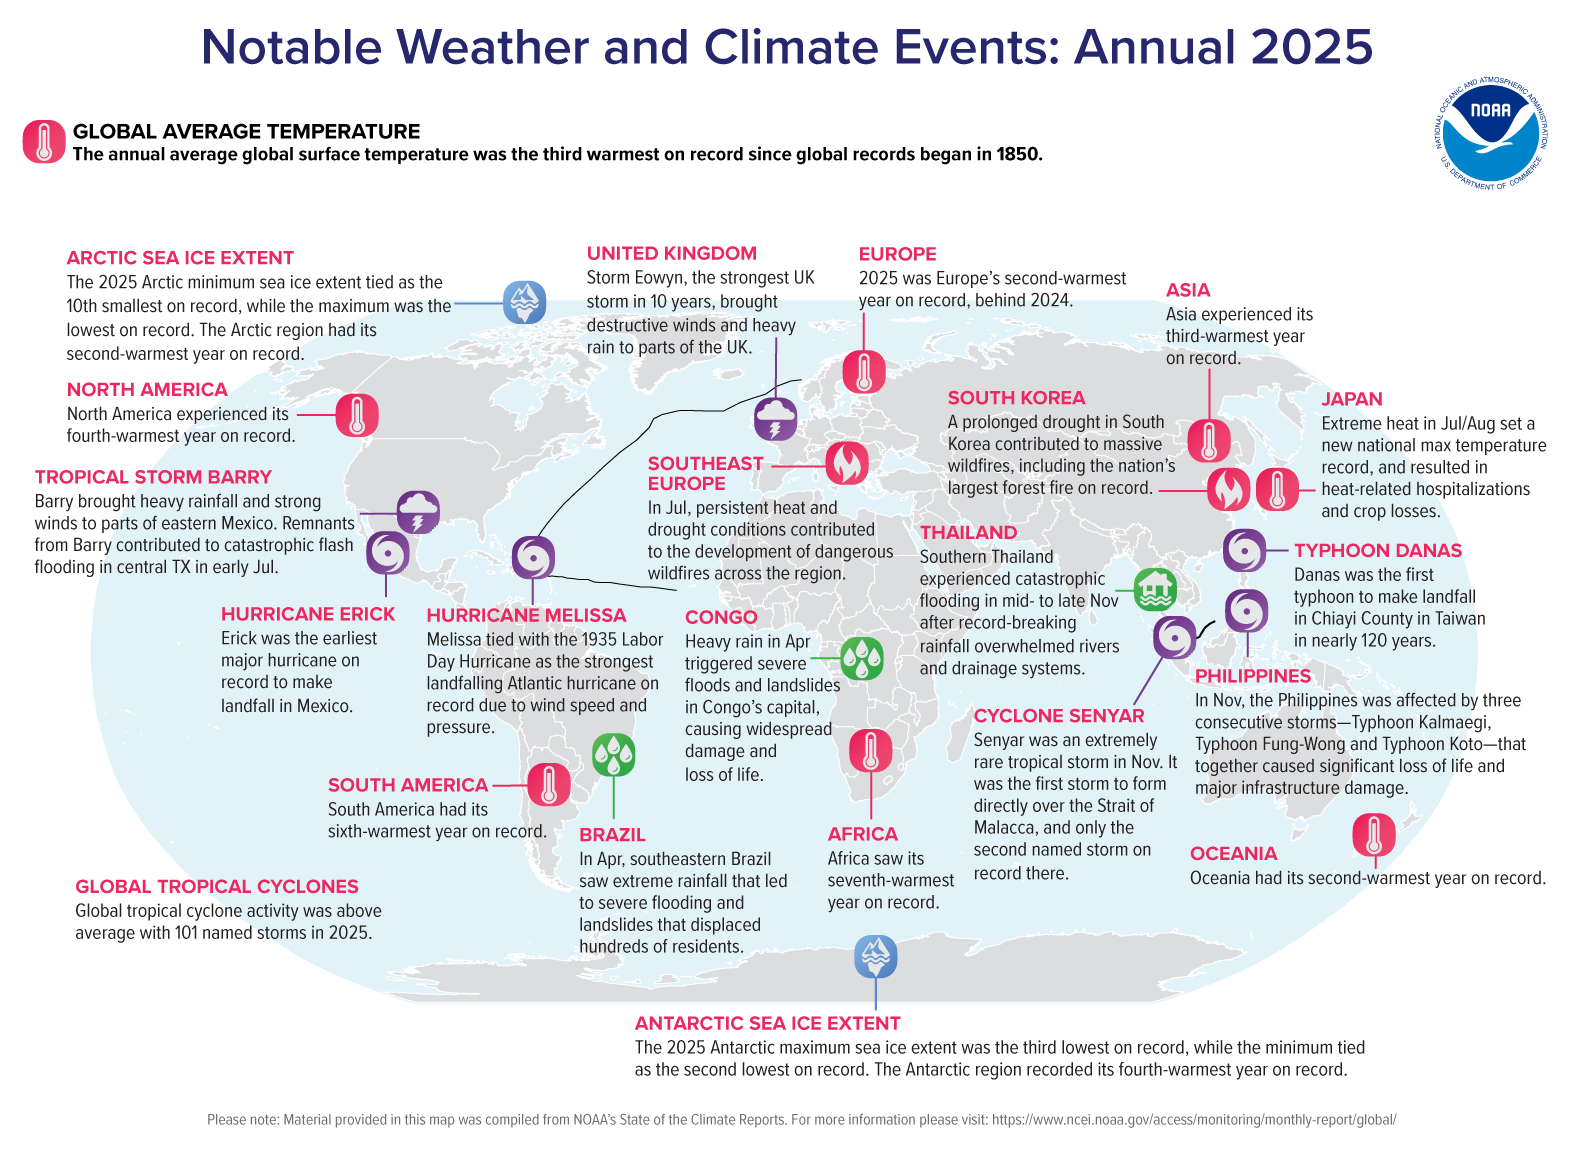
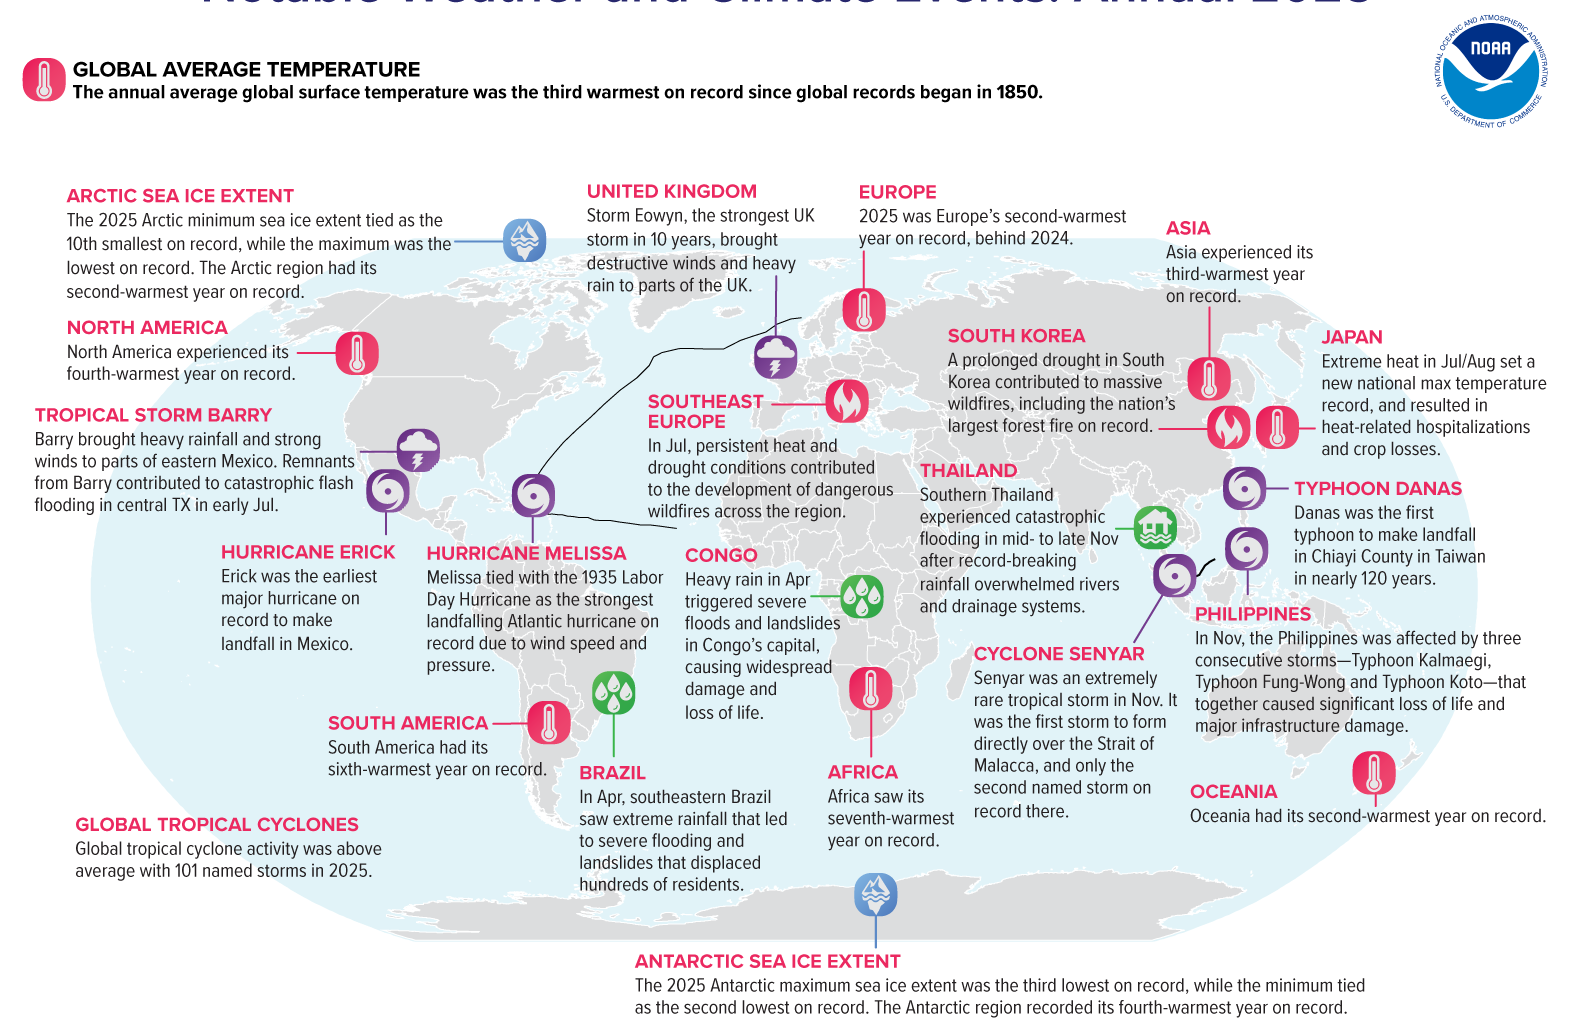
Map of global notable weather and climate events in 2025.
Surface Temperature
2025 ranked as the third-warmest year since global records began in 1850. The annual global surface temperature was 2.11°F (1.17°C) above the 20th-century average, falling behind the record-setting year of 2024 (by 0.22°F/0.12°C) and the second-warmest year, 2023 (by 0.04°F/0.02°C). The 10 warmest years in the historical record have all occurred since 2015. Additionally, 2025 exceeded the pre-industrial (1850–1900) average by 2.41°F (1.34°C).
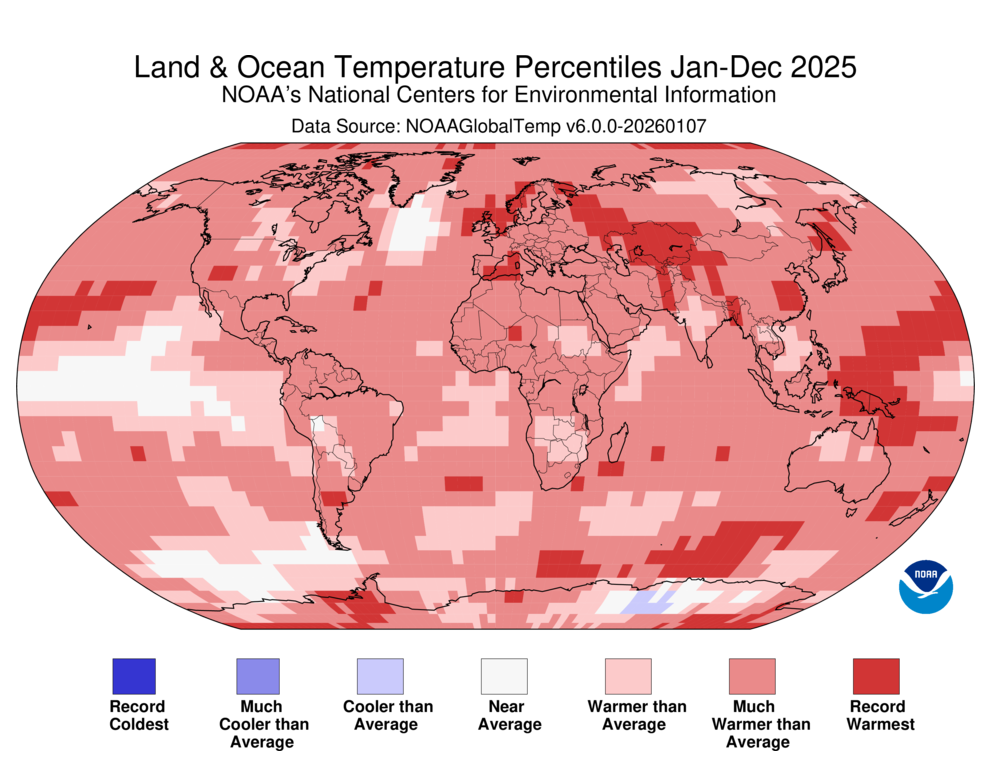
Land and Ocean Temperature Percentiles for January–December 2025 (°C). Red indicates warmer than average and blue indicates colder than average.
The year was characterized by much-warmer-than-average temperatures across the majority of the Earth’s surface. The largest warm anomalies were in the Arctic, Europe, western and southern Asia and parts of Antarctica. Every continent, as well as the Arctic region, ranked within its top 10 warmest years. Notably, Europe, Oceania and the Arctic recorded their second-warmest year on record.
Globally, land surfaces experienced their second-warmest year, while ocean surfaces ranked third. High ocean temperature anomalies were most pronounced in the North Pacific. In contrast, cooler-than-average conditions were observed in the tropical central and eastern Pacific Ocean and eastern Antarctica. Despite some pockets of cooler-than-normal temperatures, no land or ocean areas set a record for cold annual temperatures.
Ocean Heat Content
Upper ocean heat content (OHC) was record high in 2025. Ocean heat content is a key climate indicator because the oceans store 90% of the excess heat in the Earth system. The 0–700 m global ocean heat content, which has been tracked globally since 1955, has experienced a steady upward trend since about 1970. 2025 is the fifth consecutive year for which OHC has experienced its highest value.
Snow Cover
Northern Hemisphere snow cover extent was below average, averaging 9.16 million square miles in 2025. This was the third-lowest annual extent on record, trailing behind 1990 and 1988. Monthly extent ranged from 17.56 million square miles in February to just 1.12 million square miles in July. Northern Hemisphere snow cover extent records begin in 1967.
Sea Ice Extent
Arctic sea ice extent averaged 3.93 million square miles in 2025, the second lowest on record. Only 2020 had a smaller extent. The annual maximum extent occurred on March 22 at 5.53 million square miles—the lowest annual maximum extent in the 47-year record. Meanwhile, the minimum extent was 1.78 million square miles, tying with 2008 and 2010 as the 10th lowest on record. Sea ice extent records began in 1979.
Antarctic sea ice extent averaged 4.08 million square miles in 2025—the third lowest on record. The maximum extent occurred on September 17 at 6.88 million square miles, which is also the third lowest on record. The minimum extent on March 1 was 764,000 square miles, tying with 2022 and 2024 for the second-lowest extent on record.
Tropical Cyclones
A total of 101 named storms occurred across the globe in 2025, which was above the 1991–2020 average of 88. Of those, 52 reached tropical cyclone strength (winds ≥74 mph), and 24 reached major tropical cyclone strength (winds ≥111 mph). These also included five storms that reached Category 5 (winds ≥157 mph) on the Saffir-Simpson hurricane wind scale. The global accumulated cyclone energy was about 90% of the 1991–2020 average.
Global tropical cyclone activity in 2025 varied by region, with a near-average number of named storms in the North Atlantic, North Indian and Southwest Pacific and an above-average number of named storms across the rest of the basins. Some notable events include:
The North Atlantic was notable for the high number of Category 5 hurricanes. Three hurricanes—Erin, Humberto and Melissa—reached Category 5 strength during 2025. This marked the second-highest number of Category 5 storms on record in a single year, trailing behind only 2005, which produced four.
Hurricane Melissa in the Atlantic tied with the 1935 Labor Day Hurricane as the strongest landfalling Atlantic hurricane on record, and was globally the strongest 2025 tropical storm.
In the East Pacific, Hurricane Erick was the basin’s most destructive storm, becoming the earliest landfalling major hurricane in Mexico within a calendar year.
In the West Pacific, Typhoon Ragasa was the basin’s only Category 5 equivalent typhoon.
December 2025
Global surface temperature in December 2025 was 1.89°F (1.05°C) above the 20th-century average—the fifth-warmest December on record. Widespread warmth was observed during December, particularly across much of the Arctic and the Northern Hemisphere land surfaces, as well as across parts of southern South America, northern Africa and western Australia. There were several locations that had cooler-than-average temperatures, including Alaska, western and southeastern Canada, the northeastern U.S. and central Russia.
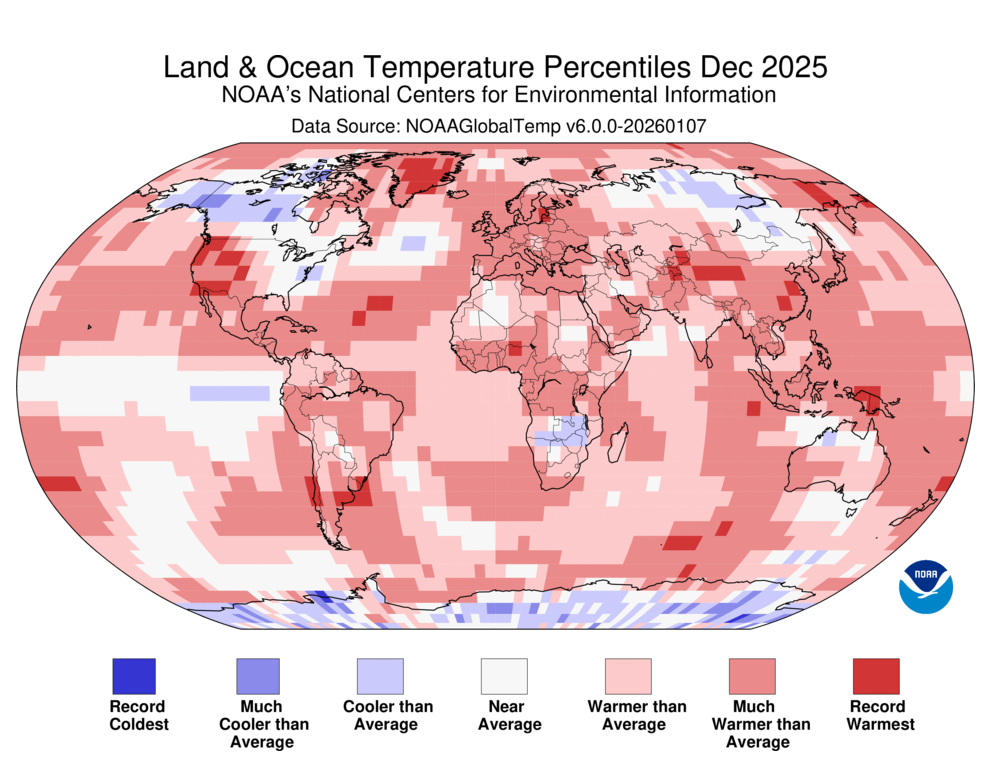
Land and Ocean Temperature Percentiles December 2025 (°C). Red indicates warmer than average and blue indicates colder than average.
Northern Hemisphere snow cover extent in December 2025 ranked as the fifth-lowest December extent in the 60-year record. North America and Greenland’s combined extent was 120,000 square miles below average whereas Eurasian snow cover extent was 800,000 square miles below average.
Global average sea ice extent in December 2025 ranked as the second-lowest December extent in the 47-year record. Arctic sea ice extent was 4.33 million square miles—the lowest extent for December on record. Antarctic sea ice extent was 3.56 million square miles, tying with December 1982 as the fifth-lowest extent for December on record.
Globally, tropical cyclone activity was near-normal with six named tropical storms across the globe in December.
This monthly summary, developed by scientists at NOAA’s National Centers for Environmental Information, is part of the suite of climate services NOAA provides to government, business, academia and the public to support informed decision-making. See our full report for a more complete summary of 2025.