
![]()
Listen to this article
Estimated 4 minutes
The audio version of this article is generated by AI-based technology. Mispronunciations can occur. We are working with our partners to continually review and improve the results.
A Waterloo region-based coalition is looking ahead to 2050 when the region is expected to hit one million people, and whether there will be proper access to services for everyone.
“We know eventually we will hit a million people. We want to make sure that those newcomers are supported,” said Sam Nabi, project co-ordinator for One Million Neighbours Waterloo Region.
“We want to make sure that people are coming into neighbourhoods that have services and have community to welcome them,” said Nabi.
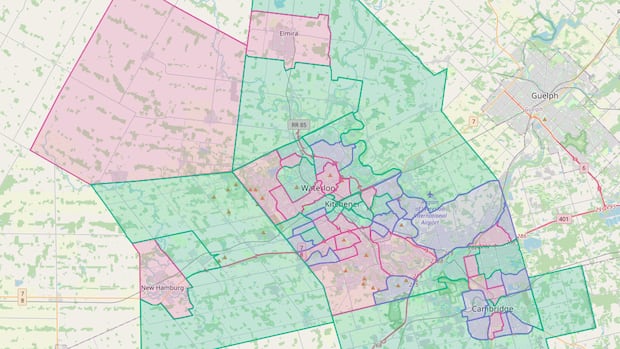
The group, comprised of 65 different non-profits and community groups, recently released an interactive map that breaks down the level of access to services between neighbourhoods in the region by assigning a ranking of most, average or least access.
Neighbourhood rankings are based on six factors:
Green space.Schools.Libraries.Health care.Transit.Community spaces.
“These are all really hubs of connection and programming, and they offer multiple benefits to a neighbourhood. So those were the main things that we wanted to start tracking,” said Nabi.
WATCH | Interactive map highlights service inequities in Waterloo region neighbourhoods:
Interactive map highlights service inequities in Waterloo region neighbourhoods
One Million Neighbours is an interactive map project that highlights inequities in access to services between different neighbourhoods across Waterloo region. The project aims to pinpoint areas where improvements to services such as health care and transit can be made. Sam Nabi, project co-ordinator for One Million Neighbours, spoke to CBC K-W’s Carmen Groleau about how the idea for an interactive map started.
The goal is to pinpoint gaps in services and highlight opportunities of growth that ensures people living in Waterloo region have access to the resources they need to thrive.
Using data from the census for information such as population size and neighbourhood boundaries, and data from OpenStreetMap, to count things like transit bus stops and community spaces, the map offers a breakdown of neighbourhood assets.
Initial findings showed some surprising differences not only between different cities but within cities as well, said Nabi.
“While generally, Kitchener and Waterloo are better served than Cambridge, there are pockets in all three cities ranked ‘least access’ for different reasons,” said a release from the group.
For example, some neighbourhoods that many would consider to be major transit destinations, such as the university district or uptown Waterloo, only received an average ranking because the massive population growth in those neighbourhoods warrants even more transit service than they currently have.
Focusing on growth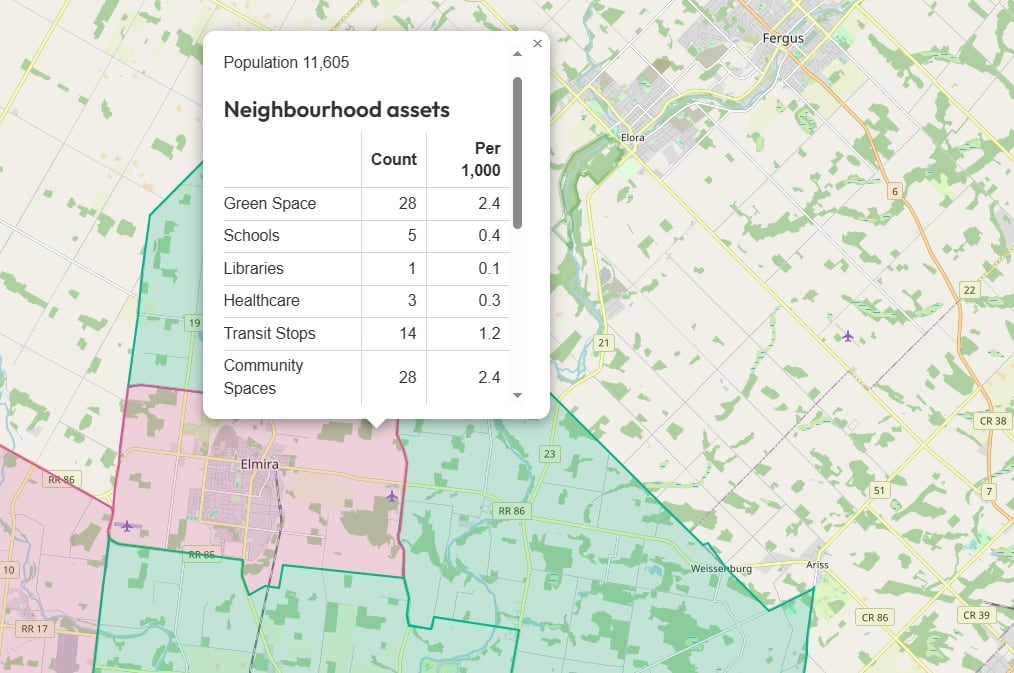 When you hover over the map you can see how each neighbourhood received their ranking based on the services available. (connectedkw.ca)
Nabi said that while his group recognizes that governments already have master plans and targets, the hope is that this map “can provide a bit more of an on-the-ground reality of what exists, not what is planned … it’s that day-to-day experience that we’re really trying to get a sense of.”
CBC News reached to the Region of Waterloo to ask whether or not a tool like this would be helpful for future planning. In a statement the region said that it “welcomes community engagement in identifying service needs and gaps as we grow to one million.”
Adding that “regional staff are meeting with One Million Neighbours to better understand their new tool and identify opportunities for collaboration.”
One Million Neighbours WR also hopes businesses, community groups and neighbourhood associations take advantage of the map in order to understand how to better serve people in their community, especially for essential services like health care, child care and groceries.
For now the group will continue to consult the data and update the map as the region continues to grow.
“I think it can just help us give a good high-level picture of where the needs are and, more importantly, where they’re distributed,” said Nabi.