

Express Entry competition continues its cooling trend for the second month in a row, as even more top-scoring profiles leave the candidate pool.
Competition within the Express Entry pool appears to be easing at the top end, even as the overall pool size has grown.
Between January 4 and February 2, a total of 6,238 profiles with CRS scores of 501+ left the pool—driven mainly by a sharp drop in the 501–600 range.
See how competitive your Express Entry profile is
With fewer top-scoring candidates sitting above them in the rankings, lower-scoring candidates may see improved odds of receiving an invitation to apply, depending on the size and type of upcoming invitation rounds.
What is the current composition of the Express Entry pool?
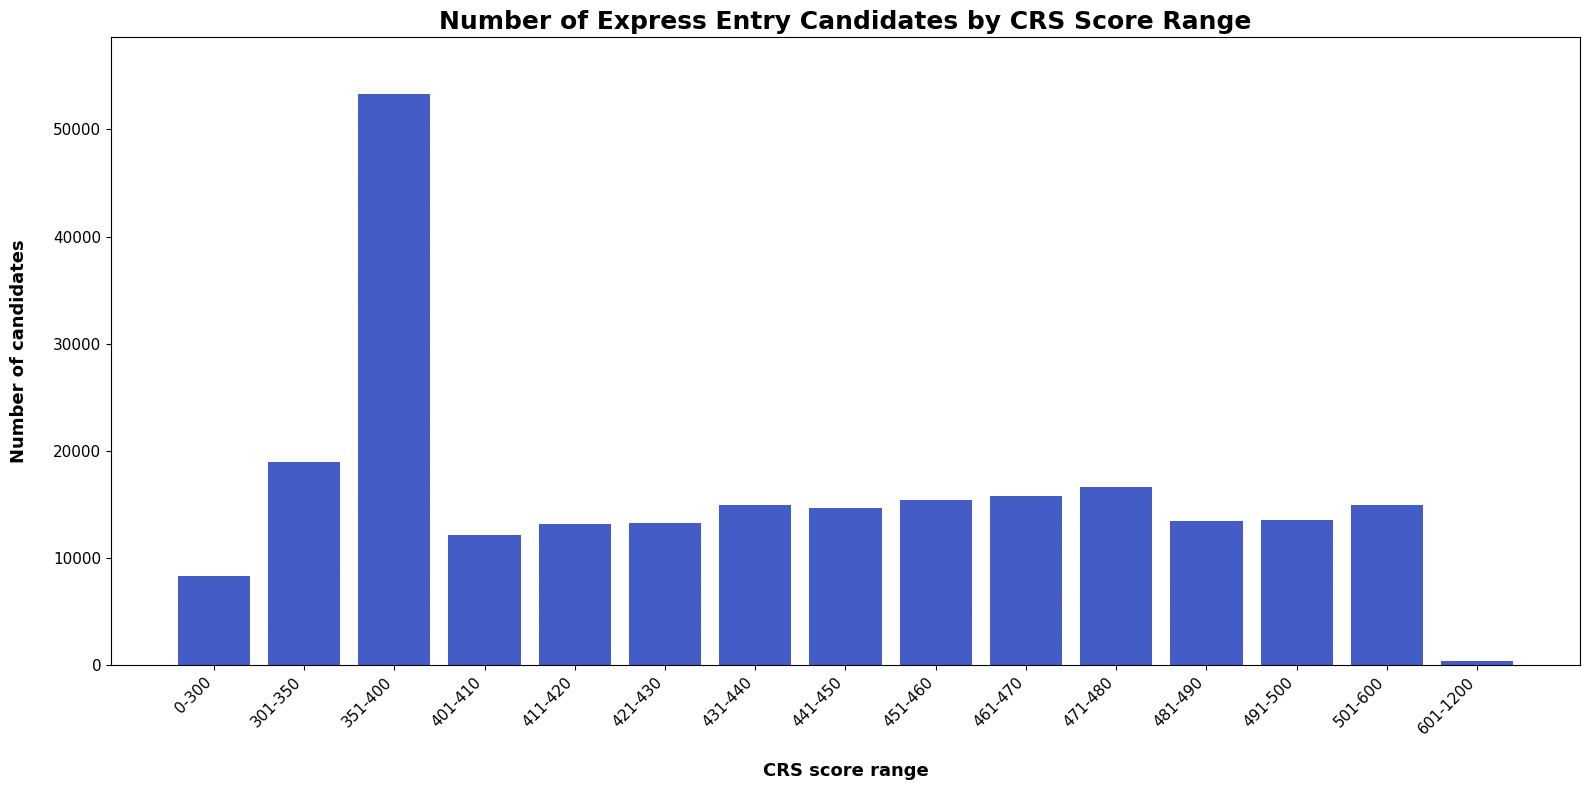
The current distribution of Express Entry profiles in the candidate pool is presented below, and compared with the distribution of profiles from January 4 as a reference point:
CRS score rangeDistribution (Jan 4)Distribution (Feb 2)Difference in number of profiles (Feb 2 vs. Jan 4)
0–3008,1258,288+163
301–35018,74518,949+204
351–40052,46953,276+807
401–41011,43812,175+737
411–42012,44213,197+755
421–43012,81613,267+451
431–44014,28514,923+638
441–45014,13914,700+561
451–46014,83515,400+565
461–47014,88115,791+910
471–48015,43516,617+1,182
481–49012,49913,417+918
491–50012,87313,586+713
501–60021,01314,911-6,102
601–1200559423-136
Total236,554238,9202,366
Notably, both of the highest CRS score ranges saw reductions:
501–600 fell by 6,102 profiles (from 21,013 to 14,911), a decline of about 29%.
601–1200 fell by 136 profiles (from 559 to 423), a decline of about 24%.
Despite these declines at the top, the overall pool grew by 2,366 profiles (+1.0%). In other words, growth across CRS bands below 500 more than offset the drop among top-scoring candidates.
Noting that Express Entry invitations are issued to the highest-ranked candidates first (including within category-based selection), a shrinking share of 500+ profiles generally signals a less top-heavy pool—potentially improving the outlook for candidates sitting below that threshold.
How does your Express Entry profile compare within the updated candidate pool?
The table below shows both the share of candidates in each score band and the percentile ranking for each score band (shown as a range) relative to the entire pool, as of February 2.
These percentile ranges represent the portion of the pool with scores at or below a given score range. For instance, if a score band falls within the 95–99th percentile, that means candidates in that range are among the top 1–5% of all candidates in the pool. Percentile ranges are calculated using the lower and upper limits of each CRS score range.
CRS score range Number of candidates Percentile (range) Percentage
0–300 8,288 0.00%–3.47% 3.47%
301–350 18,949 3.47%–11.40% 7.93%
351–400 53,276 11.40%–33.70% 22.30%
401–410 12,175 33.70%–38.79% 5.10%
411–420 13,197 38.79%–44.32% 5.52%
421–430 13,267 44.32%–49.87% 5.55%
431–440 14,923 49.87%–56.12% 6.25%
441–450 14,700 56.12%–62.27% 6.15%
451–460 15,400 62.27%–68.72% 6.45%
461–470 15,791 68.72%–75.33% 6.61%
471–480 16,617 75.33%–82.28% 6.95%
481–490 13,417 82.28%–87.90% 5.62%
491–500 13,586 87.90%–93.58% 5.69%
501–600 14,911 93.58%–99.82% 6.24%
601–1200 423 99.82%–100.00% 0.18%
Total 238,920