
With the eighth edition of the WBSC U-12 Baseball World Cup complete, we can look back at another thrilling tournament, which saw amazing players put in incredible performances that will be hard to forget, especially when these young stars potentially become heroes of international baseball in the future. Here’s a look at some of the key players and teams when we break down the tournament stats.
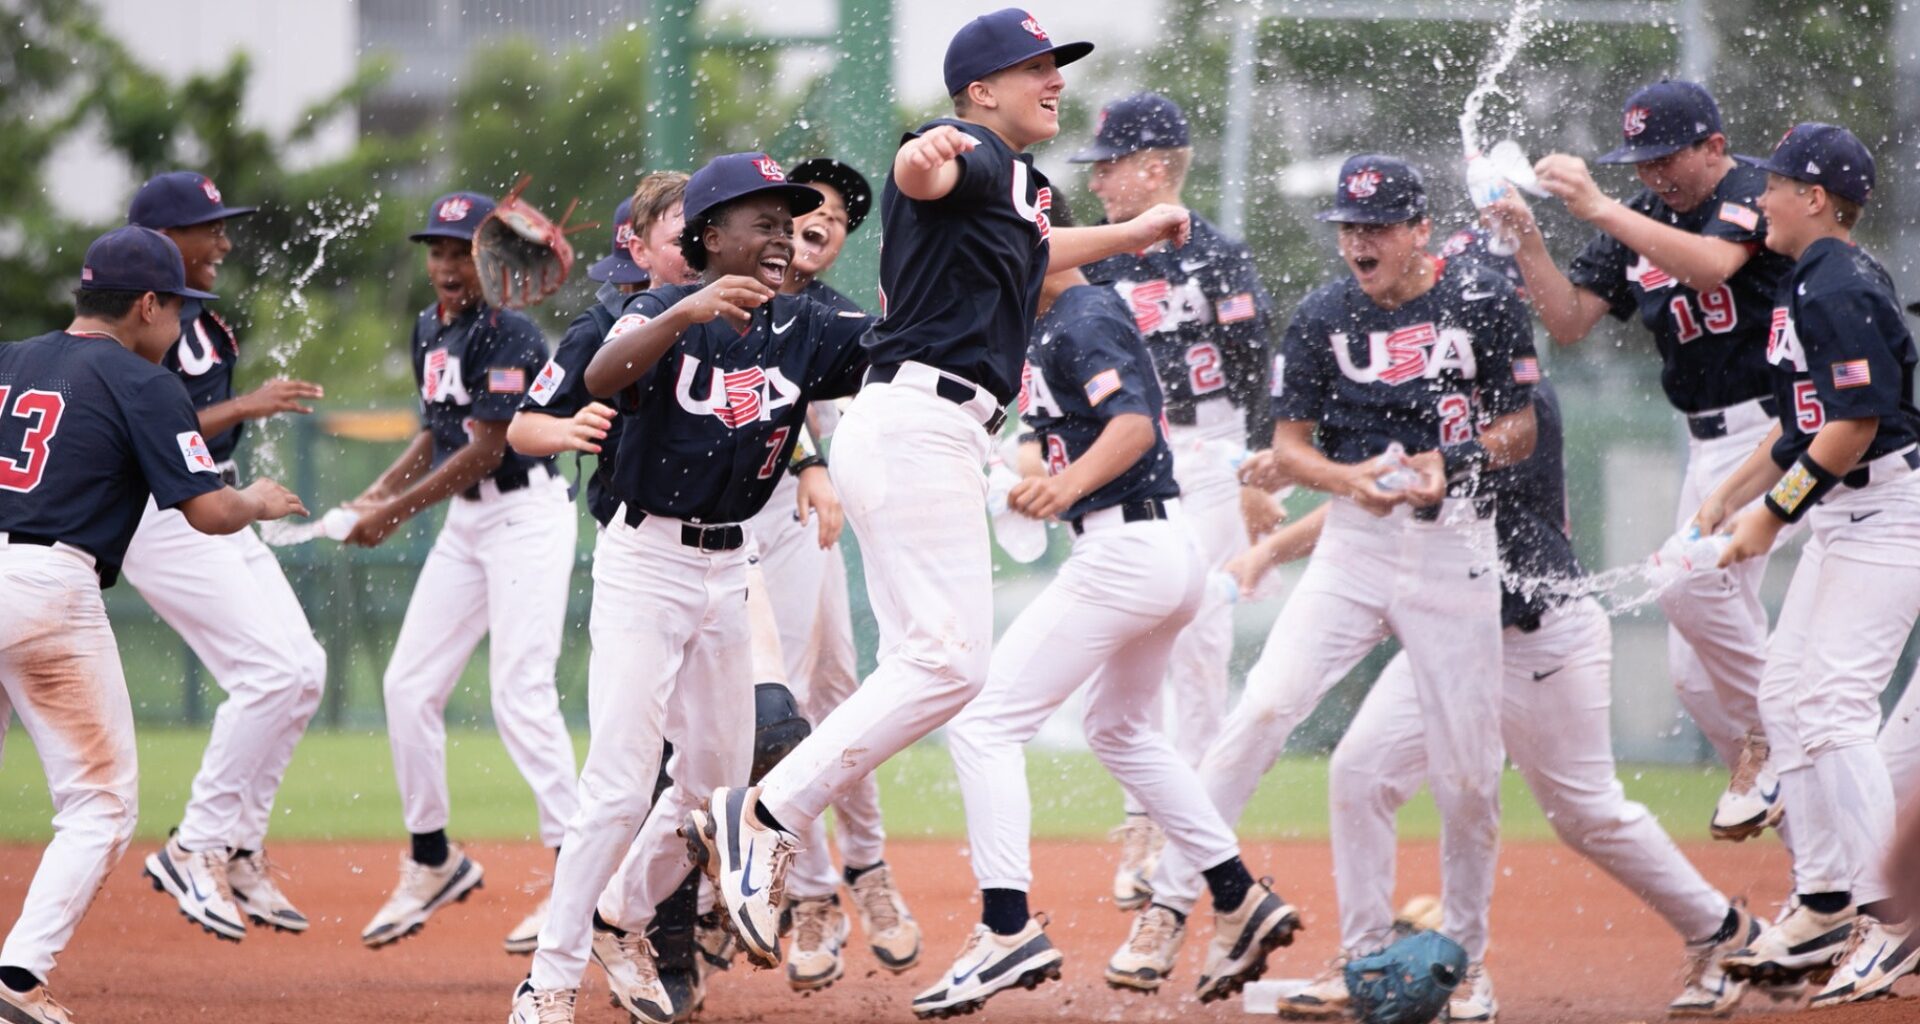
While USA claimed the honours at the WBSC U-12 Baseball World Cup 2025 presented by RAXUS in Tainan (TPE) for their sixth title overall, they also led the way with the statistics, proving how hard it is for teams to carry their Opening Round form through to the Super Round,
In five games of the Opening Round, USA posted a .380 batting average, a 1.93 earned run average (ERA) and committed seven errors. They had a .360 batting average in the Super Round, allowed an average of 1.33 earned runs and committed two errors. We could say they have been consistent, but this wouldn’t be accurate. USA, competing in the Super Round, were actually better than the team competing in the Opening Round.
It doesn’t always happen that way, especially with the Super Round involving the top six teams, making it difficult to repeat Opening Round performances. For example, Japan was the best-hitting team in the Opening Round with a .407 average however they dropped to .230 in the Super Round. The difference indicates that Japanese hitters reached on a hit in 40.7 % of the at-bats during the Opening Round and in 23% during the Super Round.
When it comes to pitching, the difference is still evident. Japan allowed a 1.92 ERA in the first round, and the figure grew to 3.00 in the Super Round. It means that Japan allowed fewer than two earned runs per game in the Opening Round and grew to three in the Super Round.
Korea were in a similar position to Japan with their team’s batting average decreasing from .304 to .222 from the Opening Round to the Super Round, while their ERA rose from 1.56 to 3.60.
It was the same theme with Chinese Taipei as far as hitting. The hosts batted better (.379 average versus .274) in the Opening Round. However, their pitchers did better and the ERA decreased from 3.11, by far the worst among the Big Four during the Opening Round, to 2.40. Which is still one more run per game, compared to USA, whose manager Bryan Madsen’s honest comment was: “We came together at the right time.”
The comment applies to most of USA’s World Champion teams. It was the case of USA in the WBSC U-12 Baseball World Cups 2022 and 2023. Those USA teams dominated with power. In 2022, they hit an impressive 27 home runs, and in 2023, they went deep 18 times. The USA team this year had seven home runs.
“We talked a little bit about the rule changes, there’s no DH, the bats changed,” commented Madsen. “Power is not as big. We had a few home runs, but we built the team differently. More athletic, more teamwork, more pitching. It worked out.”
Another figure indicates that “the bats changed”. The total number of home runs at the WBSC U-12 Baseball World Cup 2022 was 66 (in 41 games). The 12 teams combined for 72 in 50 games the following year. In 2025, the total number of home runs barely exceeded 30, and the team with the most power proved to be the Dominican Republic with nine.
The bats with a Bat Performance Factor (BPF) of 1.15 are not allowed in the WBSC U-12 Baseball World Cup since the 2025 edition. The BPF measures how much faster a ball rebounds off a bat compared to a wall. It essentially indicates the bat’s trampoline effect. A BPF of 1.15 means the ball rebounds 15% faster than off a wall. The bats allowed in the WBSC U-12 Baseball World Cup 2025 have a trampoline effect compared to wooden bats.
A new era opened in the WBSC U-12 Baseball World Cup.
