

Australian investors seeking to navigate earnings season should focus on a simple but powerful habit – watch the stocks that beat expectations and avoid those that miss. This isn’t a bold statement, no. But it is backed by data spanning 16 reporting seasons, and something I like to highlight every reporting season.
Companies that exceed earnings forecasts have delivered average gains of 5.2% on results day alone, with momentum typically extending well beyond the initial announcement, according to Bell Potter’s Richard Coppleson. These “winners” have continued their outperformance, gaining an additional 6.7% over the following four months.
The data, covering reporting seasons from 2008 to 2024, reveals a stark contrast between companies that beat versus miss expectations, highlighting how earnings results can fundamentally shift a stock’s trajectory.
The power of positive surprises
“Buy the stocks that are up on day one or more importantly, resist the urge to sell after a significant upside move, as shorts will likely cover in the weeks ahead,” says Coppleson.
This strategy capitalises on a well-documented market phenomenon where positive earnings surprises create sustained momentum. The initial rally often attracts additional buying interest as short sellers scramble to cover positions, momentum investors pile in, and analysts upgrade their ratings/target prices.
The persistence of outperformance suggests that earnings beats often signal underlying business strength that takes time to be fully recognised by the market. Companies that exceed expectations tend to continue to deliver positive surprises in subsequent periods, creating a virtuous cycle of rising estimates and share price appreciation.
Missing expectations
On the flip side, companies that disappoint investors face a brutal reckoning. Stocks that miss earnings expectations dip an average 6.3% on results day, and the pain typically doesn’t end there.
Rather than bouncing, these underperformers continue to lag, falling an additional 8.4% over the subsequent four months. This extended decline challenges the common investor hope that it’ll bounce back from oversold conditions or its newfound ‘cheap’ valuation.
Why the pain persists
The extended decline following earnings misses isn’t just about investor disappointment – it reflects a cascade of analyst downgrades that can take months to fully unfold.
When companies miss expectations, analysts are forced to revise their financial models downward, leading to reduced revenue forecasts, lower earnings estimates, and potentially lower dividend projections. These revised assumptions typically translate into lower share price targets, and sometimes rating downgrades.
This reset creates further selling pressure as institutional investors adjust their holdings based on the new, lower price targets and reduced growth expectations.
The narrative shift
Reporting season fundamentally alters the narrative for individual stocks. Outside of earnings announcements, share prices are largely influenced by broader market trends, macroeconomic conditions, and general supply-demand dynamics.
But a financial result injects fresh, company-specific information that can dramatically alter a stock’s trajectory. This new data forces a reassessment of analyst estimates, investor perceptions, and the company’s competitive positioning.
The result is often a sharp re-rating that can unfold over days or weeks as market participants – from day traders to long-term fund managers – digest the implications of the results and adjust their positions accordingly.
Recent examples
Metcash (ASX: MTS) reports out-of-cycle with half-year results in December and full-year in June, and its latest earnings have driven a dramatic turnaround in share price performance.
The stock was trading around three-and-a-half-year lows, weighed down by successive earnings downgrades and challenging macroeconomic conditions. However, a powerful 23% rally over four weeks was driven by two key catalysts:
10 June: Metcash provided FY25 underlying profit guidance of $273-277 million, beating $272 million consensus, and announced plans to merge its Independent Hardware Group and Total Tools operations into a single Hardware division. The stock jumped 3.5% that day and continued rallying another 5.5% over the following eight sessions.
23 June: The company delivered FY25 results at the upper end of guidance, including underlying NPAT of $275.5 million. The Board declared a final dividend of 9.5 cents per share, beating UBS estimates of 8.9 cents by 6.7%. Management also provided an encouraging FY26 trading update, with group sales accelerating to 4.7% growth over the first seven weeks.
This sequence highlights a classic re-rating story after prolonged sideways movement, underpinned by better-than-expected results, a higher dividend, and positive early momentum into FY26. The stock’s 200-day moving average has turned upward for the first time since early 2022, recently flashing a golden cross as the 50-day crossed above the 200-day.
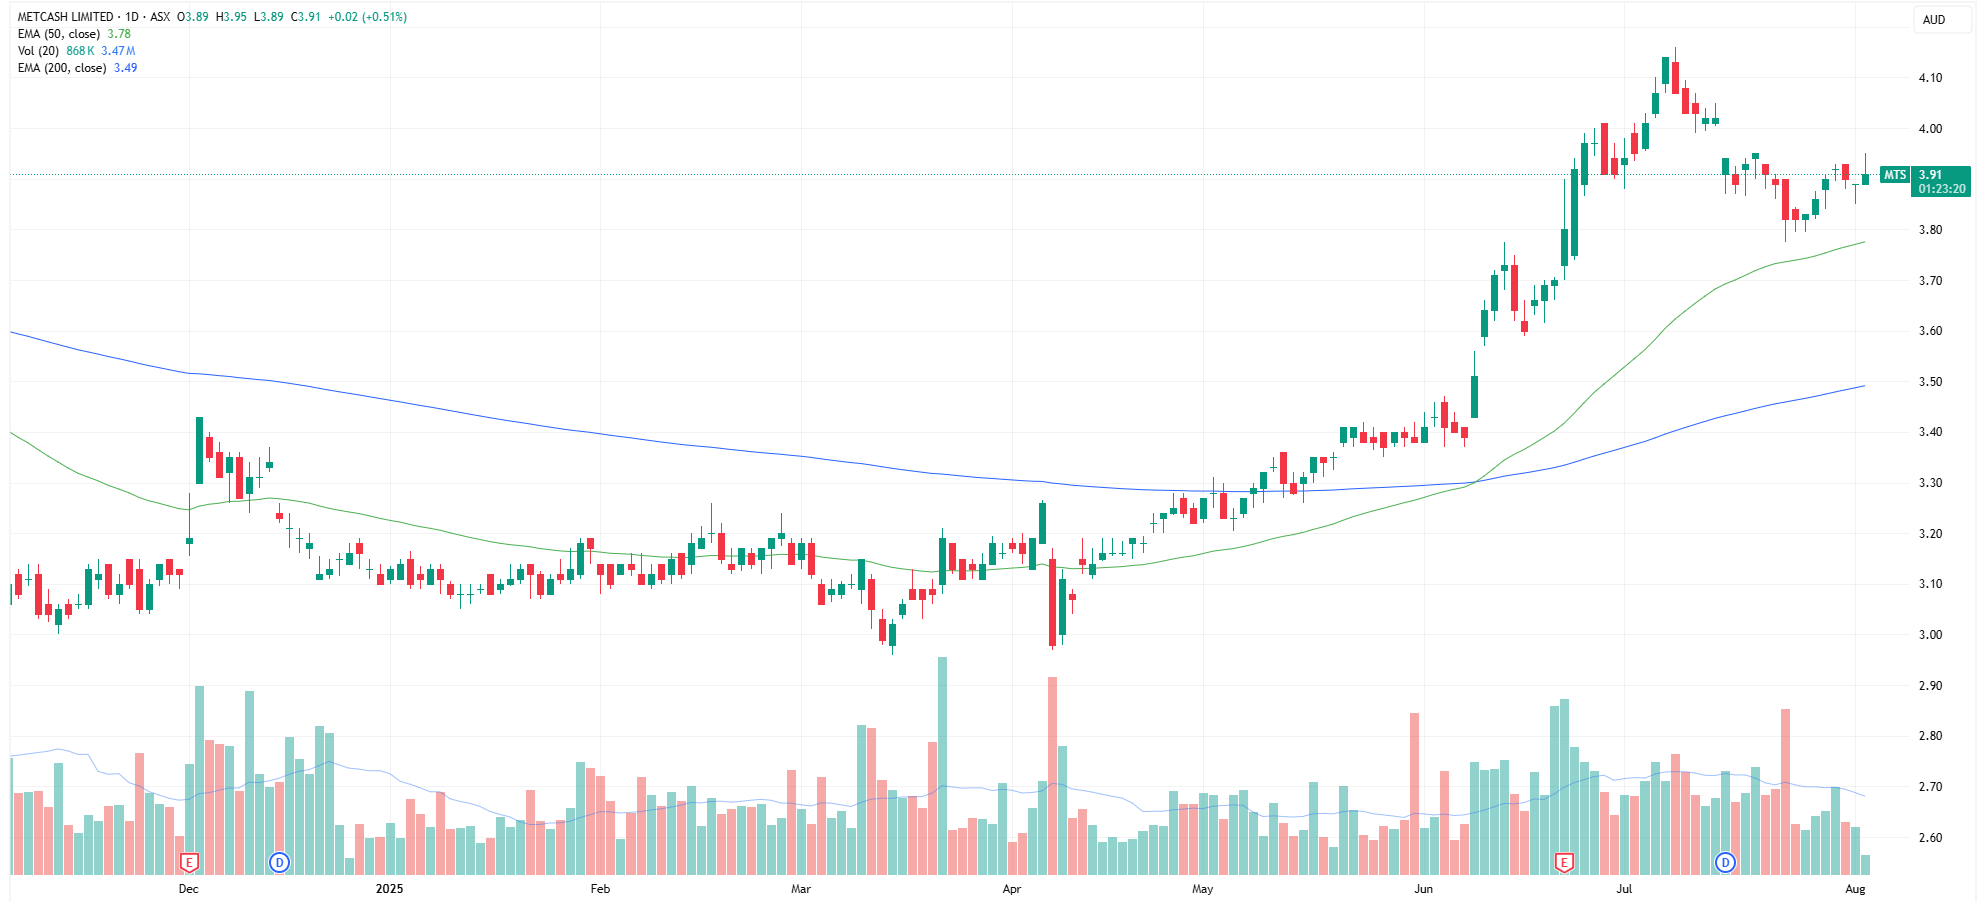
Metcash daily price chart (Source: TradingView)
Hansen Technologies (ASX: HSN) provides another example, upgrading FY25 cash EBITDA guidance to $92-94 million from $76-85 million previously (up 15.5% at the midpoint) and underlying EBITDA margin to 28% versus Morgan Stanley’s 24.4% estimate. The stock surged 9.0% on announcement day (14 July) and has gained another 14% since.
Strategy for investors
The 16-season data suggests a clear playbook for earnings season:
Winners tend to keep winning: Companies that beat expectations on results day often continue outperforming for months, making them attractive momentum plays.
Losers face extended pain: Missing expectations typically signals deeper issues that take time to resolve, making these stocks worth avoiding even if they appear oversold.
Timing matters: The initial market reaction often correctly identifies which companies have genuine fundamental momentum versus those facing headwinds.
While past performance doesn’t guarantee future results, the consistency of this pattern across multiple market cycles suggests that earnings expectations remain one of the most reliable indicators of near-term stock performance during (and after) reporting season.
Never miss an update
Enjoy this wire? Hit the ‘like’ button to let us know.
Stay up to date with my current content by
following me below and you’ll be notified every time I post a wire