
We have analyzed electrical current flowing through DNA under varying mechanical strains and irradiation conditions to investigate the piezo-vibrotronic effect in DNA nanowires. The aim is to elucidate the underlying factors that govern the interaction between piezoelectric and photonic properties in DNA-based nanostructures.
Electrical response under mechanical strain (isolated piezoelectric effect)
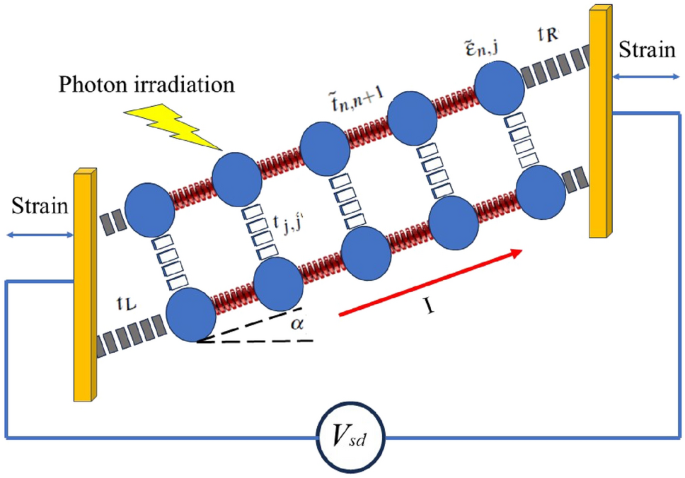
Investigating of the piezoelectric effect in DNA nanowires involves an analysis of the electrical current behavior under external mechanical strain. In the current study, we have considered a P53 sequence of DNA with \(N=120~bps\) to determine the effect of the mechanical strain on its charge transport properties.
Figure 2 a, shows I-V characteristic diagram for different strain effects in low voltage conditions. At the voltages up to about \(V_{sd}=0.4~V\), no electrical current flows through the system at direct and reverse voltages. When, the voltage reaches 0.4 V and higher than it, the electrical current in the system oscillates and increases nonlinearly. The electrical response of the DNA sequence to the mechanical strain is different. Conversely, the electrical current behavior of the compressing strain \((S_{l}<0)\) and stretching one \((S_{l}>0)\) is different. Compressive strain \((S_{l}<0)\) shortens the DNA helix, reducing the distance between adjacent nucleobases. This increases electronic overlap between \(\pi -\)stacked bases, enhancing charge carrier mobility. However, excessive compression may distort the hydrogen bonds or backbone, possibly disrupting charge transport pathways. Tensile strain \((S_{l}>0)\) elongates the DNA, increasing the distance between bases. This reduces \(\pi -\)orbital overlap, decreasing hopping efficiency and thus lowering current. If the applied strain becomes too large, the DNA may denature, breaking conduction pathways entirely. DNA exhibits piezoelectric behavior due to its asymmetric charge distribution. Under compressive strain, the piezoelectric effect can enhance internal polarization, modify the local electric field, and facilitate charge transport. In contrast, tensile strain may reduce polarization, thereby hindering current flow.
Additionally, strain alters the electronic band structure of DNA. Compression can narrow the bandgap, increasing carrier density and improving conductivity, while tensile strain may widen the bandgap, reducing charge transport efficiency. According to Ref.37, the threshold voltage, where significant current begins to flow, shifts with varying strain. Under low strain, the threshold voltage is lower, while higher strain values increase the threshold voltage, reflecting the increased energy barrier for charge transport. At low strain values, DNA retains its native helical structure, resulting in relatively stable and high conductivity. The current–voltage (I–V) curve in this regime exhibits a linear relationship, indicating ohmic behavior. As strain increases, the DNA begins to deform, altering the electronic coupling between base pairs. This leads to a non-linear current–voltage (I–V) characteristic, with a noticeable increase in current at higher voltages. At high strain levels, significant structural distortions disrupt charge transport pathways. The I–V curve in this regime exhibits a reduced slope, indicating decreased conductivity and potential saturation effects33. Figure 2 b is a 3-D diagram that shows the electrical current through DNA for simultaneous variation of source-drain voltage and strain values. It confirms that electrical current shows different behavior for different applied strains after \(V_{sd}=0.4~V\). For lower voltages, the electrical current vanishes.
The obtained results are in agreement with previous findings that reported that I-V curves of the DNA nanowires exhibited significant changes when subjected to mechanical strain. Under compressive strain, an increase in current was observed, indicating enhanced carrier mobility due to the piezoelectric potential generated within the DNA structure38.
Fig. 2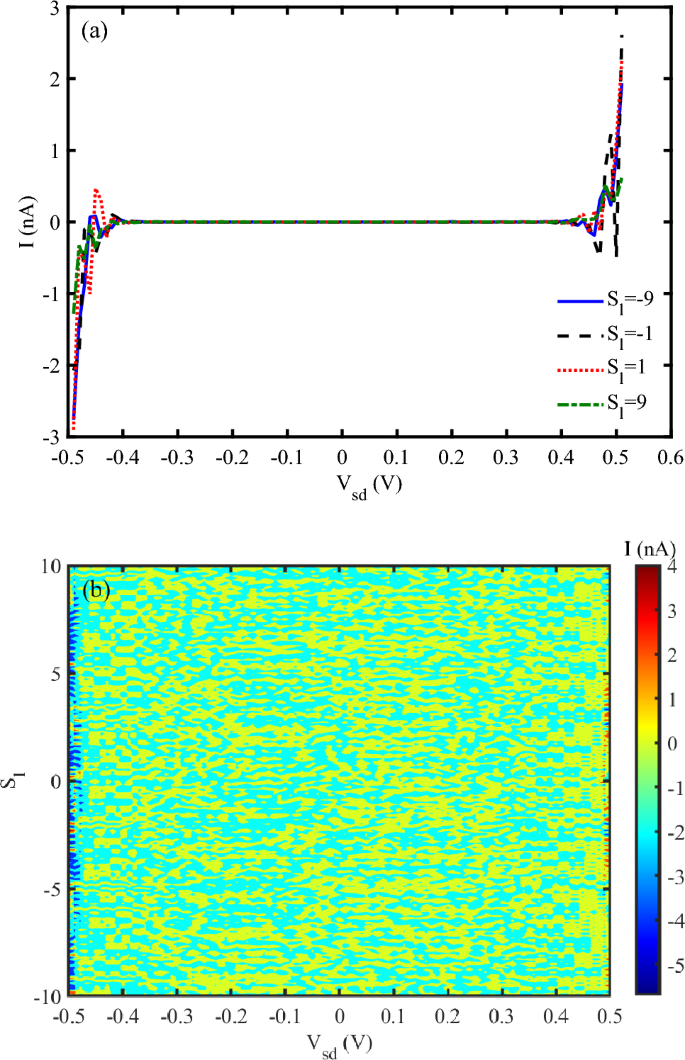
(a) I-V characteristic diagram for different strain effects (without THz irradiation), (b) Electrical current following through DNA versus simultaneous variation of source-drain voltage and strain (without THz irradiation).
Charge transport under THz radiation (isolated vibronic effect)
EM wave irradiation reveals significant changes in the electrical properties of DNA. The previous results indicate a clear correlation between EM wave intensity and the variation in charge transport efficiency. In the present research, we examine the effect of EM wave irradiation on the electrical current through DNA in the absence of an external strain (Fig. 3).
In this work, the electromagnetic (EM) wave excitation spans frequencies below \(2~\text {THz}\) (millimeter-wave to far-infrared), targeting DNA’s low-energy vibrational modes rather than electronic transitions. This contrasts with classical piezo-phototronics, which typically operates at UV–visible frequencies-for example, ZnO bandgap excitation occurs at approximately \(3.2~\text {eV}\) (\(\sim 385~\text {THz}\)). We selected THz frequencies in the context of DNA piezo-phototronics because DNA’s collective vibrational modes (e.g., twisting and stretching) resonate within the 0.1–\(2~\text {THz}\) range39,40. These vibrational modes enable strain–photon coupling without damaging covalent bonds, unlike ultraviolet (UV) irradiation. Terahertz (THz) waves modulate hopping integrals through lattice vibrations, while mechanical strain alters the piezoelectric polarization. In contrast, optical frequencies primarily excite interband electronic transitions, where ultrafast carrier dynamics tend to decouple the effects of mechanical strain. Terahertz (THz) frequencies match DNA’s collective vibrational modes-such as twisting and breathing-typically in the 0.1–\(1~\text {THz}\) range, thereby enabling effective strain–photon coupling. Below \(2~\text {THz}\), piezoelectric polarization remains coherent and intact. In contrast, optical frequencies (\(>10~\text {THz}\)) can disrupt covalent bonds, whereas THz radiation selectively excites delocalized charges without causing structural damage. Ultraviolet (UV) photons (4–\(6~\text {eV}\)) excite localized \(\sigma\) and \(\pi\) electrons, disrupting resonant charge transport pathways. Moreover, mechanical strain cannot respond to the ultrafast optical cycles (periods \(<10~\text {fs}\)), effectively nullifying piezoelectric modulation at such frequencies. High-frequency excitation also promotes non-radiative decay processes, leading to thermal heating that can raise DNA temperatures above its melting point (\(T > 350~\text {K}\)). As a result, the 0–\(2~\text {THz}\) range optimally supports piezo-phototronic (or piezo-vibrotronic) coupling while avoiding bond-breaking energy thresholds. In contrast, at optical frequencies, interband electronic transitions and thermal effects dominate, effectively decoupling strain-mediated charge transport.
Figure 3, shows the electrical current through DNA sequence versus concurrent alteration of both the amplitude and frequency of the irradiating EM wave in the absence of an external mechanical strain. At the low amplitude irradiation, the electrical current oscillates with the frequency and reaches about 18 nA. However, the electrical current shows a decreasing behavior concerning the THz amplitude as far as the electrical current vanishes when the amplitude of photon reaches 0.1 \(\frac{{\hbar c}}{{er_{0} }}\).
Fig. 3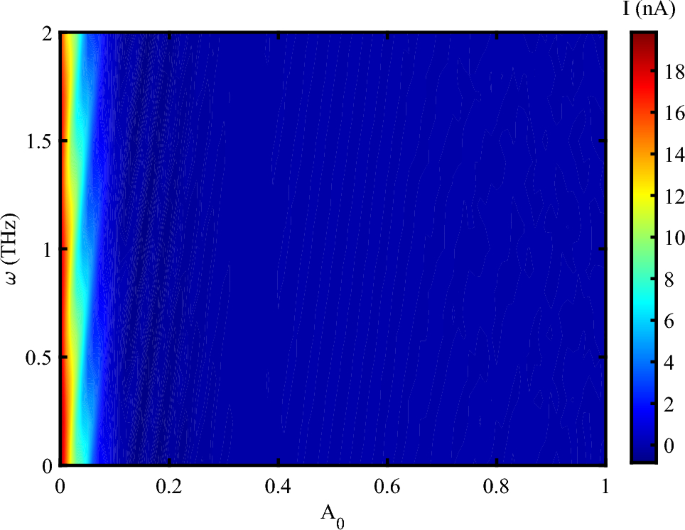
Electrical current following through DNA versus concurrent alteration of both the amplitude of EM irradiation in the unit of \(\frac{\hbar c}{er_{0}}\) and its frequency at unit of THz without strain effect, (\(V_{sd}=0.1~V\)).
Combined strain and THz excitation (piezo-vibrotronic effect)
When the system is affected by an external strain in the presence of THz radiation, we have an oscillating electrical current at different frequencies up to \(A_{0}=0.3~\frac{\hbar c}{er_{0}}\) (Fig. 4). After this value, the electrical current decreases, but doesn’t vanishes. The result determines that the photon irradiation enhances the electrical current through DNA. This indicates that the electrical feedback of DNA to the irradiation emerges as an amplified electrical current. Also, via the applying a mechanical strain, the electrical current can flow through DNA at the higher amplitudes and reach to 20 nA at some frequencies. Mechanical strain modulates the distance and orbital overlap between \(\pi\)-stacked nucleobases. An optimal level of strain-neither too weak nor too strong-maximizes electronic coupling, thereby enhancing charge delocalization. At a critical strain value, the system reaches a resonant condition in which charge carriers hop more efficiently between bases. As a result, the electrical current reaches its maximum.
In Fig. 4, the current exhibits periodic oscillations with the electromagnetic (EM) frequency \(\omega\), but eventually saturates at a maximum value that becomes independent of \(\omega\). Electronic states in DNA are excited when the electromagnetic frequency matches the inter-base hopping rates (approximately 0.1–\(2~\text {THz}\) for \(\pi\)-stacked DNA). This resonance leads to the formation of standing charge waves, resulting in current oscillations. However, at higher frequencies, strain-induced polarization saturates due to the finite mechanical response time of DNA (on the order of \(\sim 100~\text {fs}\)). Therefore, the periodic oscillations in current arise from resonant charge injection into the electronic states of DNA, while the maximum current is determined by the time scales of carrier recombination and piezoelectric screening. Additionally, the observed current oscillations result from the modulation of electron hopping integrals by the interaction between the applied THz field and DNA’s low-frequency vibrational modes. When the driving frequency resonates with specific vibrational modes-typically in the 0.1–\(2~\text {THz}\) range-constructive interference enhances hopping coherence, leading to oscillatory behavior in the charge current. Considering the simultaneous effect of photon irradiation and strain, one can report that the charge transport in DNA decreases due to increase the amplitude of irradiation (Fig. 5). Electrical current amplifies when a moderate stretching strain applies on DNA sequence. Electrical current flowing through DNA in the presence of a compressing strain is higher than a stretching strain. The application of tensile strain resulted in a decrease in current, suggesting a modulation of the band structure and carrier transport properties41. The piezoelectric potential generated by the applied strain influenced the charge carrier dynamics. This potential modulated the energy barriers at the lead-DNA interfaces, thereby affecting the injection and extraction of carriers42. According to the previous reports, the strain-induced piezoelectric potential also altered the local electric field within the DNA nanowires, impacting the recombination and separation of photo-generated electron-hole pairs43. Under illumination, the DNA nanowires demonstrated a notable increase in photocurrent when mechanical strain was applied. This enhancement is attributed to the piezo-phototronic effect, where the piezoelectric potential aids in the separation and transport of photo-generated carriers44. The strain-dependent photocurrent response highlights the synergistic interaction between the piezoelectric and photonic properties of the DNA nanowires45. The analysis revealed that the piezo-vibro(photo)tronic effect led to a modulation of the band structure in the DNA nanowires. The strain-induced piezoelectric potential caused a shift in the conduction and valence bands, thereby influencing the carrier transport mechanism46. This band structure modulation is crucial for optimizing the performance of DNA-based optoelectronic devices, as it allows for precise control over the electronic properties through mechanical strain47.
Fig. 4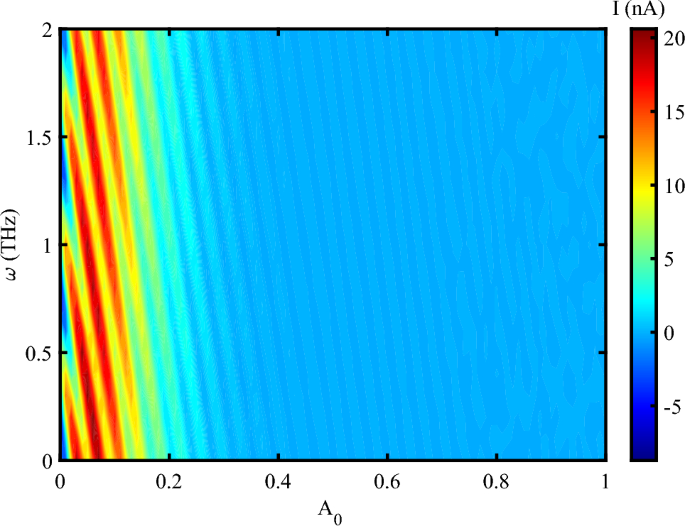
Electrical current following through DNA versus concurrent alteration of both the amplitude of EM irradiation in the unit of \(\frac{\hbar c}{er_{0}}\) and its frequency at unit of THz at \(S_{l}=2\), (\(V_{sd}=0.1~V\)).
Fig. 5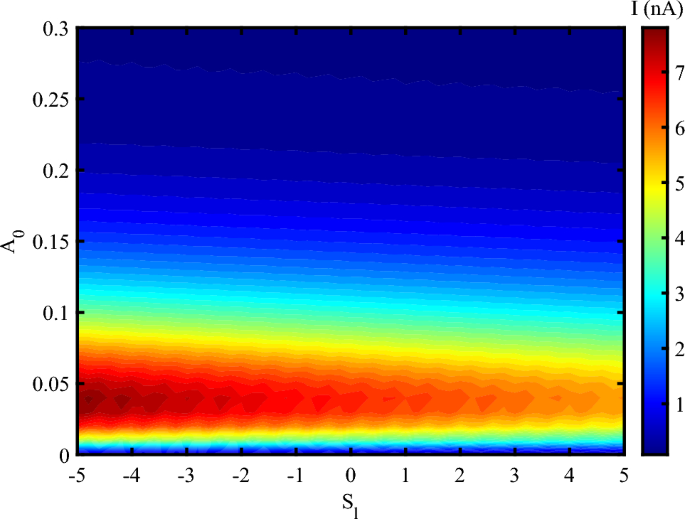
Electrical current following through DNA versus simultaneous variation of EM amplitude in the unit of \(\frac{\hbar c}{er_{0}}\) and strain intensity, (\(V_{sd}=0.2~V, \omega =0.02~THz\)).
Fig. 6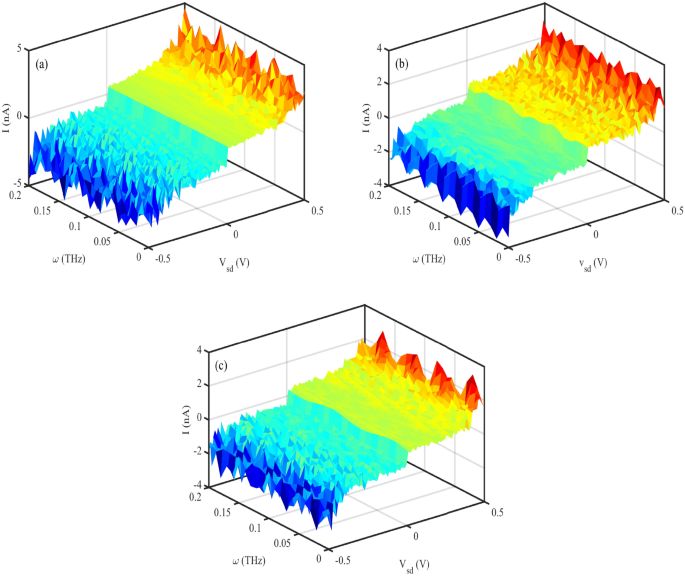
Electrical current versus simultaneous variation of photon frequency and source-drain voltage for P53 sequences with (a) \(N=60~bps\) (b) \(N=120~bps\) (c) \(N=180~bps\), (\(\omega =0.2~THz, A_{0}=0.8~\frac{\hbar c}{er_{0}}, S_{l}=2\)). The images are generated using MATLAB R2016a (https://www.mathworks.com/products/matlab.html).
Sequence dependence and tilt angle
The effectiveness of charge movement through the DNA molecule can vary with the length of the DNA sequence. The resistance of DNA increases exponentially with the length of the sequence, then, the electrical current decreases due to increasing the DNA length. We have considered the effect of DNA length on I-V characteristic diagrams of the P53 sequence with different lengths (Fig. 6). Fig. 6 a–c shows electrical current flowing through the P53 sequence with (a) \(N=60~bps\) (b) \(N=120~bps\), and \(N=180~bps\) versus simultaneous variation of EM frequency and source-drain voltage. The obtained result determines that the electrical current shows an oscillatory behavior concerning the photon frequency, and decreases via the increasing the sequence length.
The non-linear I-V characteristics observed at higher strain levels suggest the presence of complex charge transport mechanisms, possibly involving tunneling and hopping processes. These mechanisms are influenced by the altered electronic band structure and the increased disorder within the DNA molecule37. Comparing the I-V characteristics of DNA under different strain values helps understand the impact of mechanical deformation on its electronic properties. This analysis can reveal how strain affects the conductivity, threshold voltage, and overall charge transport mechanisms48. I-V characteristic diagram of P53 sequence with \(N=120~bps\) at two different values of photon frequency is shown in Fig. 7 a. It is clear that the pick point of oscillatory electrical current at \(\omega =0.2~THz\) is higher than \(\omega =0.02~THz\) at most. Therefore, we can report that the charge mobility of DNA increases when the frequency of photon increases. The increase in charge mobility observed in DNA within the 0.02–\(0.2~\text {THz}\) frequency range can be attributed to resonant coupling between THz photons and DNA’s low-energy collective vibrational modes. This coupling enhances charge delocalization along the \(\pi\)-stacked base pairs. Notably, DNA exhibits intrinsic vibrational modes in the low-frequency range of approximately 0.01–\(1~\text {THz}\). When the THz photon frequency matches these intrinsic vibrational modes, resonant absorption occurs, exciting coherent vibrational motion within the DNA structure. These vibrations transiently modulate the electronic coupling between \(\pi\)-stacked bases, thereby enhancing charge mobility. Specifically, photons in the 0.1–\(0.2~\text {THz}\) range can drive coherent lattice dynamics, which reduce dynamic disorder. As a result, the transient improvement in \(\pi\)-orbital overlap facilitates more efficient charge hopping. The I-V characteristic diagram of P53 sequence with different lengths confirms that the electrical current is inversely related to its length, so that, the electrical current peaks for \(N=60~bps\) is the highest among them (Fig. 7 b).
The specific order of nucleotides is crucial in charge transport properties of DNA sequences. We have analyzed the influence of several sequences of base pairs with the same length (\(N=120~bps\)) in the electrical response of DNA to the strain and irradiation in Fig. 8. The general form of the I-V characteristic diagram for three different sequences is almost the same, but, the electrical current peaks are different for them. Poly AT sequences generally exhibit lower charge transport efficiency compared to poly CG sequences due to weaker \(\pi -\pi\) stacking interactions between adenine and thymine bases. Also, when subjected to mechanical strain, poly AT sequences tend to elongate more easily, which can disrupt the \(\pi -\pi\) stacking interactions and reduce electrical conductivity, but, poly CG sequences are more resistant to mechanical deformation, maintaining better electrical conductivity under strain49,50. On the other hand, poly AT sequences can generate photocurrent when irradiated with EM waves, but the efficiency is generally lower compared to poly CG sequences. Poly CG sequences are more efficient at generating photocurrent due to better electronic coupling between bases. These sequences can undergo significant structural changes upon THz irradiation, which can enhance or modulate their electrical properties51. The other sequences such as P53 have some regions potentially maintaining conductivity while others may experience significant disruption. Then, the efficiency of photocurrent generation in such a sequence depends on the specific nucleotide arrangement and the presence of photon-sensitive regions. Therefore, this sequence can exhibit varied responses to the strain and photo irradiation, with some regions showing enhanced electrical properties while others may not.
Fig. 7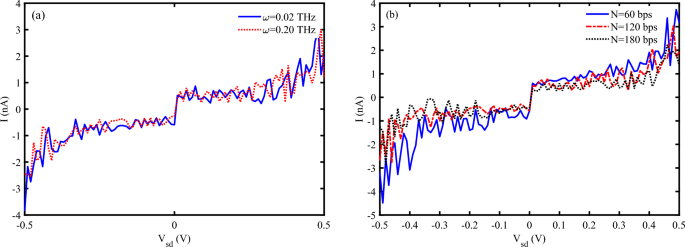
I-V characteristic diagram for (a) P53 sequence with \(N=120~bps\) at two different frequencies of EM irradiation, (b) P53 sequence with different lengths (\(\omega =0.2~THz\)), (\(A_{0}=0.8~\frac{\hbar c}{er_{0}}, S_{l}=2\)).
Fig. 8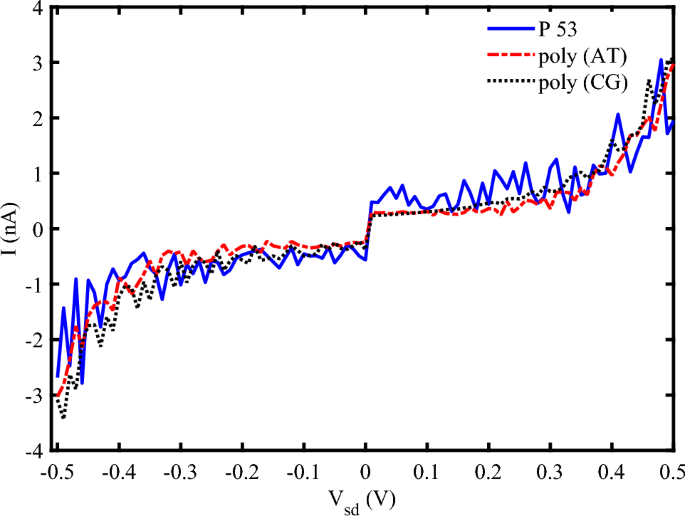
I-V characteristic diagram for Different sequences (\(N=120~bp\), \(\omega =0.2~THz\), \(A_{0}=0.8~\frac{\hbar {c}}{er_{0}}, S_{l}=2\)).
The tilt angle of the DNA can influence the degree of mechanical deformation. Here, we study the simultaneous effect of variation of tilt angle and strain intensity influences on the electrical current traversing the P53 sequence (Figs. 9 a, b). The electrical current in DNA decreases by increasing the tilt angle. The compressing strain can enhance the electrical current until \(\alpha\) is less than \(\pi /4~rad\). For \(\alpha > \pi /4\), electrical current goes to vanish by increasing the \(\alpha\). The result is in agreement with the previous finding. A larger tilt angle may impose additional strain on the hydrogen bonds between base pairs, potentially reducing conductivity52. However, a moderate tilt angle can also help maintain the integrity of \(\pi\)–\(\pi\) stacking interactions, thereby preserving electrical conductivity even under mechanical deformation.
Fig. 9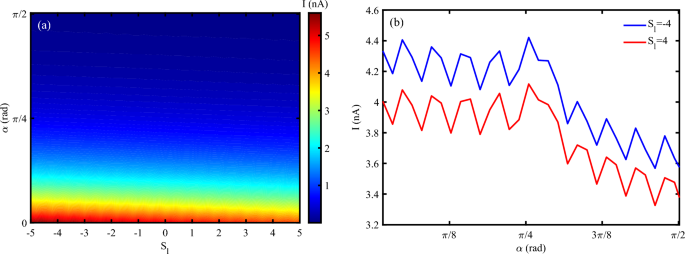
(a) Electrical current following through DNA versus simultaneous variation of tilt angle and strain intensity, (b) Electrical current versus tilt angle for different strain effects (\(N=120~bp, \omega =0.02~THz, A_{0}=0.1~\frac{\hbar c}{er_{0}}, V_{sd}=0.2\)).
Chaos theory dynamics: multifractal analysis (as an advanced tool)
It was previously reported that the electrical states of a DNA sequences show the multifractal behavior. Also, the electrical current time series flowing through DNA behaves as a multifractal system. Multifractalitiy refers to the property of a time series that exhibits multiple scaling behaviors, meaning different parts of the series may scale differently. This contrasts monofractal series, which have a single scaling exponent. Multifractal analysis is a known method to study the system’s multifractality. In this regard, multifractal spectrum (\(D_{q}\)), which describes how the fractal dimension of the time series varies with the moment order q, is defined as follows:
$$\begin{aligned} D_{q}=\frac{1}{q-1}\lim _{\epsilon \rightarrow 0} \frac{\log \sum _{i=1}^{N_\epsilon } \left[ P(i, \epsilon )\right] ^q}{\log \epsilon } \end{aligned}$$
(15)
where \(\epsilon\) is the scale, \(N_\epsilon\) is the number of segments of size \(\epsilon\), and \(P(i,\epsilon )\) represents the fluctuation function.
On the other hand, the singularity spectrum (\(f(\alpha )\)) determines the distribution of singularities in the time series. It provides a detailed characterization of the multifractal nature of the series. \(f(\alpha )\) is written as follows:
$$\begin{aligned} f(\alpha ) = q \alpha – \tau (q) \end{aligned}$$
(16)
where \(\alpha\) is the singularity strength, and \(\tau (q)=(q-1) D_{q}\) is the mass exponent function.
Also, the thermodynamic formulation of multifractal measures can propound an expression for the “analogous” specific heat as follows22,53:
$$\begin{aligned} C(q)=-\frac{\partial ^{2}\tau (q)}{\partial q^{2}}\approx \tau (q+1)-2\tau (q)+\tau (q+1) \end{aligned}$$
(17)
Figures 10 investigate the multifractal spectrum (\(D_{q}\)) and singularity spectrum (\(f(\alpha )\)) for different values of EM wave amplitude at a moderate strain effect (\(S_{l}=2\)) (to check and verify the obtained result of Fig. 5). It is clear that the width of the multifractal spectrum \((D_{q_{max}}-D_{q_{min}})\) increase via the increasing of amplitude of wave (Fig. 10 a). The width of the multifractal spectrum indicates the range of scaling behaviors present in the time series. A larger width suggests a more complex and heterogeneous structure, while a smaller width indicates a more homogeneous structure. From fig. 5, we determine that the electrical current through DNA decreases via the increase of EM wave amplitude and then vanishes. Here, we reported that the decrease in current and its vanishing correspond to increase of width of the multifractal spectrum and complexity of the system. On the other hand, the width of the \(f(\alpha )\) function, often denoted as (\(\Delta \alpha\)), is a measure of the range of singularity strengths in a multifractal system. It provides insight into the complexity and heterogeneity of the system. A larger width indicates a more complex and heterogeneous structure, while a smaller width suggests a more homogeneous structure. \(f(\alpha )\) figure for all cases with different EM wave amplitudes have a concave diagram, which is in agreement with the multifractal nature of the system (Fig. 10 b). In Fig. 10 b, \(\Delta \alpha\) have a greater value for high-amplitude irradiations, which confirms a more complex system than other cases.
Figure 11 a, represents mass exponent function (\(\tau (q)\)) for different values of \(A_{0}\). Deviations from a straight line in \(\tau (q)\) diagram indicate multifractality of system, where different parts of the time series scale differently and have multiple scaling exponents. The greater the deviation from the straight line, the higher the degree of multifractality. \(\tau (q)\) diagram confirms that the system bring a high degree of multifractality through increase the irradiation amplitude (Fig. 11 a). Then, we find that diminishing the electrical current of a DNA piezoelectric system via the increase the amplitude of irradiation can be due to the enhancement of multifractality and then, complexity of the system.
In multifractal analysis, the concept of “analogous specific heat” ( C(q) ) is used to describe the variability of the multifractal spectrum54. It is analogous to the specific heat in thermodynamics, which measures the response of a system to changes in temperature. Here, C(q) measures the response of the multifractal spectrum to changes in the moment order q. C(q) equation represents the second derivative of the mass exponent function concerning q, analogous to the specific heat in thermodynamics. C(q) provides a measure of the variability or “heat capacity” of the multifractal spectrum. A higher C(q) indicates greater variability in the scaling behavior of the time series. Also, C(q) curve can resemble a classical phase transition, with peaks indicating critical points where the scaling behavior changes significantly. C(q) determines a classical (first-order) physical phase transition at a critical point indicated by the primary peak position at \(A_{0}=0.05,0.1, 0.2~\frac{\hbar c}{e r_{0}}\). Additionally, C(q) exhibits a shoulder to the left of the primary peak at \(A_{0}=0.3~\frac{\hbar c}{e r_{0}}\) (Fig. 11 b). It is known that such unusual behavior of a double-peaked specific heat function is observed in the Hubbard model within the weak-to-strong coupling regime. Consequently, it can be inferred that the presence of the principal peak in C(q) signifies a similar phase transition that may occur when the system responds to particular drives. The double peak behavior under nonspecific loading is associated with the onset of a crash in the electrical current as an output signal.
Fig. 10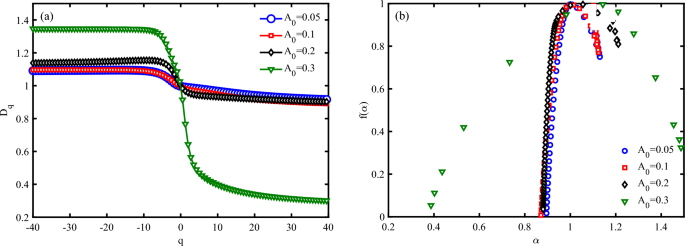
Multifractal analysis of electronic states a P53 sequence with \(N=120~bps\) for different irradiation amplitudes in the unit of \(\frac{\hbar c}{e r_{0}}\), (a) multifractal spectrum (Dq), and (b) singularity spectrum \((f(\alpha ))\) (\(\omega =0.1~THz\), \(S_{l}=-4\)).
Fig. 11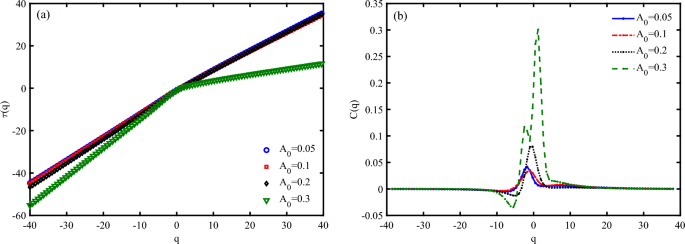
Multifractal analysis of electronic states a P53 sequence with \(N=120~bps\) for different irradiation amplitudes in the unit of \(\frac{\hbar c}{e r_{0}}\), (a) mass exponent function \((\tau (q))\), and (b) analogous specific heat (C(q)), (\(\omega =0.1~THz\), \(S_{l}=-4\)).