
Effects of AP on cell morphology and cell viability of UCB-CD34+ cells
After isolating CD34+ cells from umbilical cord blood, we determined their purity before employing the cells in subsequent experiments. Flow cytometry analysis showed that the purity of the CD34+ cells isolated from UBC was higher than 99% (Fig. 1B) and the cells exhibited HSC morphology (Fig. 1C).
The optimal concentration of AP for culture of CD34+ cells was determined using MTS assay. CD34+ cells were incubated with optimized expansion medium with and without AP at the indicated concentrations for 3, 5, and 7 days. The results showed that treatment with AP at concentrations of 1, 2.5, and 5 µM increased viability of CD34+ cells, however, treatment with AP at concentrations higher than 10 µM and 20 µM markedly reduced cell viability by about 10% and 30% at day 7 (Fig. 1D). Therefore, AP at 1, 2.5, and 5 µM were selected for subsequent experiments.
Fig. 1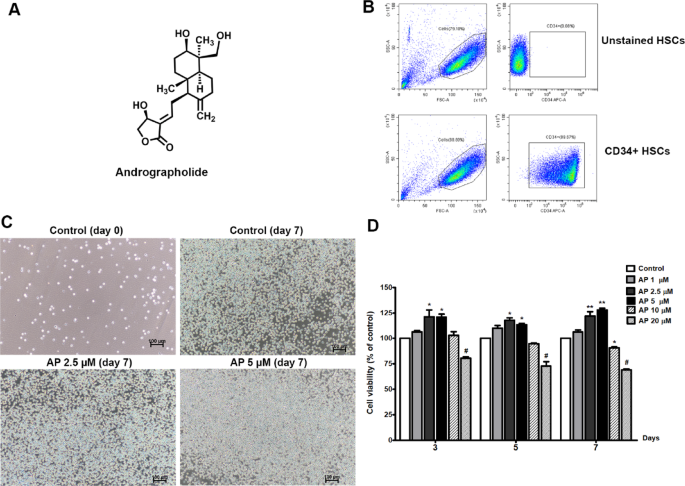
Effects of AP on cell morphology and expansion of UCB- CD34+ cells. (A) Chemical structure of AP, (B) Purity of isolated CD34+ cells, (C) Cell morphology before and after culturing with AP at two different concentrations (2.5 and 5 µM), photos were captured on day 7 (10× objective, scale bar; 100 μm). The control was composed of cytokines and methanol, (D) Viability of UCB-CD34+ cells after treatment with AP at different concentrations for 3, 5, and 7 days. Data are shown as mean ± SEM, *p < 0.05, **p < 0.01 compared to control.
AP increased the expansion of UCB-CD34+ cells and inhibited the senescence of expanded cells
UCB-CD34+ cells were cultured in an expansion medium in the presence or absence of 1, 2.5, and 5 µM AP for 1, 3, 5, and 7 days. Using trypan blue exclusion assay, we observed that the total number and relative fold-expansion of cultured cells was significantly higher in the 2.5 and 5 µM AP-treated than in the control at days 3, 5, and 7 (Fig. 2A). The proliferative effect of AP was also confirmed by BrdU assay on day 7. We found that AP at 2.5 and 5 µM significantly increased the number of BrdU+ cells compared to the control (Fig. 2B). The cells increased by AP were confirmed to be CD34+ cells. As shown in Fig. 2C, AP at 1, 2.5, and 5 µM increased CD34+ cells (fold change) to 1.35 ± 0.08, 1.68 ± 0.122, and 2.26 ± 0.19, respectively, compared to the control (the percentage of CD34+ cells was shown in supplementary data, Fig. S1).
Cell cycle assays revealed that AP treatment increased the cell population in the S phase while decreasing the cell population in the G1/G0 phase (Fig. 2D). In this study, the biomarker of cellular senescence was Senescence-Associated β-Galactosidase (SA-βgal). After 14 days of incubation, the number of the SA-βgal positive cells in the AP-treated group (5 µM) was significantly less than that of the control (P < 0.01) (Fig. 2E). These results indicated that AP increased the expansion of HSCs by promoting cell cycle progression without leading to cell apoptosis or death and by inhibiting HSC senescence.
Fig. 2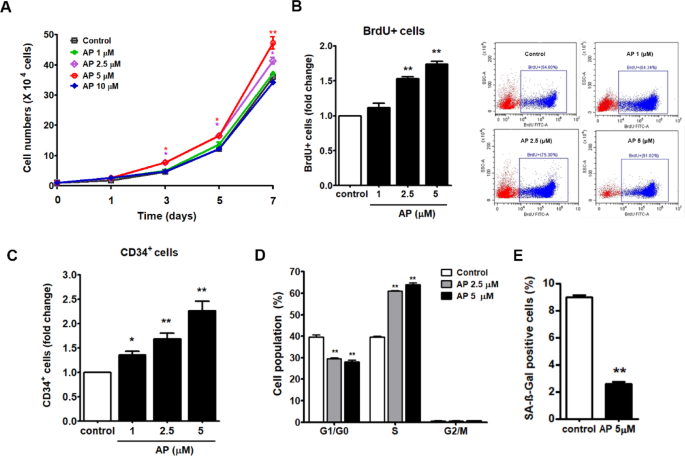
Effects of AP on the proliferation, expansion of UCB-CD34+ cells, cell cycle and senescence of expanded UCB-CD34+ cells. (A) Total viable cell number throughout 7 days of culture after treatment with AP (B) Fold change of BrdU + cells along with flow cytometric data showing the percentage of BrdU + cells (C) relative fold-expansion of CD34+ cells after treatment with AP for 7 days (D) Cell cycle analysis (E) The number of β-galactosidase positive cells (senescent cells). Data are shown as mean ± SEM from three independent experiments. *P < 0.05, **P < 0.01, compared with the control.
Effect of AP on primitive HSCs expansion
The most primitive hematopoietic stem cell (HSC) population reported to date is characterized as CD34+CD38-CD90+CD45R-. We next investigated the effect of AP on phenotypically defined primitive HSC markers, including CD34 positive, CD38 negative, CD90 positive and CD45R negative populations (CD34+, CD38-, CD90+, CD45R-). UCB- CD34+ cells were cultured in expansion medium in the presence or absence of 1, 2.5, and 5 µM AP for 7 days. The results show that the fold-expansion of CD34+CD45RA- (Fig. 3A), CD34+CD90+ CD45RA- (Fig. 3B), CD34+ CD38- CD45RA- (Fig. 3C), and particularly CD34+CD38-CD90+ CD45RA- cells (Fig. 3D) significantly increased when cultures were supplemented with AP at 2.5 and 5 µM. Collectively, these results suggest that AP promoted cytokine-enhanced expansion of primitive HSCs.
Fig. 3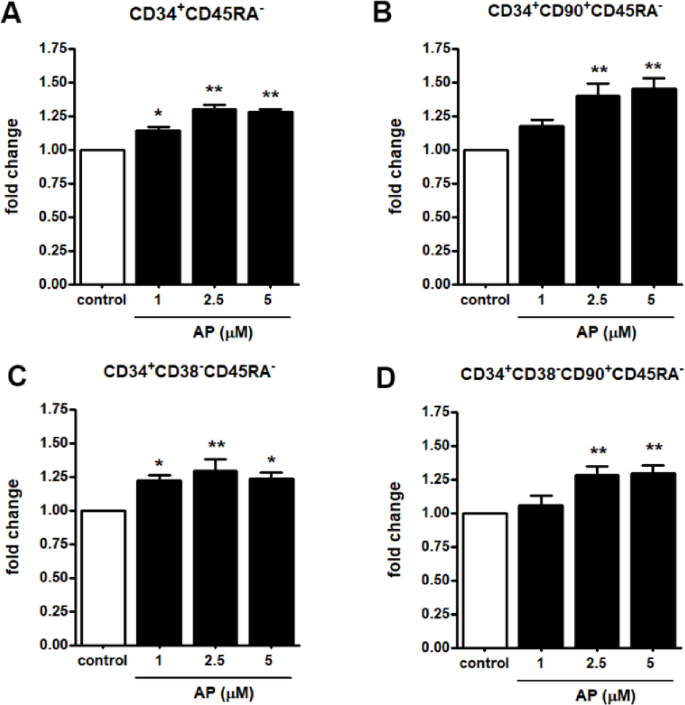
Effect of AP on ex vivo expansion of defined primitive HSCs. Representative FACs analysis plots of CD34+CD38-CD90+CD45RA- cells stained with CD34, CD38, CD90 and CD45RA antibodies at 7 days of culture. (A) CD34+CD45RA- (B) CD34+CD90+CD45RA- (C) CD34+CD38-CD45RA- (D) CD34+CD38-CD90+ CD45RA-. Data are represented as mean ± SEM from three independent experiments, * P < 0.05, * * P < 0.01 compared with the control.
Ability of AP to induce HSC expansion while maintaining their stemness in vitro
The expression of characteristic genes related to HSC stemness was then assessed. Based on the RT-qPCR results, HSC-specific markers and functionally important genes (CD34, CD90, CD133, CD117, ALDH1) were upregulated in the AP treated cells in a dose-dependent manner (1, 2.5, and 5 µM) (Fig. 4A). In addition, HSC-relevant genes and transcriptional factors including BMI1, HOXB4, GATA-2, RUNX1, and CXCR4 were also upregulated in the AP treated cells compared to the control (Fig. 4B).
Fig. 4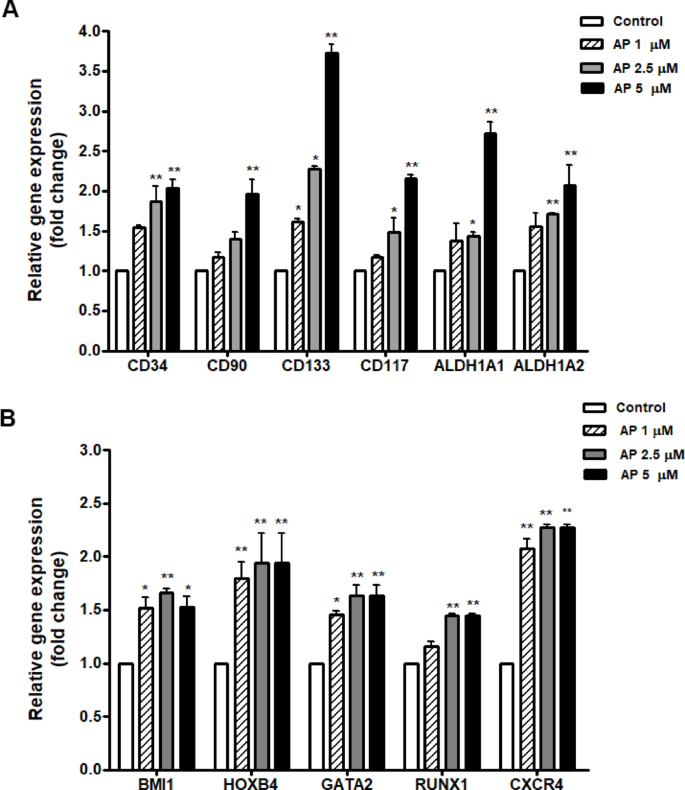
Effect of AP on the expression of characteristic genes related to HSC stemness. Relative gene expressions as fold change at 7 days of culture with AP; (A) HSC-specific markers and functionally important genes (CD34, CD90, CD133, CD117, ALDH1, ALDH2) and (B) HSC-relevant genes and transcriptional factors (BMI1, HOXB4, GATA-2, RUNX1, and CXCR4). Data is represented as mean ± SEM from three independent experiments. *P < 0.05, **P < 0.01 compared with the control.
AP sustained multipotency of HSC in vitro
The loss of multipotency is one of the major limitations of ex vivo HSC expansion. We therefore further investigated whether cells treated with AP have multi-lineage potential. We performed CFC assay after 7 days of culture; 500 cells were transferred to a semisolid differentiation medium for another 14 days to allow colony formation. Representative morphological images of different types of colonies are shown in Fig. 5A. AP-treated cells showed prominent colony-forming potential of granulocytes and macrophages (GM) compared to the control. A comparable increase was also observed in granulocyte–erythrocyte-macrophage–megakaryocyte (GEMM) colonies, which reflected the function of multipotent progenitors (MPPs), when treated with AP. As for the erythroid colonies, the number of BFU-E and CFU-E were also significantly increased (Fig. 5B). These results indicated that AP retained the capacity of hematopoietic stem and progenitor cells (HSPCs) to differentiate into multilineages in cultures.
Fig. 5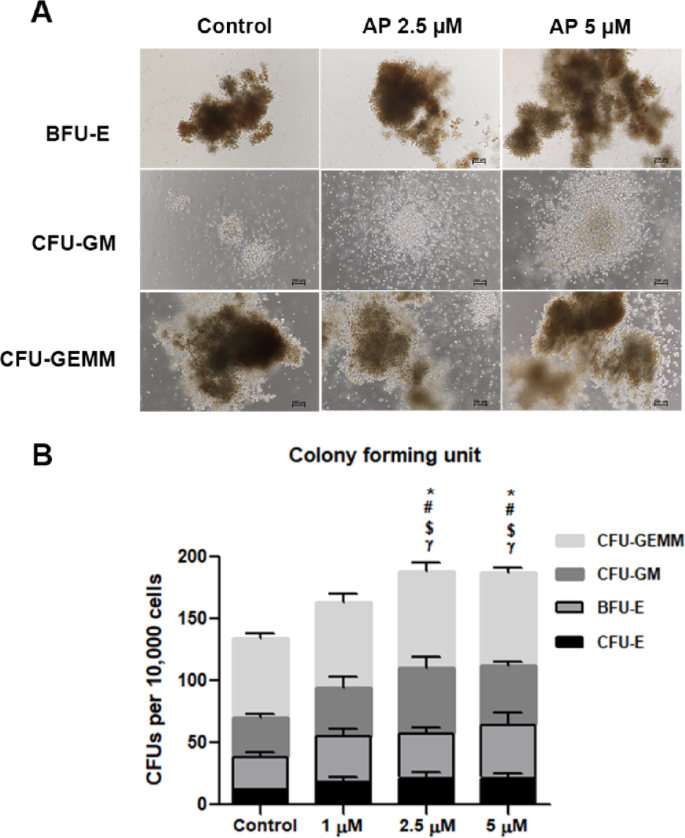
The colony-forming potential of AP-expanded CD34+ cells. (A) Representative images of colony formation (BFU-E, CFU-GM and CFU-GEMM) in Methocult® media following 14 days of culture. (B) The colony-forming potential of expanded CD34+ cells after culture with cytokines alone or 1, 2.5 or 5 µM AP. Colonies were counted according to colony size and cellular composition. Abbreviations: BFU-E, erythroid burst forming units; CFU-GM, granulocyte/macrophage common precursors. Comparing each colony between group: * represents CFU-E colony, # represents BFU-E colony, $ represents CFU-GM colony and γ represents CFU-GEMM colony). Data is represented as mean ± SEM from three independent experiments. Data is represented as mean ± SEM from three independent experiments. *P < 0.05, #P < 0.05, $P < 0.05 and γP < 0.05, compared with control group for each day.
Ability of AP to modulate the Notch and Wnt/β-catenin signaling pathways
As AP preserved the HSC phenotype with inhibition of differentiation rather than promotion of the expansion of total mononuclear cells, we then investigated the effect of AP on the expression of genes in two major signaling pathways related to HSC self-renewal and differentiation: the canonical Wnt/β-catenin and Notch signaling pathways. The results showed that the relative expression of β-catenin gene (CTNNB1), which is a key gene in the canonical Wnt signaling pathway, was significantly increased in AP treated cells compared to the control. Likewise, the β-catenin target genes including AXIN2, LEF1, FZD2, CCDN1, CD44, and c-MYC were also significantly enhanced in the AP treated cells compared with the control (Fig. 6A). Moreover, the key gene in the Notch signaling pathway, NOTCH1 was elevated in AP-treated cells compared to the control, and the Notch target genes HES1, HEY1, and HES5 were also significantly upregulated by AP (Fig. 6B). Taking these results together, we suggest that AP may affect signaling of the cytokines in ways that activate the Notch and Wnt/β-catenin pathway for the preservation of HSC stemness, while preventing the effect of cytokines on cell differentiation, ultimately resulting in enhanced CD34+ cell expansion.
Fig. 6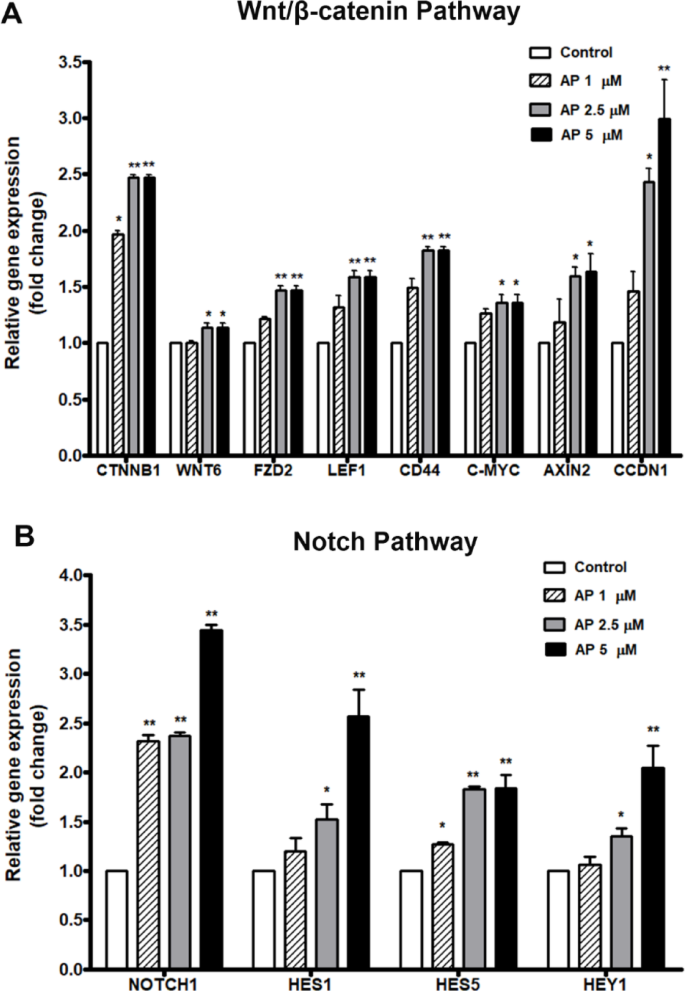
Effect of AP on gene expression of UCB-CD34+ cells determined by RT-qPCR. (A) key genes and target genes in Wnt/β-catenin pathway (B) key gene and target genes in Notch pathway. Bars represent the mean fold-changes of gene expression in the AP-treated cells relative to the control. *P < 0.05, **P < 0.01 compared to the control.
Pathway analysis by nanostring
To clarify the mechanism by which AP enhances the proliferation and expansion of UCB-CD34+ cells, genes in stem cell pathways were analyzed and determined by the NanoString nCounter Analysis as in Fig. 7; Table 2. The modulation of AP mostly affected the expression of genes that are involved in the self-renewal, maintenance, differentiation, survival, and senescence of HSCs. In comparison with the control, we found that AP significantly upregulated the expression of Wnt/β-catenin signaling related genes such as BAMBI, CACYBP, CTBP1, CTNNB1, NLK, SKP1 and TBL1X which are important for HSC renewal and expansion. In addition, cell growth promoting and survival genes in the signaling pathway of TGF-β, SMAD, Hippo, JAK-STAT and AMPK are upregulated by AP. These pathways are not only important for cell growth but also for controlling pluripotency of stem cells and inhibiting cellular senescence. Moreover, numerous important genes for maintaining primitive HSCs such as ADAM10, ALDH7A1, ALDH9A1, CD34, and GATA3 were upregulated by AP. Apart from signaling pathways involved in cell proliferation and stemness, AP also affected signaling molecules involved in cell adhesion and extracellular matrix remodeling which in turn regulate genes for proliferation and differentiation of HSCs such as FYN, ITGA5, RAP1B, ROCK2, SHC1, SRC, TLN1, FOSL2, ITGA2B and ITGB3.
In contrast, AP significantly downregulated several groups of genes which were associated with cell cycle arrest and cellular senescence (ATM, SIRT1, SLC25A4), HSC activation and differentiation (ID2, BMPR1A, LDB1, TGM2, TET1, MAF, FOSL2), tumorigenesis and target for cancer (PLCG1, CACNA2D2, CDH1) as well as ECM and proteoglycan in cancer (EXT1, LUM, EPCAM). These modulations might imply that AP did not stimulate expression of genes involved in cell differentiation and cancer development in UCB-CD34+ cells. These results indicate that AP affects multiple pathways necessary for maintaining the self-renewal and multi-lineage differentiation capacity of hematopoietic stem cells (HSC). However, the direct effects of AP on these pathways must be demonstrated using specific inhibitors for each pathway.
Fig. 7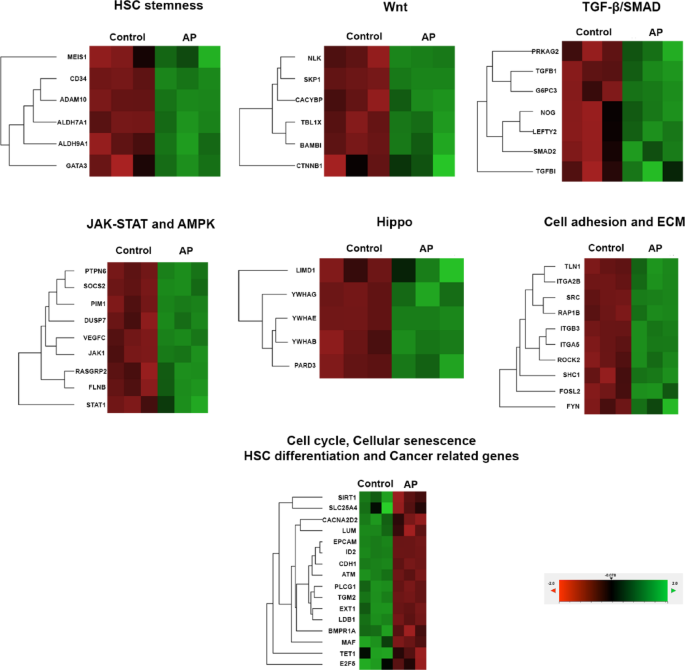
Stem cell pathway analysis in expanded CD34 + cells treated with AP (5µM) determined by Nanostring analysis system. P < 0.05, three independent experiments.
Table 2 The list of genes which were downregulated or upregulated by AP treatment that shows statistical significance (P < 0.05) compared to differentiation control performed by NanoString analysis.