
Trump’s job approval42% of Americans strongly or somewhat approve of how Donald Trump is handling his job as president, and 54% disapproveThat’s a net approval — the percent who approve minus the percent who disapprove — of -12Trump’s net approval of -12, while negative, is higher than he has received the past few weeks, and more positive than he received at this point in his first term (-15)Trump’s support among Republicans, while still very high, has slowly trended downwards since the start of his second termThe January 26 – 28, 2025 poll found that 92% of Republicans and Independents who leaned Republican approved of Trump and 5% disapproved, a net approval of +87By mid-May, Trump’s approval among Republican-leaning Americans was 88% with 9% disapproving, a net approval of +79This week, 83% of Republican-leaning Americans approve of Trump, and 13% disapprove, a net approval of +70The 9-point drop in approval of Trump among Republican-leaning Americans, from 92% to 83%, is equivalent to an overall drop in approval of Trump of around 4% of all U.S. adult citizensThe slow decline in Trump’s approval among Republicans and Republican-leaning Independents has been partially offset recently by a small increase in his approval among the 20% of Americans who lean toward neither party33% of these non-leaning voters approve of Trump, and 55% disapprove, a -22 net approvalThat’s down from -3 net approval in this group at the start of Trump’s second termBut this is the highest net approval Trump has received from Americans who lean toward neither party in more than two months: The May 31 – June 2 poll found that 35% of this group approved of Trump and 48% disapproved, a -14 net approvalThe share of Americans who view Trump as honest and trustworthy (31%) is at a new low since the start of his second term in JanuaryThe Epstein investigationNet approval of Trump’s handling of the Epstein investigations has changed little in recent weeks, and is currently at -39 (-82 among Democrats and +14 among Republicans)A majority of Americans think Trump knew some (27%) or a lot (44%) about the sex crimes committed by Epstein against underage girls before investigations into Epstein began; only 8% say he knew nothing about themEpstein-accomplice Ghislaine Maxwell was recently moved to a minimum-security federal prison in Texas. Far more Americans say she should not have been moved than say she should have (47% vs. 14%); many (38%) are unsure. More Democrats than Republicans oppose the move (59% vs. 32%)About half (48%) of Americans are unsure whether Trump ordered Maxwell’s move to a lower security prison; 36% think he did and 16% think he didn’tPartisan gerrymanderingWhile 39% of Americans believe that states are allowed to draw congressional districts in a way that intentionally favors one party over the other, only 9% think this practice should be allowedIn situations where one state redraws its congressional districts to give one party a lopsided advantage, 35% of Americans say other states should retaliate by redrawing their districts to favor the other party; 30% say they should notRepublicans are somewhat more likely than Democrats to say that states should be allowed to draw districts in a way that favors one party over the other (16% vs. 6%), and they are less likely than Democrats to say that other states should retaliate against states that do this (29% vs. 43%)Roughly half (52%) of Americans would prefer for an independent commission to draw congressional districts in their state; 17% say the state legislature shouldMore Democrats than Republicans would prefer an independent commission (59% vs. 43%) and fewer would prefer the state legislature (13% vs. 24%), but even among Republicans the preference for an independent commission is almost two to oneFew Americans (16%) think congressional districts are drawn fairly in most parts of the country; 46% think they are drawn unfairly in most of the country. Democrats are more likely than Republicans to say most districts are drawn unfairly (55% vs. 39%)Slightly more Americans say their own state’s congressional districts are drawn fairly than say so about most of the country’s districts (24% vs. 16%); 34% say their state’s districts are drawn unfairlySimilar shares say the congressional districts in their state give an advantage to Democrats (21%) as say they do Republicans (22%); 28% say they don’t give an advantage to either partyAbout two-thirds (66%) would prefer for their state to not give an advantage to either party when drawing congressional districts; slightly more would prefer for their state’s districts to be drawn to give an advantage to Republicans (12%) than to Democrats (8%)More Republicans than Democrats would prefer for their state’s districts to give an advantage to their own party (31% vs. 22%)70% of Americans have heard about Texas Democratic lawmakers leaving the state to prevent a vote on a congressional redistricting planSlightly more Americans strongly or somewhat disapprove (42%) than approve (37%) of the FBI helping to track down the Democratic lawmakers from Texas who left the stateThere has been little change in the share of Americans who say the economy is “getting worse” (48%) over the past five monthsThere also hasn’t been a notable increase in the last five months in the share of Americans who expect their personal finances to be worse a year from now (28%)Americans have a particularly negative outlook about one economic issue: inflation48% expect there to be higher inflation in six monthsThat’s the highest share of Americans expecting higher inflation according to Economist / YouGov polls since October 2023, with the exception of a single poll conducted April 5 – 8, 2025, in the immediate aftermath of Trump’s “Liberation Day” tariff announcementOnly 17% of Americans expect there to be a lower rate of inflation in six months, down from 33% in December 2024UnemploymentTwice as Americans say Trump’s firing of the Bureau of Labor Statistics commissioner was unjustified than say it was justified (36% vs. 18%) after being shown Trump’s reasoning for the move: “Trump said he did it because recent ‘jobs numbers were rigged in order to make the Republicans, and me, look bad.'” Nearly half (46%) of Americans are unsure whether the firing was justified or notMost Democrats (64%) say the firing was not justified; 3% say it was justified. Among Republicans, 38% view it as justified, while 9% think it was not justifiedThe share of Americans who say that unemployment has increased in the past month is 32% — a slight decline from last week but still higher than at other points in Trump’s current term as president; 12% think unemployment has decreased and 22% think it has stayed the sameMany Americans (39%) believe the government undercounts unemployed people in the U.S.; 7% think the government overcounts unemployed people and 22% think that government unemployment numbers are accurateDemocrats are more likely than Republicans (49% vs. 28%) to believe that the government is undercounting the unemployedSimilar shares of Americans say they completely or somewhat trust federal data on the economy as say they distrust it (41% vs. 42%). These results have changed little since last week’s pollMost employed Americans (62%) say they are not very worried about losing their job; 27% say they are somewhat worried and 11% say they are very worried. Among Americans with jobs, far more Republicans than Democrats say they aren’t very worried (71% vs. 47%)If they were to lose their job, most employed Americans think it would be either somewhat hard (42%) or very hard (27%) to find a new job that paid as much as they are making now; 21% say it would not be very hard. On this, too, there is a partisan gap: More Republicans than Democrats say it would not be very hard to find a similar paying job (29% vs. 16%)
— Carl Bialik contributed to this article
Throughout this report, some numbers may appear to be off by 1 because of rounding
See the toplines and crosstabs for the August 9 – 11, 2025 Economist/YouGov Poll
Methodology: The poll was conducted among 1,635 U.S. adult citizens. Respondents were selected from YouGov’s opt-in panel to be representative of U.S. adult citizens. A random sample (stratified by gender, age, race, education, geographic region, and voter registration) was selected from the 2019 American Community Survey. The sample was weighted according to gender, age, race, education, 2024 presidential vote, 2020 election turnout and presidential vote, baseline party identification, and current voter registration status. 2024 presidential vote, at time of weighting, was estimated to be 48% Harris and 50% Trump. Demographic weighting targets come from the 2019 American Community Survey. Baseline party identification is the respondent’s most recent answer given around November 8, 2024, and is weighted to the estimated distribution at that time (31% Democratic, 32% Republican). The margin of error for the overall sample is approximately 3.5%.
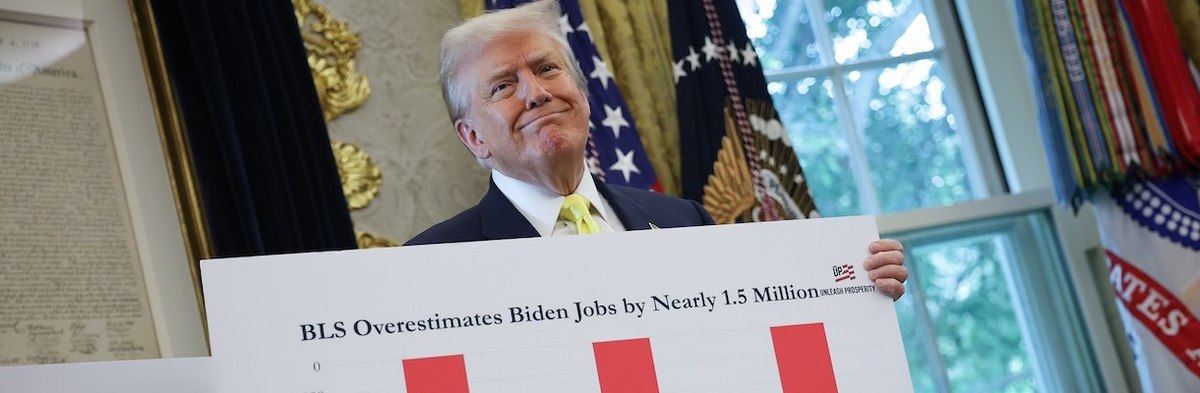
Image: Getty (Win McNamee / Staff)
What do you really think about President Trump, American politics in general, and everything else? Share your reality, join the YouGov panel, and get paid to share your thoughts. Sign up here.