
The population of children declined in every U.S. region except the South, new data released by the U.S. Census Bureau last week showed.The estimates cover demographics including age, race, ethnicity and sex from 2020 to July 1, 2025. They show how the population of different age groups changed across the U.S.All other age groups also increased the most for the region, which has seen an increase in its population.How age groups changed by regionThe South was also the only place where the 45 to 64 age group population increased, though it was very small.What counties saw the largest change in population under 18Among counties where the population under 18 years old increased, several were in Texas. The two largest increases were counties on the outskirts of Dallas and Houston.Texas also had several counties with some of the largest declines, including Loving County, which has the largest drop in the population under 18.Use the map below to see how the population under 18 changed from 2020 to 2025.How did the median age changeThe median age was estimated to be 39.4 years old as of July 1, 2025 — an increase from 39.2 the prior year. The median age has gone up every year since at least 2020, which is the first year of this set of estimates from the U.S. Census Bureau.More than two-thirds of metropolitan and micropolitan areas experienced an increase in median age from 2020 to 2025, in line with the national trend. Just 251 out of the 927 metro and micro areas saw a decline in median age.PHNjcmlwdCB0eXBlPSJ0ZXh0L2phdmFzY3JpcHQiPiFmdW5jdGlvbigpeyJ1c2Ugc3RyaWN0Ijt3aW5kb3cuYWRkRXZlbnRMaXN0ZW5lcigibWVzc2FnZSIsKGZ1bmN0aW9uKGUpe2lmKHZvaWQgMCE9PWUuZGF0YVsiZGF0YXdyYXBwZXItaGVpZ2h0Il0pe3ZhciB0PWRvY3VtZW50LnF1ZXJ5U2VsZWN0b3JBbGwoImlmcmFtZSIpO2Zvcih2YXIgYSBpbiBlLmRhdGFbImRhdGF3cmFwcGVyLWhlaWdodCJdKWZvcih2YXIgcj0wO3I8dC5sZW5ndGg7cisrKXtpZih0W3JdLmNvbnRlbnRXaW5kb3c9PT1lLnNvdXJjZSl0W3JdLnN0eWxlLmhlaWdodD1lLmRhdGFbImRhdGF3cmFwcGVyLWhlaWdodCJdW2FdKyJweCJ9fX0pKX0oKTs8L3NjcmlwdD4=
WASHINGTON —
The population of children declined in every U.S. region except the South, new data released by the U.S. Census Bureau last week showed.
The estimates cover demographics including age, race, ethnicity and sex from 2020 to July 1, 2025. They show how the population of different age groups changed across the U.S.
All other age groups also increased the most for the region, which has seen an increase in its population.
How age groups changed by region
The South was also the only place where the 45 to 64 age group population increased, though it was very small.
What counties saw the largest change in population under 18
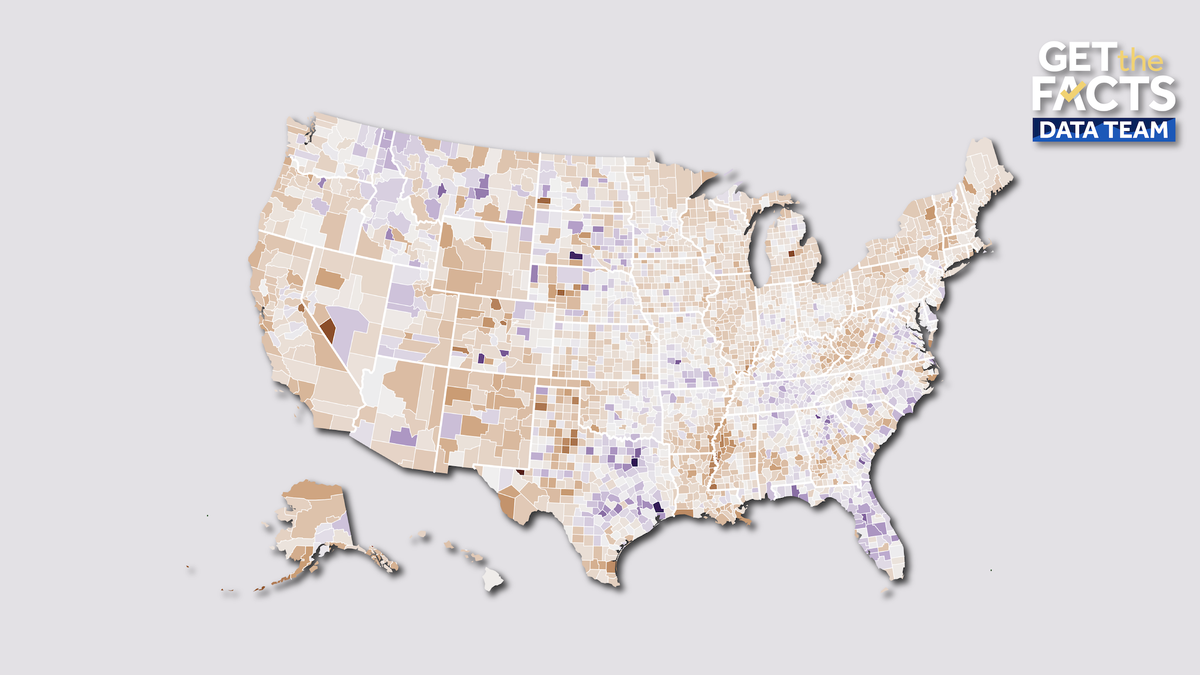
Among counties where the population under 18 years old increased, several were in Texas. The two largest increases were counties on the outskirts of Dallas and Houston.
Texas also had several counties with some of the largest declines, including Loving County, which has the largest drop in the population under 18.
Use the map below to see how the population under 18 changed from 2020 to 2025.
How did the median age change
The median age was estimated to be 39.4 years old as of July 1, 2025 — an increase from 39.2 the prior year. The median age has gone up every year since at least 2020, which is the first year of this set of estimates from the U.S. Census Bureau.
More than two-thirds of metropolitan and micropolitan areas experienced an increase in median age from 2020 to 2025, in line with the national trend. Just 251 out of the 927 metro and micro areas saw a decline in median age.