
August 2, 2026
Three days before this survey began, U.S. President Donald Trump signed proclamations imposing additional 50% tariffs on a range of Canadian products, including wine, hockey sticks and cement. The tariffs would apply even to covered goods that qualify under the United States-Mexico-Canada Agreement and are scheduled to take effect on August 19.
On the first day of fieldwork, Prime Minister Mark Carney met with Canada’s premiers and territorial leaders in Charlottetown. He said Canada was intensifying negotiations with the United States but was prepared to respond if the tariffs took effect, adding that “everything’s on the table” if an agreement could not be reached.
At the same time, large wildfires were burning across the country. By July 20, Ontario reported 190 active fires, including 56 considered out of control. Thirteen communities had been evacuated or were in the process of evacuating, displacing more than 1,800 people.
Our latest national tracking survey, conducted with 1,910 Canadians from July 23 to 29, finds that these events have not fundamentally changed vote intentions or assessments of the government.
The Liberals continue to lead the Conservatives by six points. Government approval remains above 50%. Mark Carney retains a substantial personal advantage over Pierre Poilievre.
But what Canadians are focused on has shifted.
Concern about Donald Trump and his administration has risen six points, making it the second most frequently selected issue facing the country. Concern about climate change and the environment has increased three points (7 over a month), as wildfires evacuations and smoke became more prominent.
Liberals Continue to Lead by Six Points
If an election were held today, 44% of committed voters would vote Liberal, 38% would vote Conservative, 9% would vote NDP, 6% would vote for the Bloc Québécois and 3% would vote Green.
Compared with our survey completed on July 16, Liberal support is up one point and Conservative support is also up one. NDP and Green support are unchanged, while the Bloc is down one.
The result is an unchanged six-point Liberal advantage.
Among those who say they are certain to vote, the Liberal lead widens to eight points. The Liberals receive 45%, the Conservatives 37% and the NDP 9%. This reflects a small turnout boost for the Liberals and a small turnout penalty for the Conservatives.

Canadian Public Affairs Update · July 2026
Federal Vote Intention: Liberals 44, Conservatives 38, NDP 9
n=1,910 Canadians · July 23–29, 2026 · MoE ±2.24%
National
Certain to Vote
By Region
By Gender & Age
Accessible Pools
Methodology
If an election was held today, which national political party would you vote for? (Undecided removed)
Federal Vote Intention — July 2026
The Liberals lead the Conservatives by 6 points, 44% to 38%. Both major parties are up one point since July 16, with the NDP steady at 9% and the Bloc down one to 6%.
PartyCurrent Vote ShareJuly 16, 2026Change
Liberal44%43%▲ +1Conservative38%37%▲ +1NDP9%9%NCBloc Québécois6%7%▼ -1Green3%3%NCPeople’s1%1%NCOther0%0%NC
If an election was held today, which national political party would you vote for? (Undecided removed — those certain to vote)
Among Canadians certain to vote, the Liberal lead grows to 8 points (45% to 37%). Turnout modestly boosts the Liberals (+1) and suppresses the Conservatives (−1) relative to the full electorate.
Vote Share — Those Certain to Vote
PartyVote ShareTurnout Boost / Suppression
Liberal45%▲ +1Conservative37%▼ -1NDP9%NCBloc Québécois6%NCGreen2%▼ -1People’s1%NCOther0%NC
If an election was held today, which national political party would you vote for? (Undecided removed)
The Conservatives dominate the Prairies (60% in Alberta, 47% in Sask./Manitoba) while the Liberals lead in Ontario (47%), Quebec (48%), and B.C. (43%). Atlantic Canada is tied at 45% apiece.
Federal Vote by Region
LPCCPCNDPBQGreenPPCOtherCanada44%38%9%6%3%1%0%British Columbia43%37%13%0%6%1%0%Alberta27%60%9%0%2%1%1%Sask. / Manitoba38%47%8%0%3%4%0%Ontario47%38%11%0%2%2%1%Quebec48%20%2%28%2%0%0%Atlantic45%45%9%0%1%0%0%
Highest value in each row is highlighted. LPC = Liberal, CPC = Conservative, BQ = Bloc Québécois, PPC = People’s Party.
If an election was held today, which national political party would you vote for? (Undecided removed)
The Liberals hold a commanding 22-point lead among Canadians 60 and over (54% to 32%), while the Conservatives lead among those aged 30 to 44 (43%) and 45 to 59 (42%). The NDP is strongest with women (12%) and 18-to-29s (17%).
Federal Vote by Gender & Age
LPCCPCNDPBQGreenPPCOtherCanada43%37%9%7%3%1%0%Male44%38%5%7%3%2%0%Female43%37%12%5%2%1%0%18 to 2942%32%17%2%5%2%0%30 to 4437%43%11%6%2%1%0%45 to 5940%42%6%8%2%2%0%60 and over54%32%4%7%2%0%0%
Highest value in each row is highlighted. LPC = Liberal, CPC = Conservative, BQ = Bloc Québécois, PPC = People’s Party.
Would you consider or not consider voting for the following federal political parties?
57% of Canadians would consider voting Liberal — the largest accessible voter pool in the country. The Conservative pool sits at 48% nationally but collapses to 28% in Quebec, while the NDP’s pool reaches 40% in both Ontario and B.C.
Accessible Voter Pool — Canada
Accessible Voter Pool by Region
PartyCanadaQuebecOntarioB.C.
Liberal57%59%61%57%Conservative48%28%54%47%NDP32%15%40%40%
Highest value in each row is highlighted.
Methodology
The survey was conducted with 1,910 Canadians from July 23 to 29, 2026.
A random sample of panelists were invited to complete the survey from a set of partner panels based on the PureSpectrum platform. These partners are typically double opt-in survey panels, blended to manage out potential skews in the data from a single source.
The margin of error for a comparable probability-based random sample of the same size is plus or minus 2.24 percentage points, 19 times out of 20.
The data were weighted according to census data to ensure that the sample matched Canada’s population. Totals may not add up to 100 due to rounding.
All research conducted by Abacus Data is based on responses from real human participants recruited through verified, double opt-in panel partners. No synthetic, simulated, or AI-generated responses are used at any stage. All research complies with CRIC Public Opinion Research Standards and Disclosure Requirements.
This survey was paid for by Abacus Data.
Abacus Data · Canadian Public Affairs Update · July 29, 2026 · n=1,910 · MoE ±2.24%
abacusdata.ca
The Liberals Lead in British Columbia, Ontario and Quebec, While Atlantic Canada Is Tied
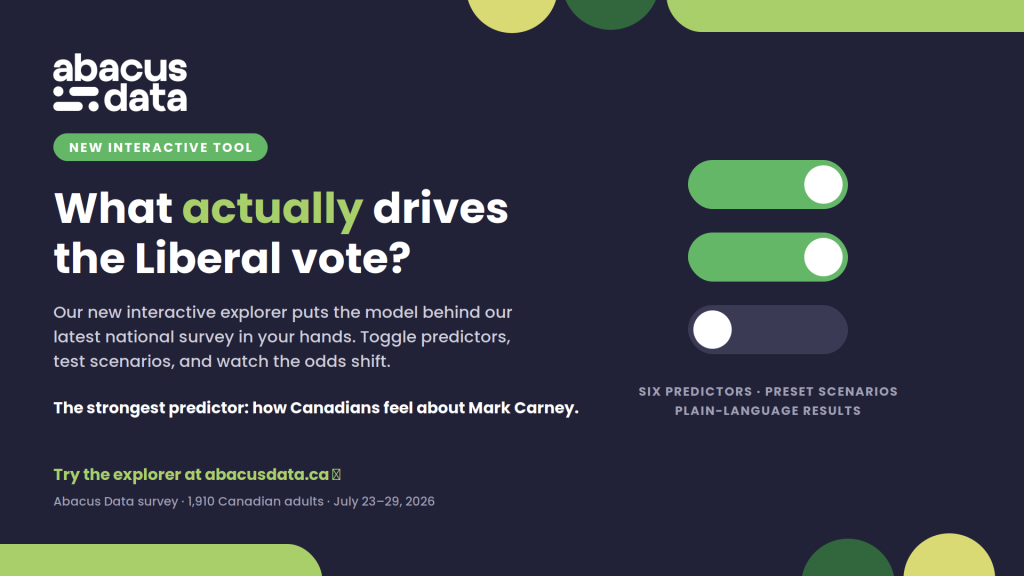
The regional results continue to give the Liberals an important electoral advantage, particularly in the country’s largest seat-rich provinces where byelections will be held in August.
In Ontario, the Liberals lead the Conservatives by nine points, 47% to 38%.
In Quebec, the Liberals are at 48%, followed by the Bloc Québécois at 28% and the Conservatives at 20%. The Liberal lead in Quebec remains one of the most important foundations of the party’s national advantage.
In British Columbia, the Liberals lead the Conservatives by six points, 43% to 37%, with the NDP at 13%.
The Conservatives remain dominant in Alberta, where they lead 60% to 27%. They also lead in Saskatchewan and Manitoba, although by a narrower margin of 47% to 38%.
Age Remains a Defining Political Divide
Age continues to be one of the clearest dividing lines in Canadian politics, although the Liberals have improved their position among younger Canadians in this wave.
Among Canadians aged 18 to 29, the Liberals lead the Conservatives by ten points, 42% to 32%. The NDP receives 17%, its strongest result among any age group, while the Greens receive 5%.
Among those aged 30 to 44, the Conservatives lead by six points, 43% to 37%, with the NDP at 11%.
Canadians aged 45 to 59 are more closely divided. The Conservatives are at 42% and the Liberals at 40%.
Among those aged 60 and over, the Liberals have a 22-point lead, receiving 54% compared with 32% for the Conservatives. The NDP receives just 4% among this group.
The Liberals’ national lead therefore continues to depend heavily on older Canadians.
The Conservatives are strongest among Canadians between 30 and 59, the groups most likely to be balancing housing costs, family expenses, employment concerns and retirement planning. These are also the age groups most exposed to the affordability and economic issues on which the Conservatives tend to perform best.
The NDP remains most competitive among younger Canadians, but even among those under 30, it remains well behind both the Liberals and Conservatives.
There is comparatively little gender difference in the support of the two largest parties. The Liberals receive 44% among men and 43% among women, while Conservative support is 38% among men and 37% among women. The more significant gender gap is in NDP support, which is 12% among women and 5% among men.
Government Approval Holds Steady at 52%
Fifty-two percent of Canadians approve of the job the federal government led by Mark Carney is doing. Thirty-two percent disapprove, while 16% neither approve nor disapprove.
Both approval and disapproval are unchanged from the previous wave.
The government’s net approval rating therefore remains at positive 20.
Canadian Public Affairs Update · July 2026
Government Approval: 52% Approve of the Carney Government, 32% Disapprove
n=1,910 Canadians · July 23–29, 2026 · MoE ±2.24%
Topline
Trend
By Region
By Vote
By Top Issue
Methodology
Overall, do you approve or disapprove of the job the federal government led by Mark Carney is doing?
Government Approval, July 2026
Approve
52%
NC since July 15
Disapprove
32%
NC since July 15
52% of Canadians approve of the job the Carney government is doing, while 32% disapprove. Both numbers are unchanged from July 15, 2026, leaving the government with a net approval of +20.
Full Breakdown
Neither approve nor disapprove
16%
Change from July 15, 2026: total approve NC, total disapprove NC.
Overall, do you approve or disapprove of the job the federal government led by Mark Carney is doing? (Trudeau government prior to March 2025)
Approval has been remarkably stable in 2026, holding in the low-to-high 50s all year. The trend shows the dramatic reversal in early 2025: approval sat in the mid-20s through 2024, crossed above disapproval in March 2025, and peaked at 59% in May 2026 before settling at 52% today.
Government Approval Trend, July 2024 to July 2026
Approve
Disapprove
0%10%20%30%40%50%60%70%
2025 election
52%32%
July 10-24Oct 22-24Jan 14-25Apr 8-25Aug 20-25Nov 27-25Mar 25-26July 29-26
52 survey waves, July 10, 2024 to July 29, 2026. Dashed line marks the April 2025 federal election; the question refers to the Trudeau-led government before March 2025 and the Carney-led government thereafter.
Overall, do you approve or disapprove of the job the federal government led by Mark Carney is doing?
Approval is highest in Ontario (56%), Quebec (54%), and B.C. (53%). Alberta is the only region where approval (42%) and disapproval (40%) are nearly even, while Quebec has the lowest disapproval in the country at 25%.
Approval by Region
Approve
Neither
Disapprove
RegionApproveNeitherDisapprove
British Columbia53%15%32%Alberta42%18%40%Sask. / Manitoba45%19%35%Ontario56%13%32%Quebec54%21%25%Atlantic46%13%40%Canada52%16%32%
Overall, do you approve or disapprove of the job the federal government led by Mark Carney is doing?
90% of current Liberal supporters approve of the government, as do 83% of 2025 Liberal voters. Notably, close to half of current NDP (45%), Green (49%), and Bloc (40%) supporters also approve, while approval sits at just 18% among current Conservative supporters.
By Current Vote Intention
Approve
Neither
Disapprove
By 2025 Federal Vote
Overall, do you approve or disapprove of the job the federal government led by Mark Carney is doing? (By respondents’ top 3 issues facing Canada)
The government’s strongest approval comes from Canadians focused on climate change (69%) and Donald Trump & his administration (64%). Its weakest reviews come from those most concerned about immigration, where 58% disapprove, and crime & public safety (40% disapprove).
Approval by Top Issue Priority
Approve
Neither
Disapprove
Climate change & the environment
Donald Trump & his administration
Housing affordability & accessibility
The rising cost of living
Respondents selected the three most important issues facing Canada today. Each row shows approval among those who chose that issue.
Methodology
The survey was conducted with 1,910 Canadians from July 23 to 29, 2026.
A random sample of panelists were invited to complete the survey from a set of partner panels based on the PureSpectrum platform. These partners are typically double opt-in survey panels, blended to manage out potential skews in the data from a single source.
The margin of error for a comparable probability-based random sample of the same size is plus or minus 2.24 percentage points, 19 times out of 20.
The data were weighted according to census data to ensure that the sample matched Canada’s population. Totals may not add up to 100 due to rounding.
Trend data reflect 52 waves of Abacus Data federal tracking conducted between July 2024 and July 2026.
All research conducted by Abacus Data is based on responses from real human participants recruited through verified, double opt-in panel partners. No synthetic, simulated, or AI-generated responses are used at any stage. All research complies with CRIC Public Opinion Research Standards and Disclosure Requirements.
This survey was paid for by Abacus Data.
Abacus Data · Canadian Public Affairs Update · July 29, 2026 · n=1,910 · MoE ±2.24%
abacusdata.ca
Carney Retains a Clear Personal Advantage
Mark Carney continues to be viewed more positively than either of the other major federal party leaders.
Forty-nine percent of Canadians have a positive impression of Carney, while 32% have a negative impression. His net impression is positive 17.
Pierre Poilievre is viewed positively by 37% and negatively by 43%, producing a net impression of negative 6.
Avi Lewis is viewed positively by 16% and negatively by 28%. Thirty percent have a neutral impression and 27% do not know enough about him to offer an opinion. His net impression is negative 12.
Carney’s rating has softened slightly since the previous wave, when his net impression was positive 19, but his overall advantage remains substantial.
His net impression is +33 among Canadians aged 60 and over and + 31 in Quebec. It is also positive in Ontario, British Columbia and Atlantic Canada.
Carney’s weakest region is Saskatchewan and Manitoba, where his net impression is slightly negative. In Alberta, his rating is only narrowly positive.
Poilievre’s profile is almost the reverse.
He has strongly positive ratings in Alberta and Saskatchewan and Manitoba, but negative ratings in British Columbia, Ontario, Quebec and Atlantic Canada. His net impression is negative 26 among Canadians aged 60 and over and negative 15 among rural Canadians.
Poilievre remains highly popular with Conservative supporters, but his challenge continues to be expanding his appeal beyond the Conservative coalition.
Canadian Public Affairs Update · July 2026
Party Leader Impressions: Carney +17, Poilievre −6, Lewis −12
n=1,910 Canadians · July 23–29, 2026 · MoE ±2.24%
Overall
Carney by Subgroup
Poilievre by Subgroup
Methodology
Do you have a positive or negative impression of the following people?
Net Impression — July 2026
Mark Carney
Liberal
+17
net impression
Pierre Poilievre
Conservative
−6
net impression
Avi Lewis
NDP
−12
net impression
Mark Carney remains the only federal leader with a net positive impression (+17). Pierre Poilievre sits at −6, while new NDP leader Avi Lewis is at −12 — with 27% of Canadians saying they don’t know enough about him to say.
Impression Breakdown
Positive
Neutral
Negative
Don’t know enough to say
LeaderPositiveNeutralNegativeDon’t KnowNet
Mark Carney49%17%32%3%+17Pierre Poilievre37%15%43%4%−6Avi Lewis16%30%28%27%−12
Do you have a positive or negative impression of Mark Carney?
Carney’s net impression is positive in every region except Saskatchewan/Manitoba (−4). He is strongest in Quebec (+31), among Canadians 60 and over (+33), and overwhelmingly positive among 2025 Liberal voters (+73), while deeply negative among 2025 Conservative voters (−42).
Net Impression by Subgroup — Mark Carney
Net positiveNet negative
Region
Gender
Age
Household income
Community
2025 Vote
Do you have a positive or negative impression of Pierre Poilievre?
Poilievre is net positive only in Alberta (+19) and Saskatchewan/Manitoba (+11). He holds a strong +65 among 2025 Conservative voters but is deeply negative among Liberal (−56), NDP (−47), and Bloc (−39) voters, and sits at −26 among Canadians 60 and over.
Net Impression by Subgroup — Pierre Poilievre
Net positiveNet negative
Region
Gender
Age
Household income
Community
2025 Vote
Methodology
The survey was conducted with 1,910 Canadians from July 23 to 29, 2026.
A random sample of panelists were invited to complete the survey from a set of partner panels based on the PureSpectrum platform. These partners are typically double opt-in survey panels, blended to manage out potential skews in the data from a single source.
The margin of error for a comparable probability-based random sample of the same size is plus or minus 2.24 percentage points, 19 times out of 20.
The data were weighted according to census data to ensure that the sample matched Canada’s population. Totals may not add up to 100 due to rounding.
All research conducted by Abacus Data is based on responses from real human participants recruited through verified, double opt-in panel partners. No synthetic, simulated, or AI-generated responses are used at any stage. All research complies with CRIC Public Opinion Research Standards and Disclosure Requirements.
This survey was paid for by Abacus Data.
Abacus Data · Canadian Public Affairs Update · July 29, 2026 · n=1,910 · MoE ±2.24%
abacusdata.ca
Trump Moves Back to the Centre of the Public Agenda
The rising cost of living remains the dominant issue facing the country, selected by 65% of Canadians as one of their top three priorities.
No other issue comes close.
But Donald Trump and his administration have moved into second place again.
Thirty-seven percent now identify Trump as a top-three concern, an increase of six points since the previous wave.
The economy is selected by 36%, housing affordability and accessibility by 35% and healthcare by 33%.
Immigration follows at 23%.
Climate change and the environment are selected by 18%, an increase of three points over two weeks. Crime and public safety are selected by 16%, inequality and poverty by 11%, and job security and unemployment by 11%.
The most important movement is therefore not away from affordability. The cost of living remains dominant and has increased another point.
Instead, the change is in what comes immediately behind it and informing how people think about it.
Trump has moved from fifth place to second. Housing has also increased, while climate change has become more salient as wildfires have spread and affected communities across the country.
Job security and unemployment, meanwhile, declined five points. Inequality and poverty declined three.
This produces a public agenda shaped by three different forms of insecurity.
The first is household economic insecurity: the cost of living, housing and the economy.
The second is external economic and political insecurity: Donald Trump and the future of Canada’s trading relationship with the United States.
The third is environmental insecurity: wildfires, smoke and the broader consequences of climate change.
Voters Concerned About Trump and Climate Change Are Overwhelmingly Liberal
The relationship between issue priorities and vote choice makes the political significance of the changing agenda even clearer.
Among Canadians who identify Donald Trump and his administration as a top-three issue, 54% would vote Liberal and 24% would vote Conservative.
Among those concerned about climate change and the environment, 61% would vote Liberal and only 14% would vote Conservative.
The Liberals also lead among those who prioritize housing, healthcare, job security, inequality and poverty, international threats, and artificial intelligence.
The Conservatives lead among those who prioritize the economy, immigration and crime.
Among cost-of-living voters, however, the contest is almost evenly divided: 41% would vote Conservative and 40% Liberal.
The National Mood Is Divided, but Canada Is Viewed Far More Positively Than the World Around It
Forty-two percent of Canadians believe the country is heading in the right direction, while an equal 42% think it is on the wrong track.
Views of the wider world are far more negative.
Only 13% believe the world is heading in the right direction, while 75% say it is on the wrong track.
Just 12% feel positive about the direction of the United States, while 80% say it is on the wrong track.
The gap between perceptions of Canada and the rest of the world is now 30 points.
This is one of the largest optimism gaps we have measured. Canadians are not overwhelmingly satisfied with the direction of their own country, but they see Canada as more stable, secure and well-governed than the world around it.
Canadian Public Affairs Update · July 2026
Direction of the Country: Canadians Split 42 to 42 on Canada, Far Gloomier on the World & USA
n=1,910 Canadians · July 23–29, 2026 · MoE ±2.24%
Overall
Who Is Optimistic?
Methodology
Generally speaking, do you think things are headed in the right direction or are they off on the wrong track?
Direction of the Country, July 2026
The World
13%
right direction
The USA
12%
right direction
Canadians are evenly split on the direction of their own country: 42% right direction, 42% wrong track. They are far more pessimistic about the world (13% right direction, 75% wrong track) and the USA (12% right direction, 80% wrong track).
Right Direction vs. Wrong Track
Right direction
Wrong track
Unsure / not stated
Right DirectionWrong TrackUnsure / Not Stated
Canada42%42%16%The World13%75%12%The USA12%80%8%
Unsure / not stated calculated as the remainder after right direction and wrong track responses.
Generally speaking, do you think things are headed in the right direction or are they off on the wrong track? (% saying Canada is headed in the right direction)
Optimism about Canada’s direction peaks among 2025 Liberal voters (62%) and Canadians 60 and over (50%). It is lowest among 2025 Conservative voters (25%), NDP voters (31%), and those aged 30 to 44 (35%). Ontario (45%) and B.C. (44%) are the most optimistic regions.
Who Is Optimistic About the Direction of the Country?
Region
Gender
Age
Household income
Community
2025 Vote
Methodology
The survey was conducted with 1,910 Canadians from July 23 to 29, 2026.
A random sample of panelists were invited to complete the survey from a set of partner panels based on the PureSpectrum platform. These partners are typically double opt-in survey panels, blended to manage out potential skews in the data from a single source.
The margin of error for a comparable probability-based random sample of the same size is plus or minus 2.24 percentage points, 19 times out of 20.
The data were weighted according to census data to ensure that the sample matched Canada’s population. Totals may not add up to 100 due to rounding.
All research conducted by Abacus Data is based on responses from real human participants recruited through verified, double opt-in panel partners. No synthetic, simulated, or AI-generated responses are used at any stage. All research complies with CRIC Public Opinion Research Standards and Disclosure Requirements.
This survey was paid for by Abacus Data.
Abacus Data · Canadian Public Affairs Update · July 29, 2026 · n=1,910 · MoE ±2.24%
abacusdata.ca
The Liberal Voter Pool Remains Larger
Fifty-seven percent of Canadians say they would consider voting Liberal, compared with 48% who would consider voting Conservative and 32% who would consider voting NDP.
The Liberal accessible voter pool is largest in Ontario, where 61% would consider voting for the party. It is 59% in Quebec and 57% in British Columbia.
The Conservative pool reaches 54% in Ontario and 47% in British Columbia, but only 28% in Quebec.
The NDP’s accessible voter pool is 40% in both Ontario and British Columbia, but only 15% in Quebec.
The Liberals therefore continue to have more potential room to grow than either of their main opponents.
The Upshot
According to Abacus Data CEO David Coletto:
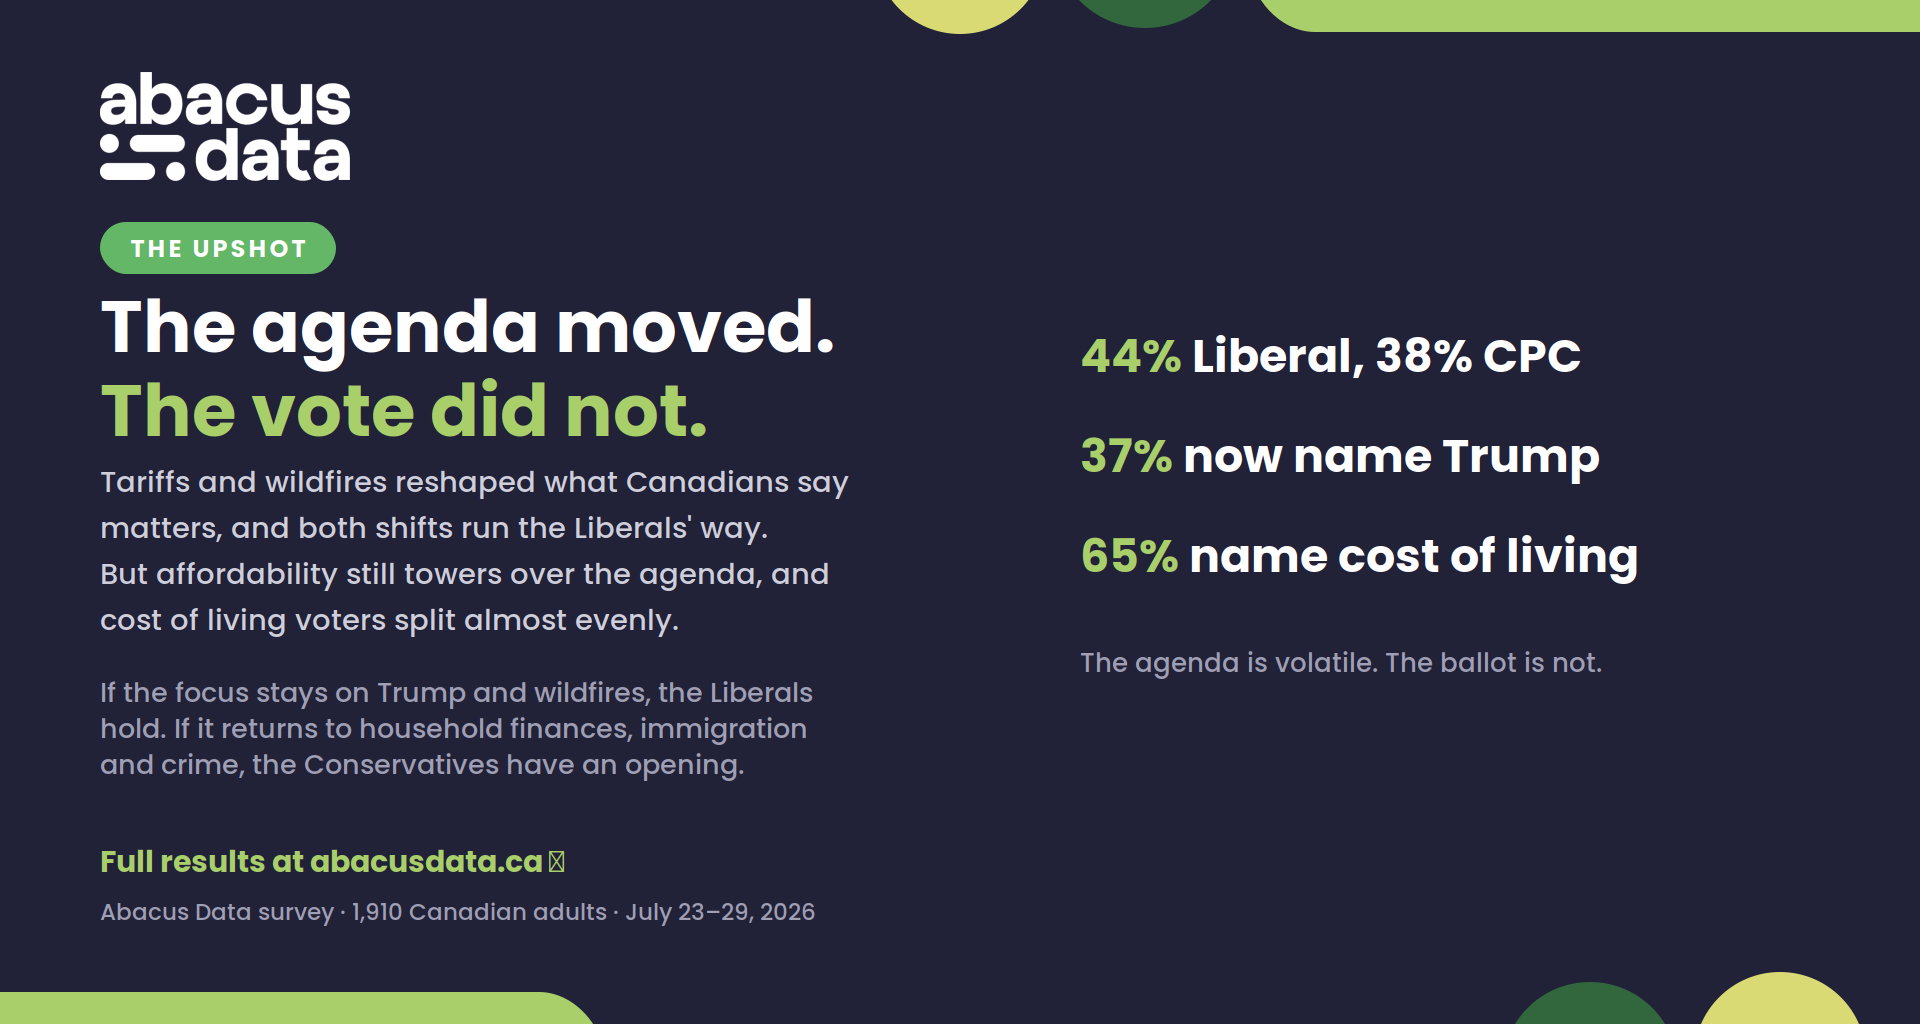
“The most important story in this poll is not that the Liberals continue to lead by six points. It is that the political agenda changed considerably while the vote numbers barely moved.
Three days before we began interviewing, Donald Trump announced additional 50% tariffs on a range of Canadian goods. As the survey opened, Mark Carney was meeting with premiers and territorial leaders to discuss Canada’s response. At the same time, wildfires were forcing evacuations, destroying communities and affecting air quality.
Canadians noticed.
Concern about Trump increased six points and is now the second most frequently selected issue facing the country. Concern about climate change and the environment increased three points.
Both shifts are politically favourable to the Liberals.
Among Canadians who identify Trump as a top concern, the Liberals lead the Conservatives by 30 points. Among those concerned about climate change, the Liberal lead is 47 points.
But the government should not interpret this poll as evidence that affordability has become less important.
The rising cost of living remains the dominant issue by a wide margin. The Conservatives continue to have an issue-ownership advantage on affordability and the economy, as well as large advantages on immigration and crime.
The most interesting finding may be that cost-of-living voters themselves are almost evenly divided between the Liberals and Conservatives. The Conservatives are seen as better able to handle the issue, but they have not converted that advantage into an overwhelming vote lead among the people most concerned about it.
For now, the Liberal coalition remains stronger.
This poll also demonstrates how sensitive the political environment remains to events.
If the focus stays on Trump, tariffs, wildfires and international instability, the Liberals are well positioned. If it moves back toward household finances, economic insecurity, immigration and crime, the Conservatives have a much clearer opening.
The vote numbers are stable but it seems the forces underneath them are not.”
Our Latest Work:
Methodology
The survey was conducted with 1,910 Canadian adults from July 23 to 29, 2026.
A random sample of panelists was invited to complete the survey through a set of partner panels based on the PureSpectrum platform. These partners are typically double opt-in survey panels, blended to help manage potential skews that can arise from relying on a single source.
The data were weighted according to census data to ensure the sample matched Canada’s population.
The margin of error for a comparable probability-based random sample of the same size is plus or minus 2.2 percentage points, 19 times out of 20.
Totals may not add to 100 because of rounding.
This survey was paid for by Abacus Data Inc.
About Abacus Data
We are Canada’s most sought-after, influential, and impactful polling and market research firm. We are hired by many of North America’s most respected and influential brands and organizations.
We use the latest technology, sound science, and deep experience to generate top-flight research-based advice to our clients. We offer global research capacity with a strong focus on customer service, attention to detail, and exceptional value.
And we are growing throughout all parts of Canada and the United States and have capacity for new clients who want high quality research insights with enlightened hospitality.
Our record speaks for itself: we were one of the most accurate pollsters conducting research during the 2025 Canadian election following up on our outstanding record in the 2021, 2019, 2015, and 2011 federal elections.
Contact us with any questions.
Find out more about how we can help your organization by downloading our corporate profile and service offering.