
Pathways to net-negative GHG emissions
Our findings show there are over 100,000 scenarios that could lead to net-negative GHG plastics based on the assumptions and variables examined herein. Scenarios were determined by running an algorithm for 11 million total combinations (see Methods for detailed assumptions). Note that this list of net-negative GHG emissions is not exhaustive in that only incremental changes of 10% are used for each variable. A maximum reduction of roughly −1.3 kg CO2e per kg plastic can be achieved using 100% renewable energy, 90% bio-based plastics, and 90% recycling. The results showed a mean value of −0.47 kg CO2e per kg plastic (standard deviation = 0.279), with a minimum of −1.36 kg CO2e per kg and a maximum of −0.1 kg CO2e per kg. There is notable flexibility among the required share of bio-based plastics, the fraction of renewable vs. non-renewable energy, and the type of waste management treatment that can be applied while still reaching net-negative GHG emissions on a global scale. Here, we focus on three scenarios that highlight the minimum amount of renewable energy, recycling, and bio-based plastics, that are required to reach net-negative emissions globally (highlighted in Fig. 1); a full list of these scenarios can be found in Supplementary Data 1, Sheet 8. We discuss these key thresholds to highlight the degree of flexibility for certain parameters such as waste management (which is noteworthy given the potential difficulty in achieving net-zero energy emissions, 90% recycling rate, and a fully bio-based plastic market simultaneously in a timely manner), as well as highlight areas of inflexibility (e.g., requiring a minimum of 70% renewable energy), to emphasize the need for a swift and significant change in the plastic industry.
Fig. 1: Summary of notable scenarios that lead to net-negative greenhouse gas (GHG) emissions for plastics on a per-kg plastic market basis.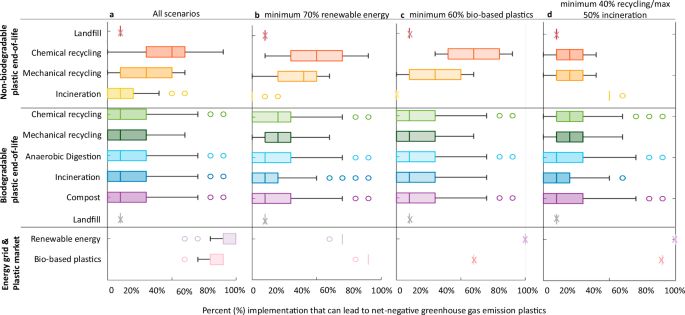
Box plots represent the probability (out of the total number of net-negative GHG emission scenarios) that a given level of implementation of the strategies on the y-axis will lead to net-negative GHG emissions for the plastic industry. Stars indicate single values (e.g., the landfill rate is held constant at 10% for all scenarios). Note that these scenarios are mutually exclusive and cannot be true at the same time. Each panel represents values for each variable that lead to net-negative GHG emissions when (a) all scenarios are considered (b) the minimum value of 70% renewable energy is used. Note: the outlier for 60% renewable energy reflects 4 scenarios (out of the 100,000) that result in net-negative emissions that require 90% recycling of all plastic and 90% bio-based plastics. (c) when the minimum value of 60% bio-based plastics is used, and (d) when a minimum of 40% recycling (mechanical + chemical) is used. Note that the outlier for a maximum of 60% incineration reflects a subset of 92 scenarios (out of 100,000) that result in net-negative GHG emissions when 100% renewable energy, 90% bio-based plastics, and a minimum of 80% recycling of biodegradable plastics is achieved. ‘Renewable Energy’ refers to the percent of the energy demand being sourced from renewable energy vs the 2018 global average electricity grid. ‘Bio-based plastics’ refers to the percent of the plastic market that is produced using bio-based resources instead of fossil feedstock.
Bio-based market share
We find that on average, 83% of the plastic market needs to be bio-based to offer lower than net-zero emissions. However, a minimum of 60% bio-based plastics can achieve net-negative GHG emissions on a global scale if 100% renewable energy and an 80% recycling rate of plastics is achieved. With more than 60% bio-based plastics on the market, there is more flexibility in the other factors. For example, if an 80% bio-based plastic market is achieved, a 60% recycling rate for non-biodegradable plastics could still lead to net-negative GHG emissions. This outcome is notable given that, despite bio-based plastics being around since the 1850s11, the growth in bio-based plastics has been slow, amounting to only 1% of the petroleum plastic market. This slow adoption suggests a growth in the bio-based plastic market will likely require pronounced policy mechanisms to drive adoption, such as incentives. Furthermore, there might be several limitations to full adoption of bio-based plastics. For example, some commodity plastics, such as polymethyl methacrylate (PMMA) and PVC, do not have commercialized, fully bio-based alternatives available yet12,13. While not limited by technology readiness, some bio-based plastics, such as PHB, are expensive to produce and utilize 1st generation feedstocks, or feedstocks that compete with food production14. Not requiring a full transition to bio-based resources is also notable from a resource availability perspective. Although we find that the current supply of biomass residues is sufficient to meet the demand for some bio-based plastics (see Supplementary Data 1, Sheet 5), a cumulative global shift towards a more bio-based economy is expected to put a strain on resources15, making it difficult to keep up with plastic demand. Finally, although novel technologies such as CO2 capture and utilization could be utilized as a method for bio-based plastic production, these technologies are not currently viable given factors such as their high cost and energy requirements16. Despite this flexibility, even achieving the minimum target of 60% bio-based plastics is going to require key actions from government and industry, such as implementing taxes on traditional fossil-based feedstocks and mandating minimum bio-based content requirements in new products.
Flexibility of energy grid
Out of all net-negative scenarios, the average renewable energy grid make-up was 93%. A high share of renewable energy is required given that some bio-based plastic production routes, such as PHB from biogas, require significant amounts of energy, and therefore do not necessarily provide a GHG benefit without the use of renewables17. However, a minimum of 70% renewable energy can achieve net-negative GHG emission plastics (assuming the rest is satisfied using the 2018 global average electricity grid) if: (1) a minimum recycling rate of 70%; and (2) a minimum of 80% bio-based plastics is achieved. This minimum threshold of 70% renewable energy is pertinent given the notable energy demand for the petrochemical industry (amounting to ~30% of global final industrial energy use, with plastics being its main product)18. Compounding this issue, a shift to bio-based plastics may also require high energy demands as a function of agricultural practices. For example, the Haber-Bosch process for ammonia production, which is required for the production of fertilizer, currently utilizes 2% of total energy consumption worldwide19. This notable energy demand is partly due to the high temperatures above 700°C and high pressures above 200 bar that are required for such processes20. Although some solar thermal technologies can reach temperatures requirements up to 2000 °C21, solar thermal energy currently only makes up a fraction of the 2.5% of global energy supplied by renewables22. Therefore, plastic production may continue to rely on the use of fossil fuels until the global capacity of renewable energy generation can meet the energy demands of the plastic sector and support cultivation of requisite biogenic feedstock resources.
Flexibility of waste management
On average, 37% of bio-based biodegradable plastics and 77% of bio-based non-biodegradable plastics, need to be recycled in order to reach net-negative emissions globally. It is important to note that even if all other strategies are incorporated, such as 100% renewable energy and fully bio-based plastic markets, we will still need to achieve a minimum of 40% recycling to reach net-negative GHG emission plastics while limiting landfill disposal to 10%. While thermomechanical recycling can be used as a method to effectively recycle thermoplastics, which make up ~85% of the plastic market23, the global average recycling rate is currently less than 10%24. This disparity highlights the need for drastic and immediate changes to waste management systems globally to allow net-negative GHG emissions to be achieved for plastics. Currently, the expense of thermomechanical recycling is unfavorable given the low cost of virgin materials, high cost of manual sorting, and the low-value or degraded performance characteristics of mechanically recycled plastics25. Further, the largest growth in plastic waste is expected to occur low-income countries (those with a gross national income of $1135 USD or less in 2024), many of which may not have the requisite waste management infrastructure. Another major roadblock for plastic recycling is contamination: without proper sorting, plastic waste streams are often contaminated with food waste as well as other materials, making it difficult to effectively recycle. While some new technologies such as chemical recycling can help streamline the waste treatment process by converting mixed plastic waste and contaminated plastics into valuable monomers26, there is a lack of social acceptance around these technologies outside of the scientific community27, and in some cases, a lack of established supply chains for low-impact solvents28. Therefore, policy efforts such as extended producer responsibility laws29,30, recycled-content targets31, or packaging taxes32, may be necessary to re-shape the global plastic waste management system33.
Although chemical recycling could help to address some of the issues associated with contaminated and mixed plastic waste streams, it can be an energy- and cost-intensive process, and the technical and economic feasibility of large-scale implementation still needs to be assessed34. In this work, we consider the impacts of chemical recycling based on a pyrolysis process for mixed plastic waste. However, we note pyrolysis might not be a viable end-of-life management option for some materials (such as PET or PVC), due to the generation of harmful thermal degradation products35, and modeling efforts to reflect other chemical recycling routes should be developed in future work.
For biodegradable bio-based plastics, anywhere from 0-90% of the material (assuming 10% is always landfilled or lost to the environment) can be treated with any end-of-life scenario (anaerobic digestion, compost, incineration, recycling, or landfill) and still allow for net-negative GHG emissions globally. The flexibility among biodegradable bio-based plastic waste management options is notable given the technological difficulty associated with bio-based plastic waste treatment as a result of (1) the lack of consumer awareness on proper disposal methods for biodegradable bio-based plastics36,37 and (2) the lack of adequate separation technology at organic recycling facilities needed to differentiate between biodegradable and non-biodegradable bio-based plastic38. For example, it has been argued that the implementation of biodegradable bio-based plastics is favorable for food packaging applications, due to the reduction in microplastic formation as a result of improper disposal (e.g., to the environment), compared to non-biodegradable plastics. Traditional mechanical recycling is not typically suitable for biodegradable bio-based plastics as it can result in significant reductions in material quality. On the other hand, end-of-life treatment options such as composting or anaerobic digestion may be ideal for biodegradable bio-based plastics used in food packaging as it can divert food waste from being landfilled, and reduce methane emissions from uncontrolled landfills39. For improved end-of-life management of biodegradable bio-based plastics, identification and separation steps need to be incorporated into commercial composting and anaerobic digestion facilities, and consistent, standardized labeling of bio-based plastics needs to be implemented to improve separation at the source.
Roadmap for creating carbon uptake in the plastics industry
While the previous sections highlight the minimum thresholds required for recycling, bio-based plastics, and renewable energy, here we provide a roadmap which leverages a combination of these solutions to achieve net-negative emissions by 2050. The combination of solutions presented for the short term (2030), medium term (2040) and long term (2050) were chosen based on TRLs, resource availability, and relevant policies (Fig. 2). TRLs are based on the United States Department of Agriculture definitions40, and resource availability data are from the Food and Agricultural Organization 2020 statistics41. For the near term (2030) scenario, only bio-based plastics with a TRL level of 9 are considered. The 2040 scenario considers bio-based plastics with TRL levels of 5 and above, which encompasses all of the bio-based plastics herein except for bio-PP as it is not considered feasible in the medium term due to resource constraints (see Table 1). While mechanical recycling, composting and anerobic digestion all have TRL levels of 9, we base their implementation on relevant policies (as described below). Similarly, given the lack of robust infrastructure for collecting, sorting and treating biodegradable plastics, full implementation of composting and anaerobic digestion for these materials is not considered feasible until the medium term (2040). The magnitude of emissions and uptake are calculated based on the assumption that plastic demand will continue to grow at an annual rate of 4% per year. While these strategies do not need to be implemented at this scale or in this order, this analysis suggests that pathways to net-uptake in the plastics industry are feasible within the coming decades.
Fig. 2: Roadmap for achieving net-negative greenhouse gas emission plastics by 2050, considering both production and end-of-life mitigation strategies.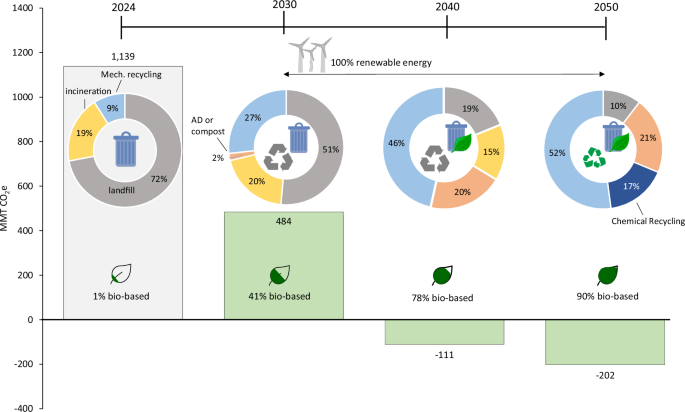
Technologies are implemented based on their technology readiness level and resource availability. Source data is available in Supplementary Data 1, Sheet 9.
Table 1 Quantity of bio-based resources in million metric tons (MMT) and total energy demand (in EJ) that would be needed to achieve the plastic production scenarios outlined in the roadmap
In the near term (e.g., by 2030), a 58% reduction in global GHG emissions compared to the current petroleum-based plastic sector could be achieved via: 41% substitution of petroleum-based plastic with bio-based plastics, 100% renewable energy, and 27% thermomechanical recycling. A 41% bio-based plastic market can be achieved by using PLA, TPS, Bio-PVC and Bio-PE, all of which have full-scale commercial production capabilities (see Supplementary Data 1, Sheet 6). Table 1 includes a summary of the quantity of biomass resources that would be utilized, as well as the total amount of energy required (in EJ) to meet the roadmap goals. In 2030, a 41% bio-based plastic market is feasible from a resource availability perspective, requiring 39% of available corn stover (e.g., corn stover not used as a soil amendment), 53% of available wheat straw, and roughly 8% of reclaimed potato starch produced globally (see Supplementary Data 1, Sheet 5). While the technologies and resources are available for this replacement rate, European Bioplastics42 predicts that global bio-based plastic production will only reach 6.3 MMT by 2027, roughly 25 times less than the ~165 MMT of bio-based plastic production required to reach this 2030 target. However, these projections are based on current market behavior. When looking strictly at technological availability, the European Technology platform for sustainable chemistry estimates that as much as 30% of the chemical industry in Europe could be sourced by renewables by 202543. These findings suggest the need for strong policy incentives and/or regulatory actions such as mandating a minimum bio-based carbon content for new products.
Other studies that have looked at decarbonizing the plastic sector, often consider carbon capture and utilization (CCU), which has a high energy demand44. In this study, we exclusively consider biomass-based production routes, which have the potential to reduce the energy demand compared to a fully fossil-based plastic market. In 2030, a 40% bio-based plastic market combined with a 27% recycling rate would require 9.48 EJ of energy, which is a 24% reduction compared to business-as-usual (assuming the average energy-demand for plastic production is 32 MJ per kg).
A thermomechanical recycling rate of 27% could be achieved assuming policy mechanisms are introduced to incentivize recycling and improve the sorting efficiency of plastic waste. This recycling rate aligns with goals on both regional and global scales; (1) in Europe, the plastic industry aims to increase recycling to 25–27% by 203045,46, (2) the United States Environmental Protection Agency (US EPA) is targeting a 50% recycling rate of all materials by 203047, and (3) the United Nations (UN) recently reported targets for a 20% recycling rate for short-lived plastics by 203048. In 2021, the US EPA introduced the National Recycling Strategy, which aims to improve markets for recycling, increase collection rates, reduce contamination in recycled streams, enhance policies to support circularity, standardize measurements and increase data collection49. In addition to supportive policies, further research and development efforts are needed to identify more efficient and cost-effective recycling strategies. For example, the BOTTLE consortium led by the United States Department of Energy investigates new plastic recycling technologies and bio-based plastic production routes at the lab-scale while simultaneously conducting techno-economic assessments and LCAs to concurrently assess the economic viability and environmental impacts of new processes50.
Globally, a carbon-negative plastics industry can be achieved in the mid-term (e.g., 2040) by increasing the bio-based plastic market share to nearly 80% and by limiting landfilling of all plastics to 20% (with the remainder of plastics going to recycling or composting and anaerobic digestion). This combination would result in −110 MMT of CO2e emissions/yr from the plastic industry in 2040 and a 36% reduction in energy demand compared to business-as-usual fossil-based plastic production. Bio-based plastics that are considered suitable for this midterm goal include Bio-PET, Bio-PTT, Bio-PP, PHB and Bio-PUR, (in addition to the bio-based plastics introduced in 2030) given their proximity to full-scale commercialization. Reaching an 80% bio-based plastic market by 2040 aligns with the United States’ goals to commercialize bio-based materials to substitute 90% of today’s plastics within 20 years51. Shifts towards a bio-based economy are also occurring outside the United States, with over 30 countries developing a national bioeconomy strategy52. This level of substitution would require slightly more corn stover and wheat straw than is currently available (111% and 112% respectively), as well as 9% of reclaimed potato starch, 12% of used cooking oil, and roughly 42% of global biomethane production (Table 1). It is important to note that the availability of feedstocks presented in Table 1 is based on 2022 global production values, and the quantity of these agricultural byproducts may increase in the future. For example, studies have projected that annual crop production will have to at least double by 2050 to meet increases in food demand53. A recycling rate of 46% by 2040 is in-line with estimates in the literature, such as the Ellen MacArthur Foundation, which calls for a 67% recycling rate by 204054, Plastics Europe, which targets a 46% recycling rate by 204055, and the UN, which estimates a 56% recycling rate by 204056. The Organization for Economic Co-operation and Development (OECD) modeled in their report on the future global outlook of plastics, that introducing a tax increase for plastic and plastic packaging (rising to 750$/tonne by 2060) would result in a recycling rate of 40%, which we identify herein as a necessary threshold57. A recent study found that four policies could help improve plastic waste management: (1) requiring 40% post-consumer recycled plastic in new products, (2) capping new plastic production levels to 2020 (547 MMT), (3) investing in the expansion of waste management infrastructure (especially in lower-income countries), and (4), implementing a small fee on plastic packaging58. In addition to these potential policies, investments in waste management infrastructure are also needed. To help expand waste management infrastructure, the US EPA is investing $275 million in solid waste infrastructure for recycling grants which supports projects related to recycling, composting as well as re-manufacturing facilities51,52,57,59.
Although net-negative GHG emissions are achieved in the midterm goal, this scenario still results in roughly 15% of plastics being incinerated, 20% being landfilled, and roughly 20% of plastics made from fossil-fuels. In the long-term (2050) scenario, to create a more circular economy, recycling (using renewable energy), alongside a maximum substitution of bio-based plastics (90%), can be employed to further reduce emissions. Maximizing the share of bio-based plastics in 2050 would include the substitution of bio-PP. In this study, we model the production of bio-PP from used vegetable oil which includes an inefficient hydrotreatment conversion process of used vegetable oil to bio-based naphtha. As a result, the quantity of used vegetable oil required would be roughly 174 times the current supply (Table 1). While this production process is common in industry, companies such as Borealis are in the process of expanding their production of bio-PP to meet higher demand60. Therefore, it is assumed that alternative and /or more efficient production routes will be available by 2050. Other production routes for bio-PP include (1) traditional fermentation of biomass feedstocks to bioethanol, dehydration to ethylene, subsequent transformation to butene via dimerization, and metathesis of ethylene and butene to form propylene monomer61. (2) Gasification of agricultural waste to generate bio-syngas, conversion to dimethyl ether and final conversion to propylene and ethylene62. (3) Gasification of biomass to produce syngas, conversion to methanol and subsequent conversion to dimethyl ether to produce propylene and other byproducts. Utilizing a combination of these different production routes can expand the types of biomass residues needed for bio-PP beyond vegetable oil (e.g., woody biomass, agricultural residues etc.). Although certain bio-based plastic production routes (such as PHB from bio-methane) have a high energy demand, on average bio-based plastics can offer a reduction in energy demand compared to fossil-based plastics. As a result, increasing the share of bio-based plastics (along with an increase in recycling rates), results in a 33% reduction in energy demand in the 2050 scenario versus the 2030 scenario, despite increases in plastic demand.
Given the technical readiness of thermomechanical recycling, this value is assumed to be maximized to treat up to 52% of plastic waste by 2050. This value reflects the estimated market share of non-biodegradable thermoplastics ( ~ 70%) in 2050 combined with a 75% assumed sorting efficiency. This long-term combination of mechanisms may help minimize adverse environmental impacts associated with landfilled plastics63, while simultaneously resulting in an annual carbon storage of ~270 MMT and a 50% reduction in energy demand compared to business-as-usual fossil-based plastic production. In addition, it helps to conserve resources and increase the availability of bio-based resources for other applications, which will be increasingly important as the global population grows to 10 billion in 2050, associated with significant increases in crop demand64. While it is difficult to make direct comparisons to previous literature due to differences in scope, these results align with findings from Meys et al.8, where it was found that a combination of 70% recycling, renewable energy, biomass feedstocks and CCU could lead to −30 MMT of CO2 annually.
Recent reports by the IPCC highlight the need for carbon dioxide removal strategies (CDR), on top of strict decarbonization efforts, to stay below a 2 °C global warming target. Namely, a maximum of roughly 1100 Gt of CDR is necessary65,66. Increasing the rate of chemical recycling, as seen in the 2050 scenario, would enable these bio-based plastics to act as a CDR strategy, with an annual carbon storage capacity of 270 MMT of CO2.
Note that the results presented in Fig. 2 are based on a 4% annual growth rate in plastic demand. Once net-negative GHG emissions are achieved, the growth in plastic demand is what drives greater magnitudes of carbon storage potential. Therefore, a sensitivity analysis was conducted to examine the resulting GHG emissions for these same scenarios under different growth rate assumptions (namely assuming no growth in plastic demand, a 2.5% annual growth rate, and an 8% annual growth rate). It is important to consider reductions in future plastic demand given the possible impact of various policies such as single-use plastic bans, packaging taxes, or minimum recycled contents, on the demand of virgin plastic production. Further, reducing the growth in plastic demand from 4% to 2% per year can result in a 56–81% reduction in GHG emissions compared to business-as-usual4. We found that, even if plastic demand does not increase in the future, negative emissions are still observed at a rate of −59 MMT and −94 MMT CO2e per year by 2040 and 2050, respectively (see full results in Supplemental Data Sheet 10). Therefore, although increases in plastic demand result in greater levels of CO2 reduction, an increase in demand is not necessary to achieve negative emissions. Further, while this study considers GHG emissions, there are various other factors such as land use and water consumption, that would likely increase with an increase in plastic demand. Therefore, future work should leverage the results of this study to determine scenarios in which these other environmental factors are also minimized. Another important limitation of this study is the simplified assumption that the magnitude and composition of plastic reaching end-of-life is the same as the amount and type of plastic being produced each year. Given that some plastics can have longer lifetimes (such as 35 years in the construction sector), the amount of plastic reaching end-of-life in a given year could be less than the amount produced. This simplified approach was used in this study to provide a conservative estimate for GHG emissions: under low recycling rate scenarios, the emissions from incineration provide a high-end estimate for plastic end-of-life impacts, while under high recycling-rate scenarios, the increase in plastic recycling reduces the amount of new carbon being stored in the materials, hence leading to lower overall carbon storage potential. Future work should expand upon this study by incorporating a material flow analysis to better model the temporal impacts of plastic production and disposal.
Following the targets for renewable energy, bio-based content, and waste managements highlighted in this roadmap, over 3 Gt of CO2e could be avoided in 2050 alone compared to a business-as-usual scenario (Fig. 3). Further, this pathway could shift the plastics industry from being 15% of the carbon budget to a CO2 removal strategy. Previous literature has reported the potential for low-carbon or net-negative GHG emission plastics. However, this study fills important research gaps left outside the scope of previous work by (1) incorporating the impacts of CH4 and N2O emissions associated with bio-based plastic production, (2) examining the utilization of non-edible bio-based feedstocks for plastic production rather than CO2 feedstocks or food products, and (3) incorporating technology readiness levels and resource availability to provide a timeline of feasible mitigation strategies.
Fig. 3: Comparison of roadmap results from this study to future petroleum-based plastic life cycle emissions in a business-as-usual scenario.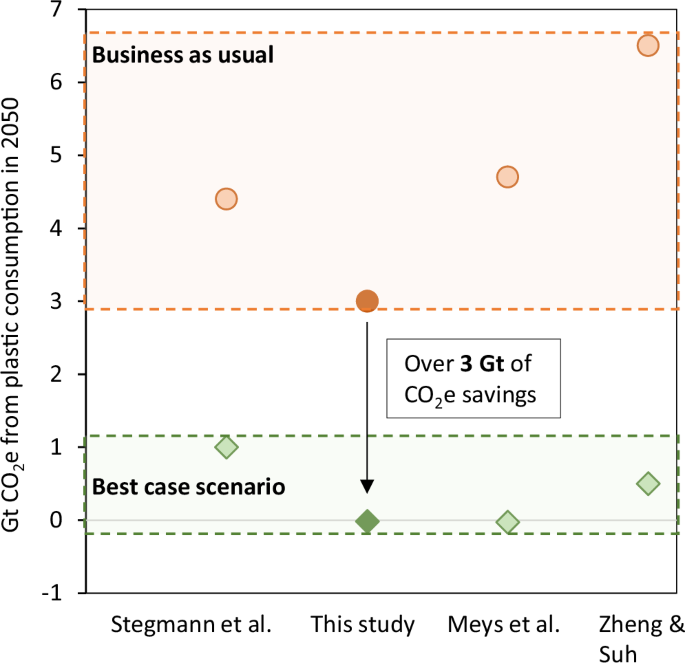
For this study, “Best case scenario” refers to a scenario in which 90% of the plastic market is bio-based, 90% of plastic is recycled, 10% is landfilled or lost to the environment, and 100% renewable energy is utilized. For the other studies, “Best case scenario” refers to the scenario that resulted in the lowest possible emissions. The shaded regions show the range of expected emissions under a business-as-usual approach (orange), and a best-case-scenario approach (green).