
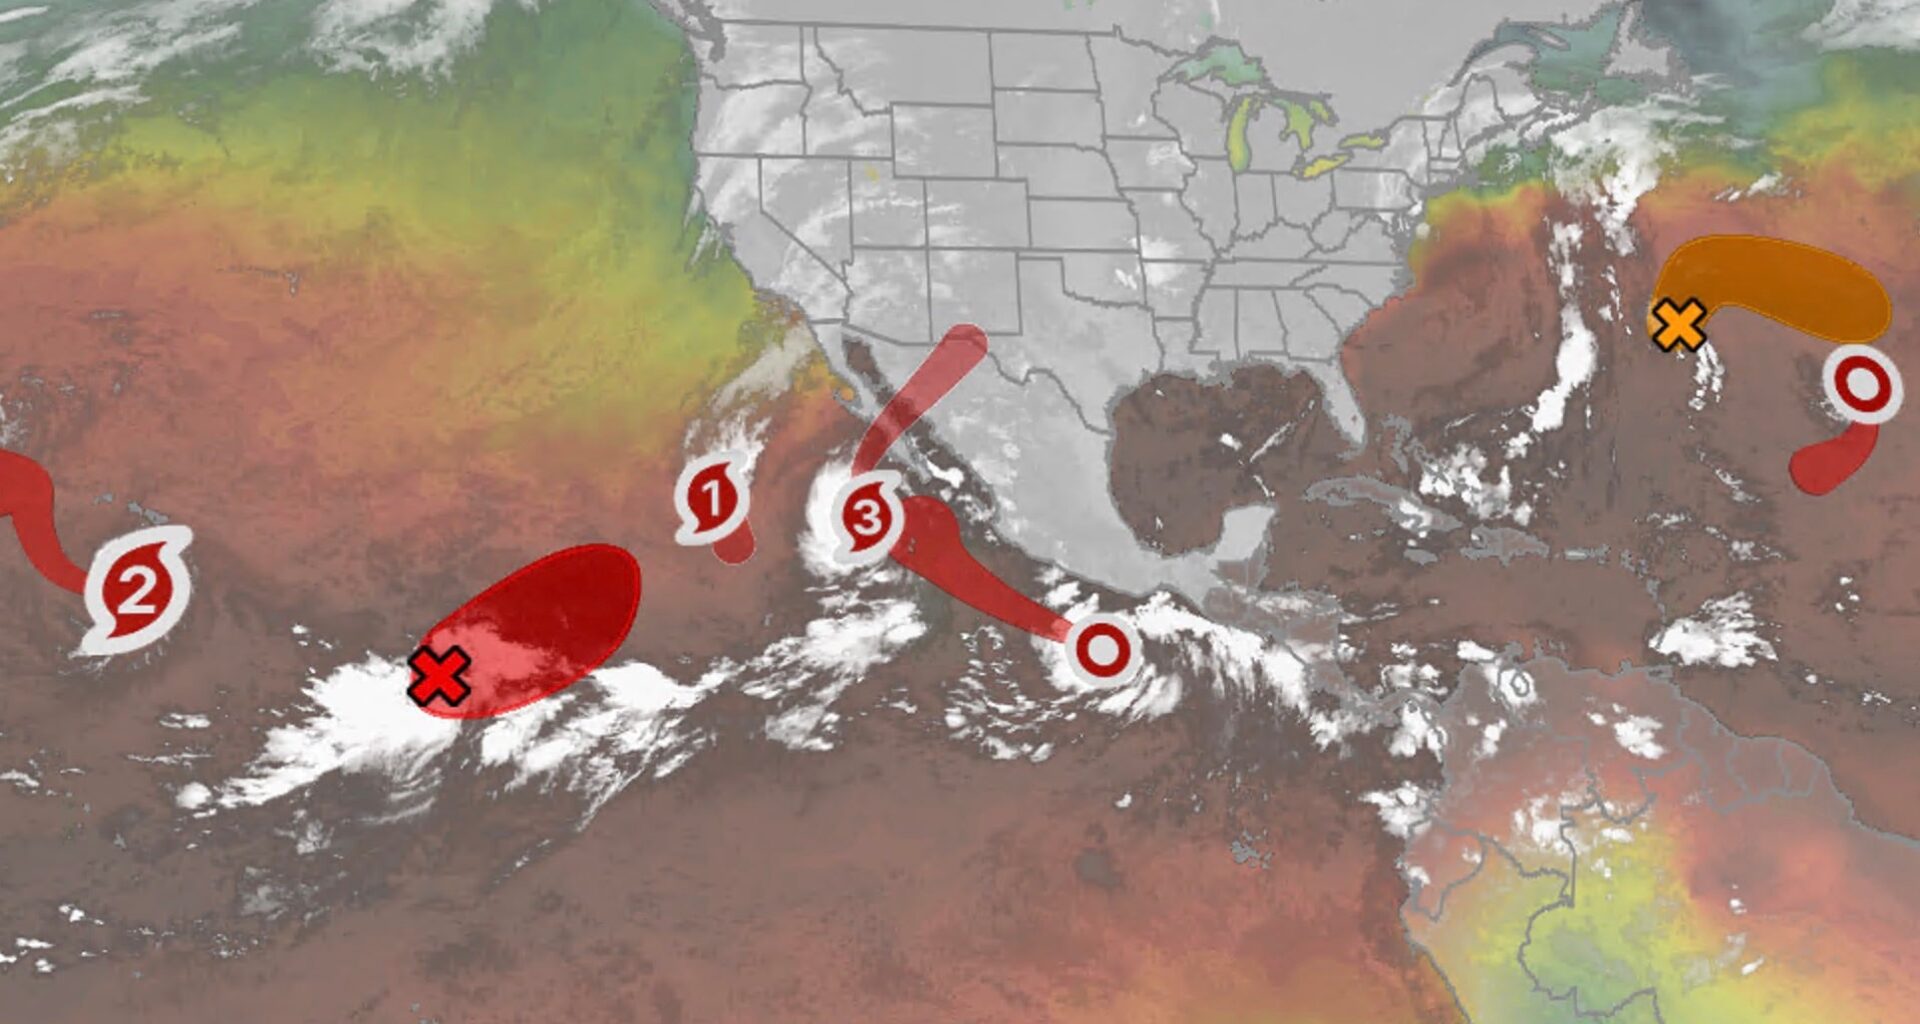
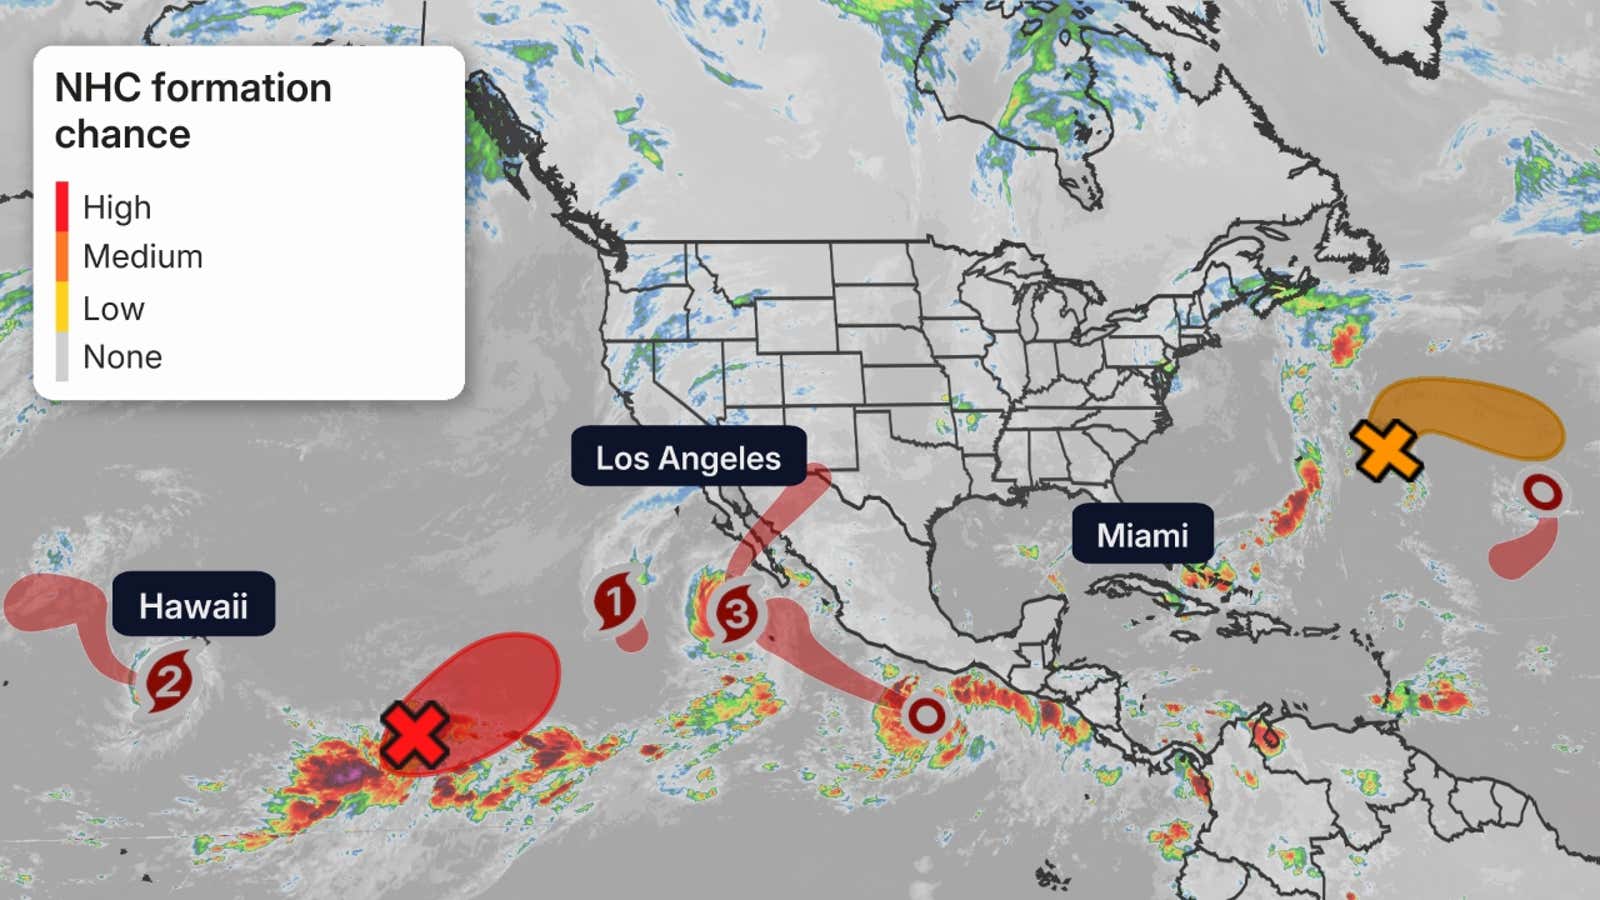
Hurricane season remains very active in the Pacific, with three hurricanes: Polo, Odalys, Nolo and Tropical Depression Eighteen-E. There is also another area in the Pacific that we are monitoring for development in the days ahead.
Activity is much lower in the Atlantic, where Fay is hanging on while fighting hostile conditions from an intensifying El Niño. There is also a new area of interest in the Atlantic.
We have the maps you need to track all these systems below, starting with the most active basin, the Central and Eastern Pacific.

Weather in your inbox
By signing up you agree to the Terms & Privacy Policy. Unsubscribe at any time.Tracking the Pacific
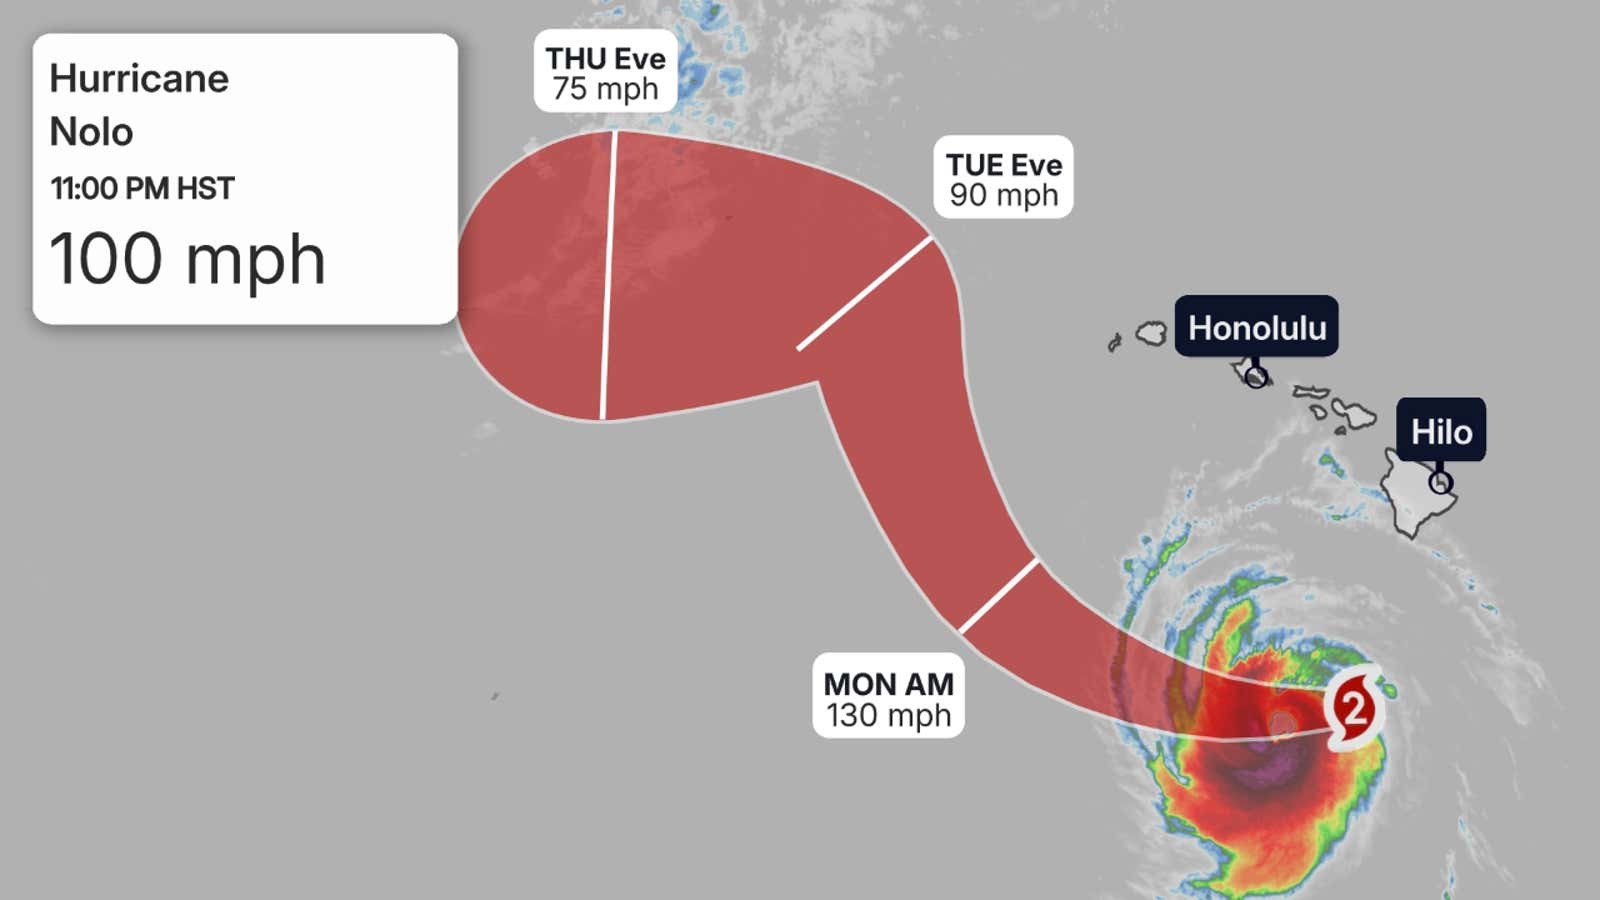
Hurricane Nolo
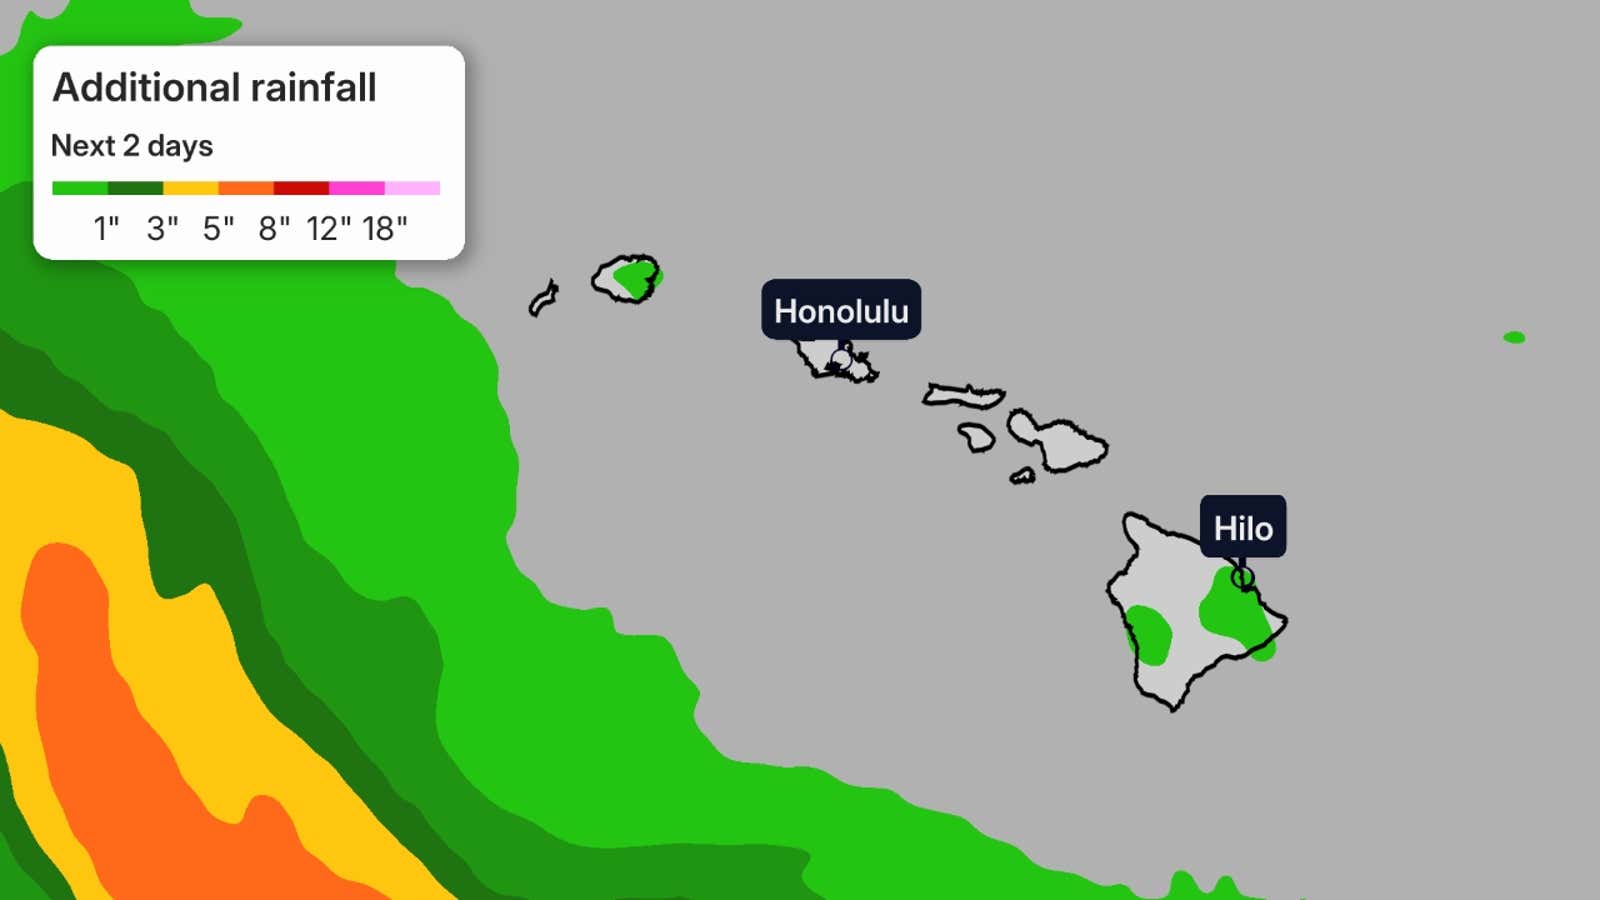
Nolo is passing south of Hawaii, but continuing to bring strong wind gusts, as well as a flooding and mudslide threat to parts of the island chain. We have a forecast in more detail here.
(MORE: Latest Hawaii hurricane forecast)
Get More of Our News on Google
Set The Weather Company as a ‘Preferred Source’ to get quicker access to the news you value.

Hawaii rainfall forecast
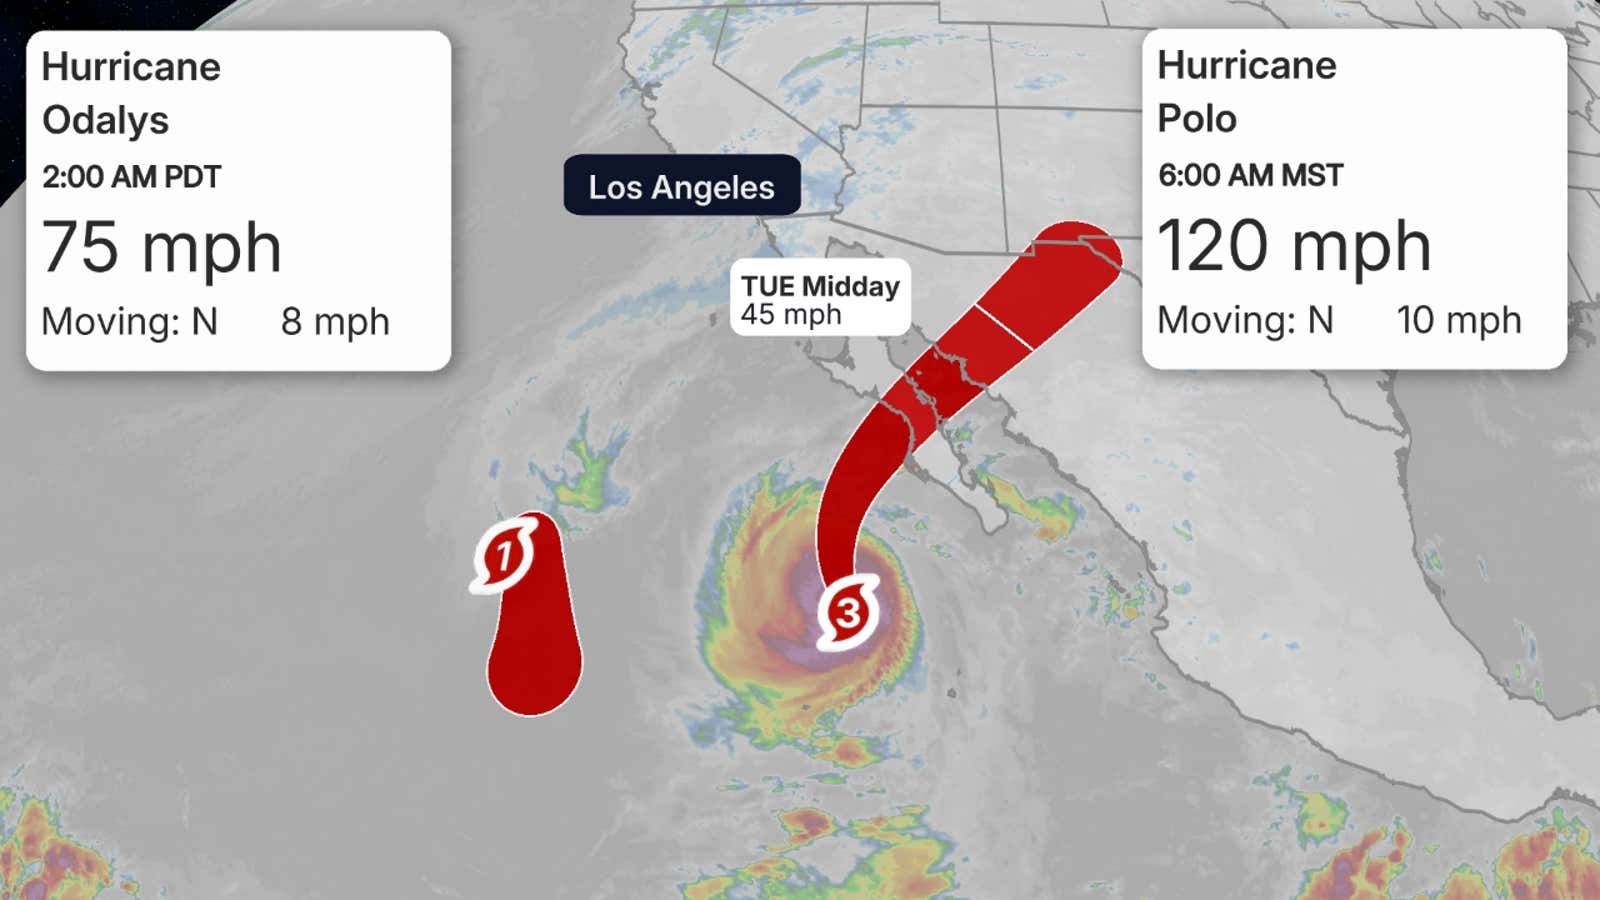
Odalys and Polo forecasts
Polo once again became a 180 mph Category 5 hurricane on Thursday and remains an intense hurricane.
While it is now a Category 3 hurricane, it is expected to curl to the northeast and slam into Mexico’s Baja California as a hurricane on Monday with damaging winds, flooding rainfall and storm surge.
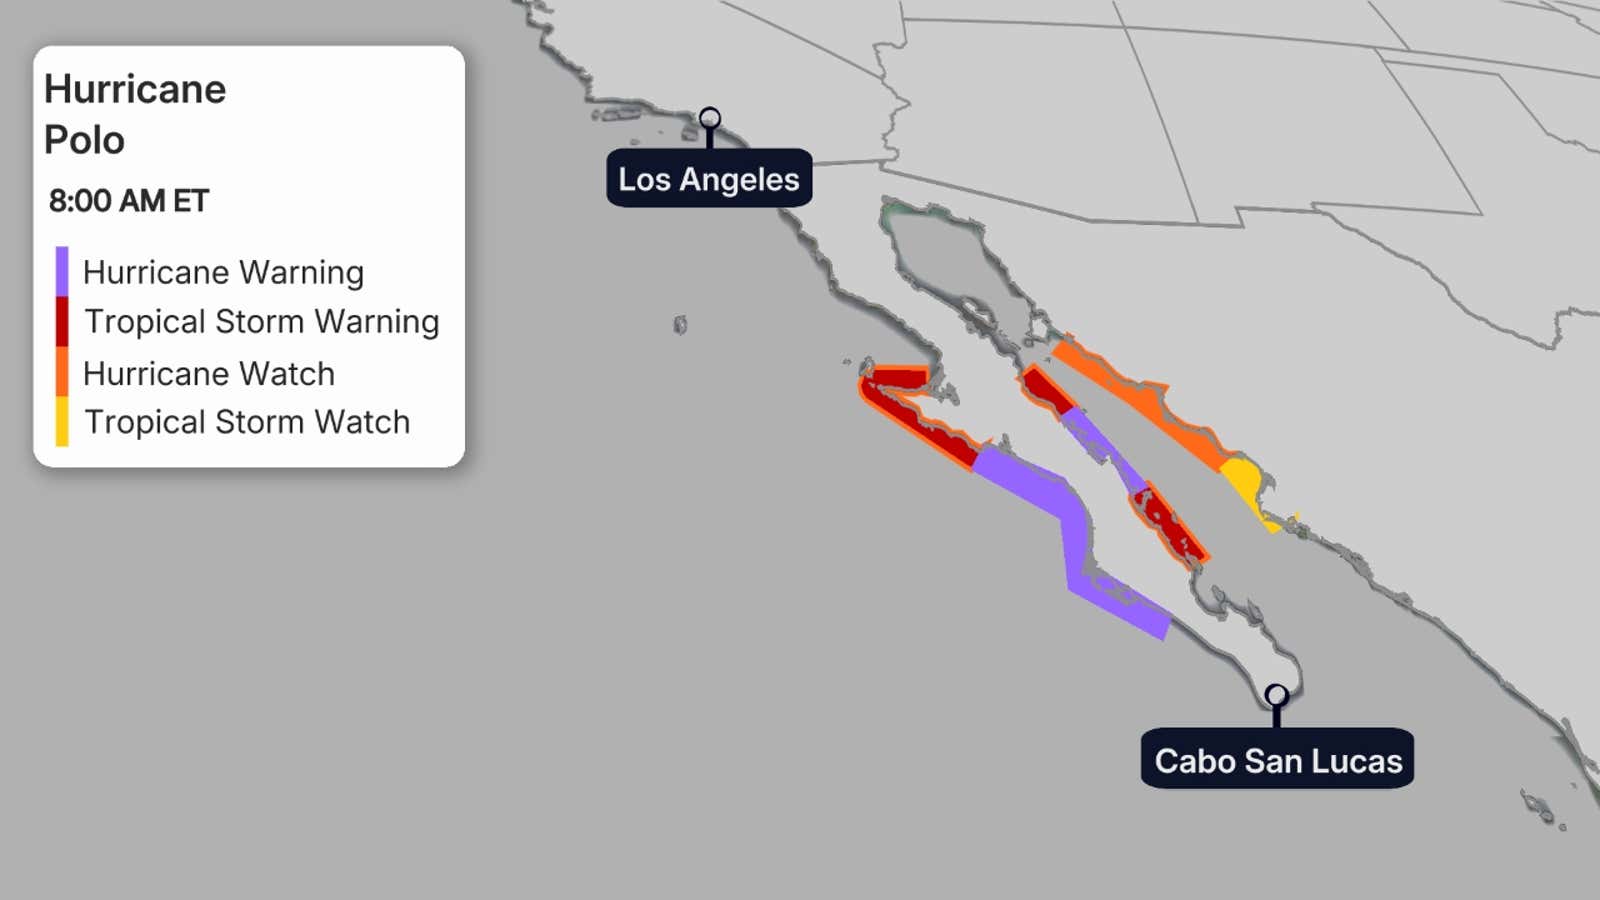
Hurricane alerts are in effect for parts of the Pacific coast of the Baja Peninsula north of Los Cabos.
The forecast track and latest information on Odalys is also shown in the map below. Odalys is not expected to threaten land directly.
Some moisture from both Odalys and Polo is forecast to be drawn into the Southwest U.S., fueling thunderstorms with locally flooding rain from Monday into mid-week.
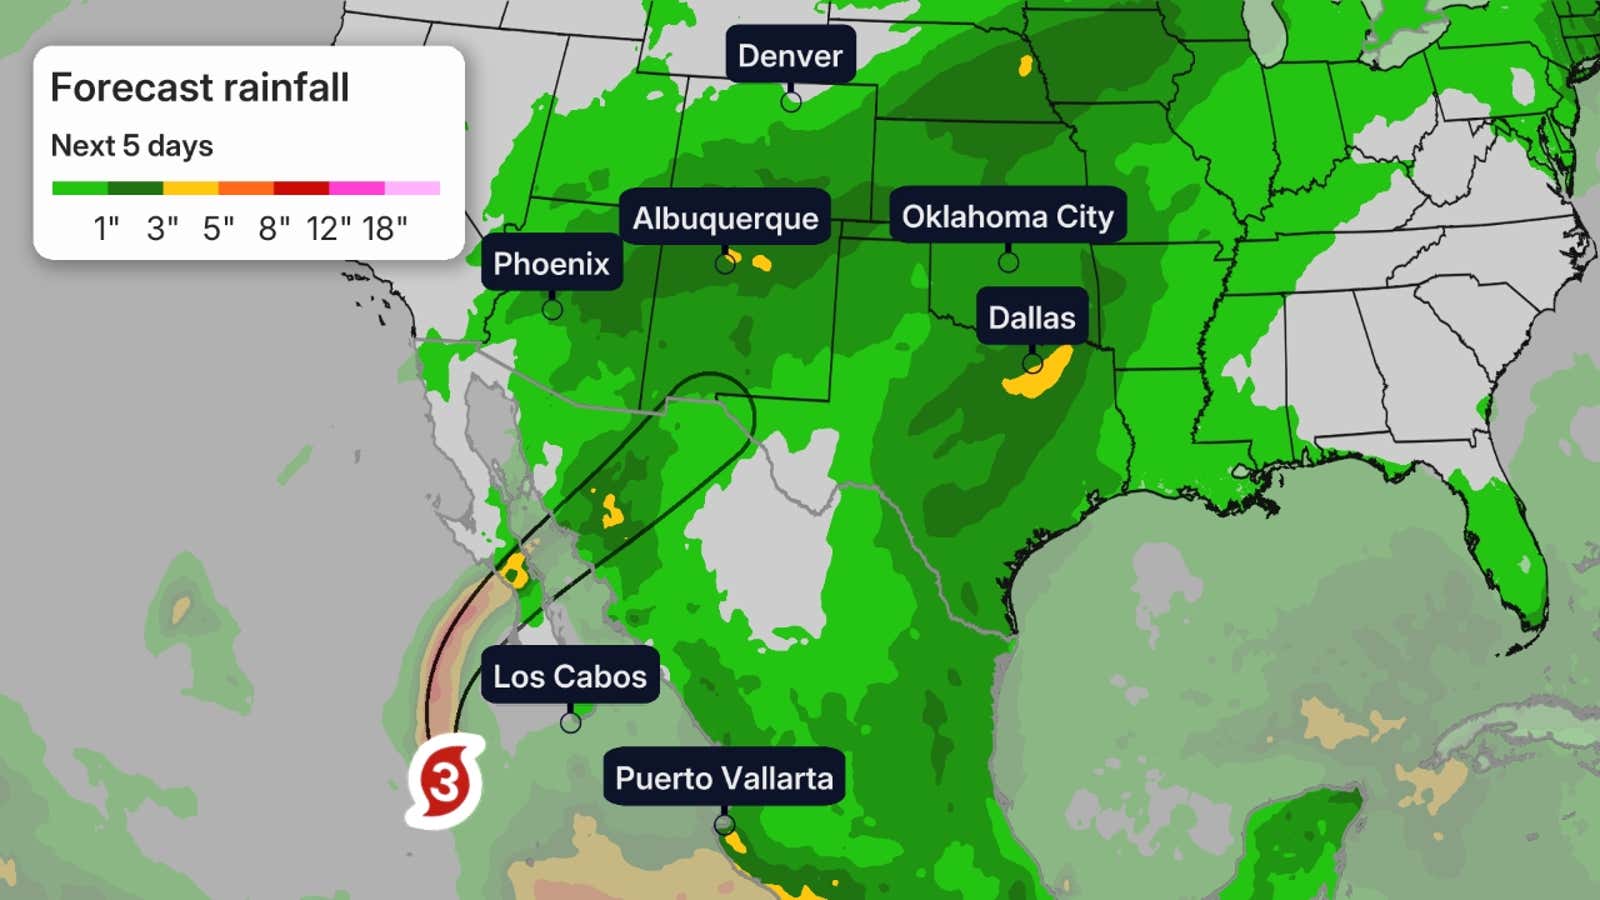
Rainfall forecast
The map below shows where the heaviest rain from Polo may fall over the next five days in Mexico, along with the latest National Hurricane Center forecast cone in black.
This forecast is subject to change with any subtle forecast shifts of the track of Polo.
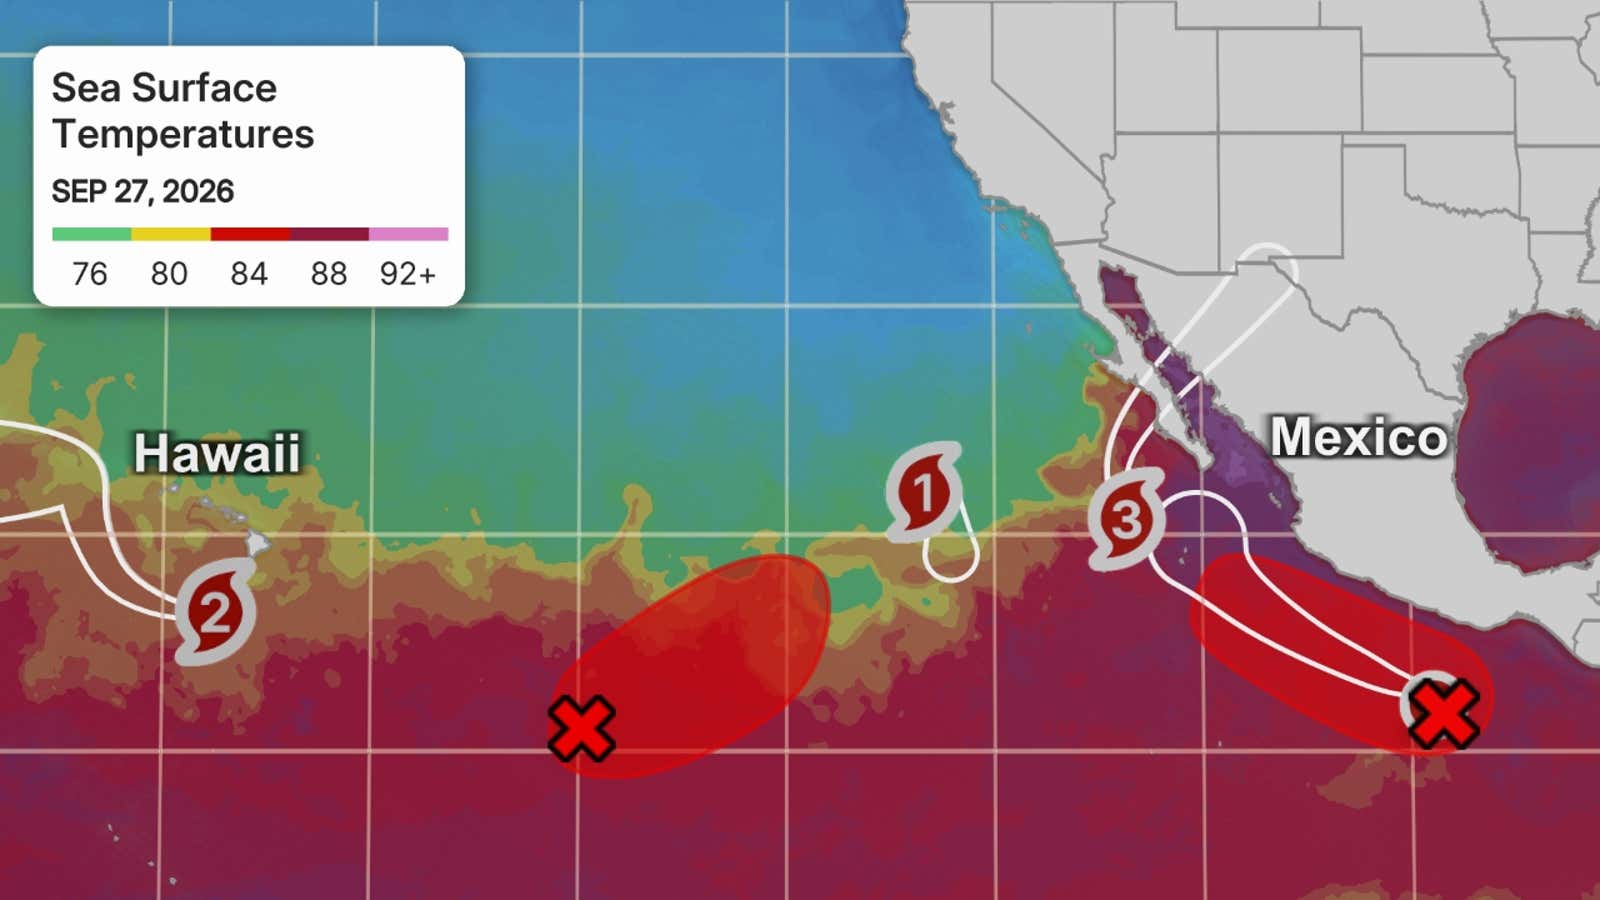
Sea surface temperatures
Along with ocean temperatures, this map also shows another area the National Hurricane Center is monitoring for possible tropical development.
The next two Eastern Pacific tropical storms will be named “Rachel” and “Simon”.
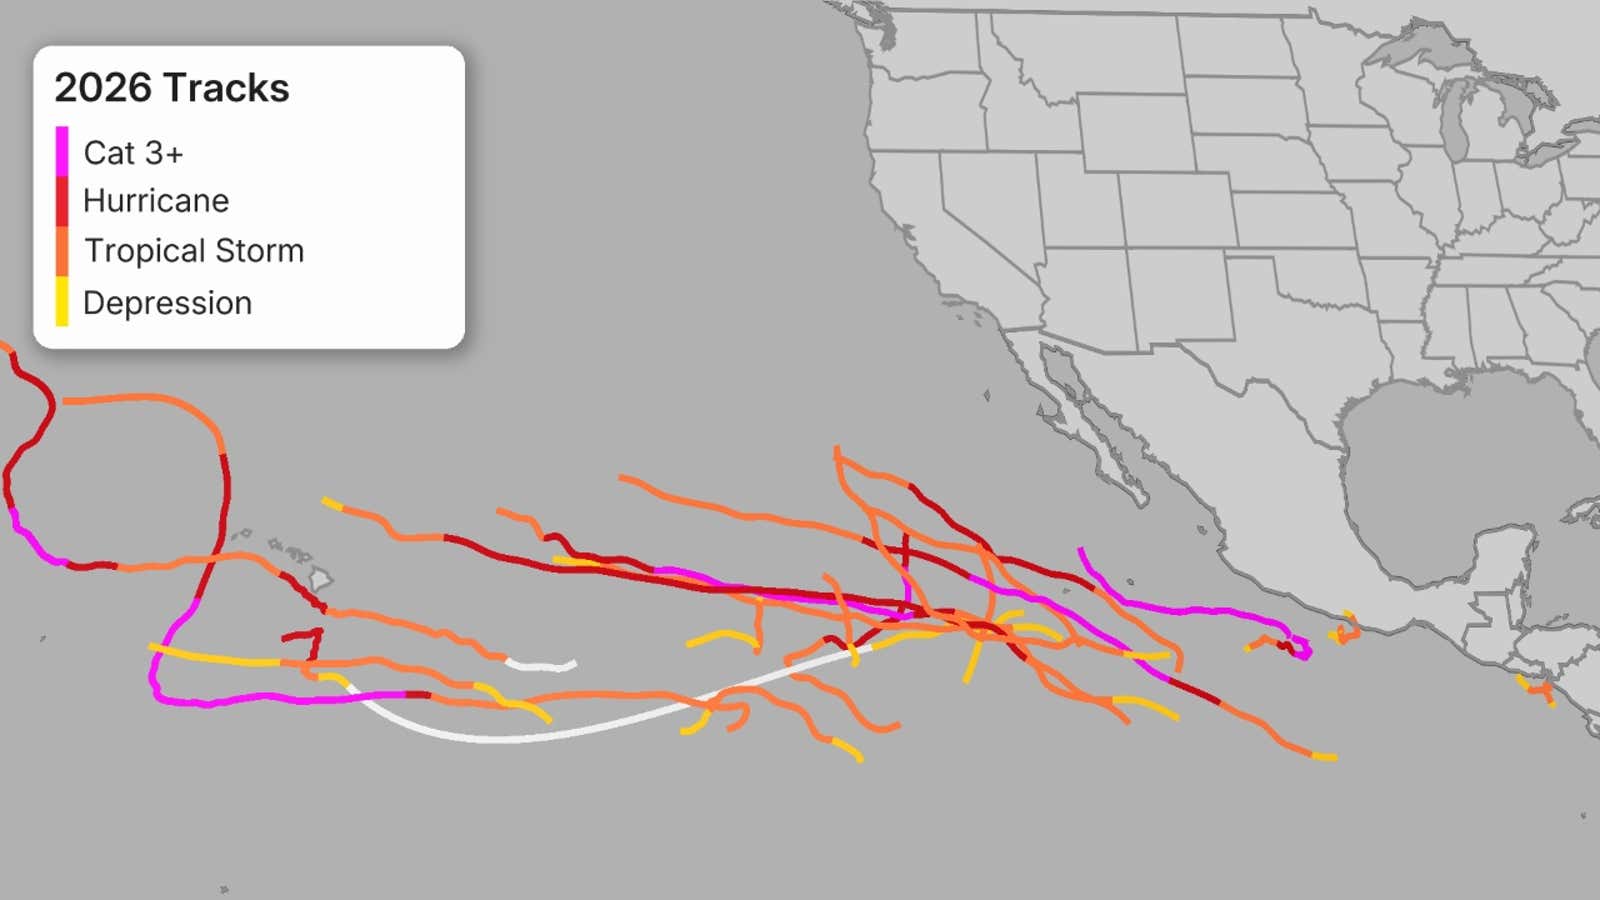
Pacific tracks so far this season
 Tracking the Atlantic
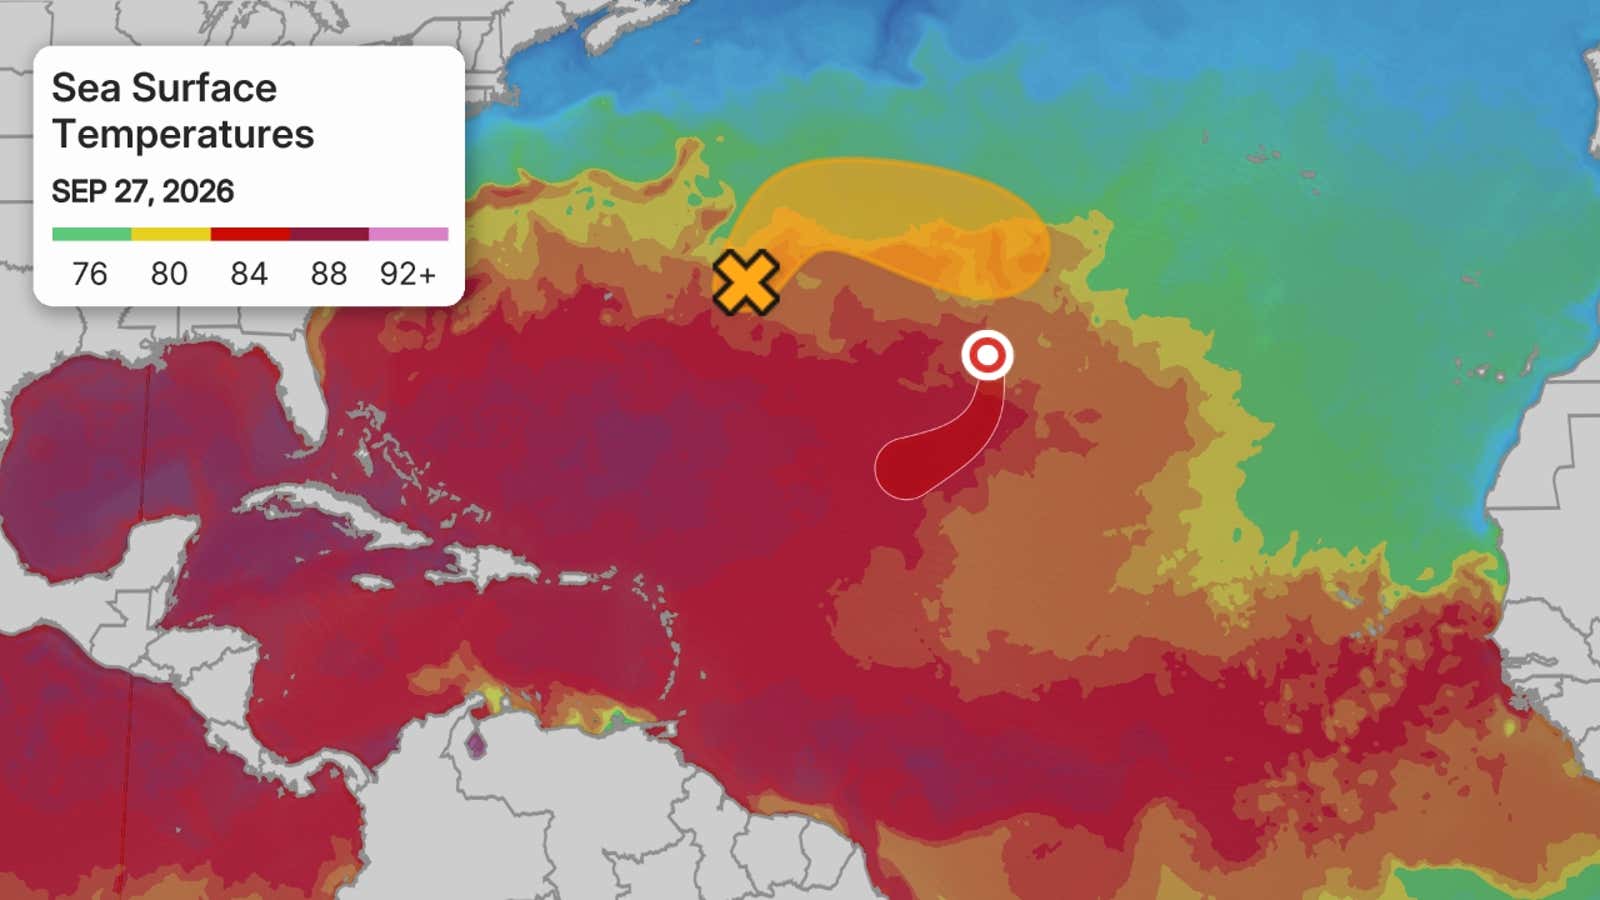
Sea surface temperatures
Fay, back to a tropical depression, may stubbornly hold on far from land over the central Atlantic Ocean.
You can see the active system on the sea surface temperatures map below.
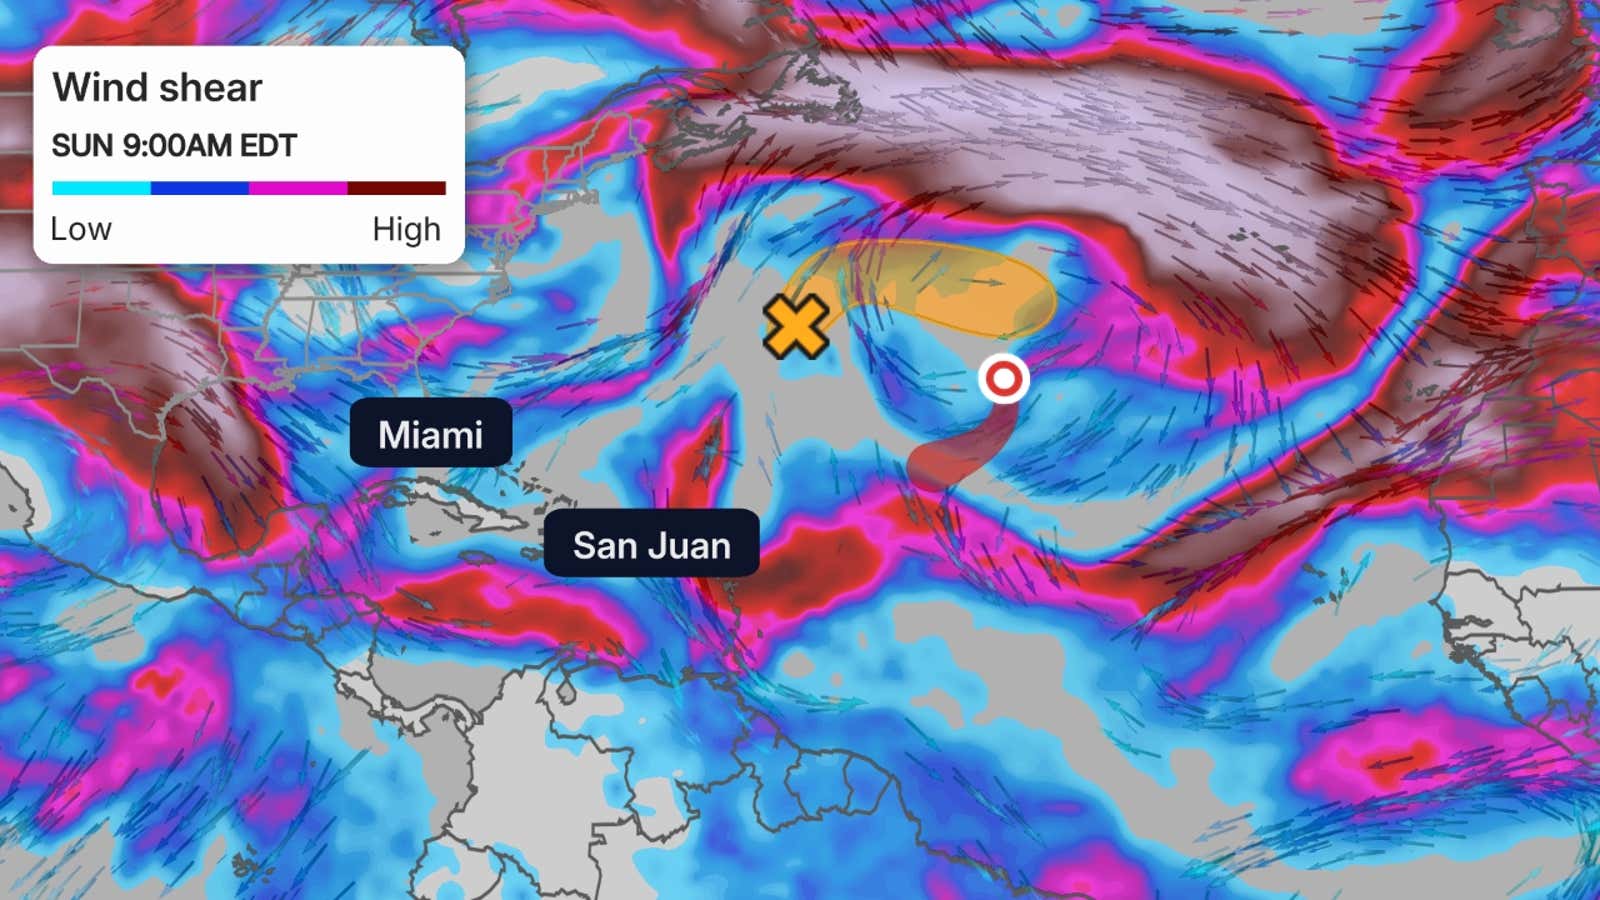
Wind shear
These are areas of strong wind shear, the difference in wind speed and direction with height, which are shown in purple. High wind shear is hostile to mature tropical cyclones and those trying to develop.
(MORE: What is wind shear)
Dry, dusty air
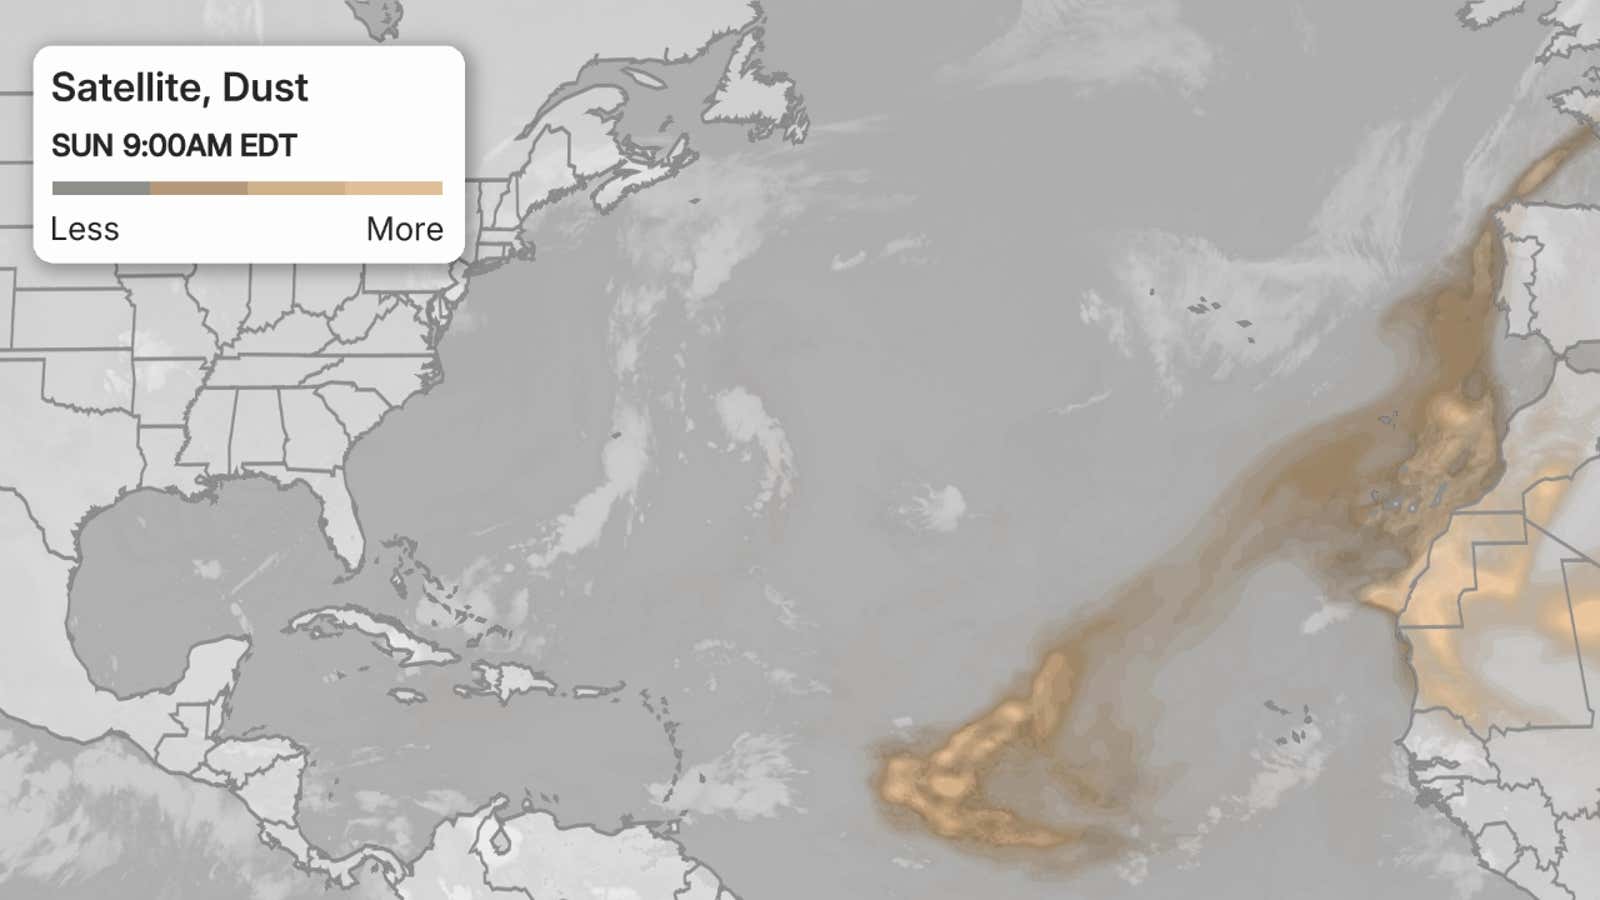
Another nemesis of tropical systems is dry air.
In hurricane season, plumes of dust-laden air stream across the basin from Africa’s Sahara Desert, as you can see in the map below. This sinking, dry air squelches thunderstorm development, the building blocks of tropical storms and hurricanes.
So areas in the brown shading below are generally unfavorable for development.
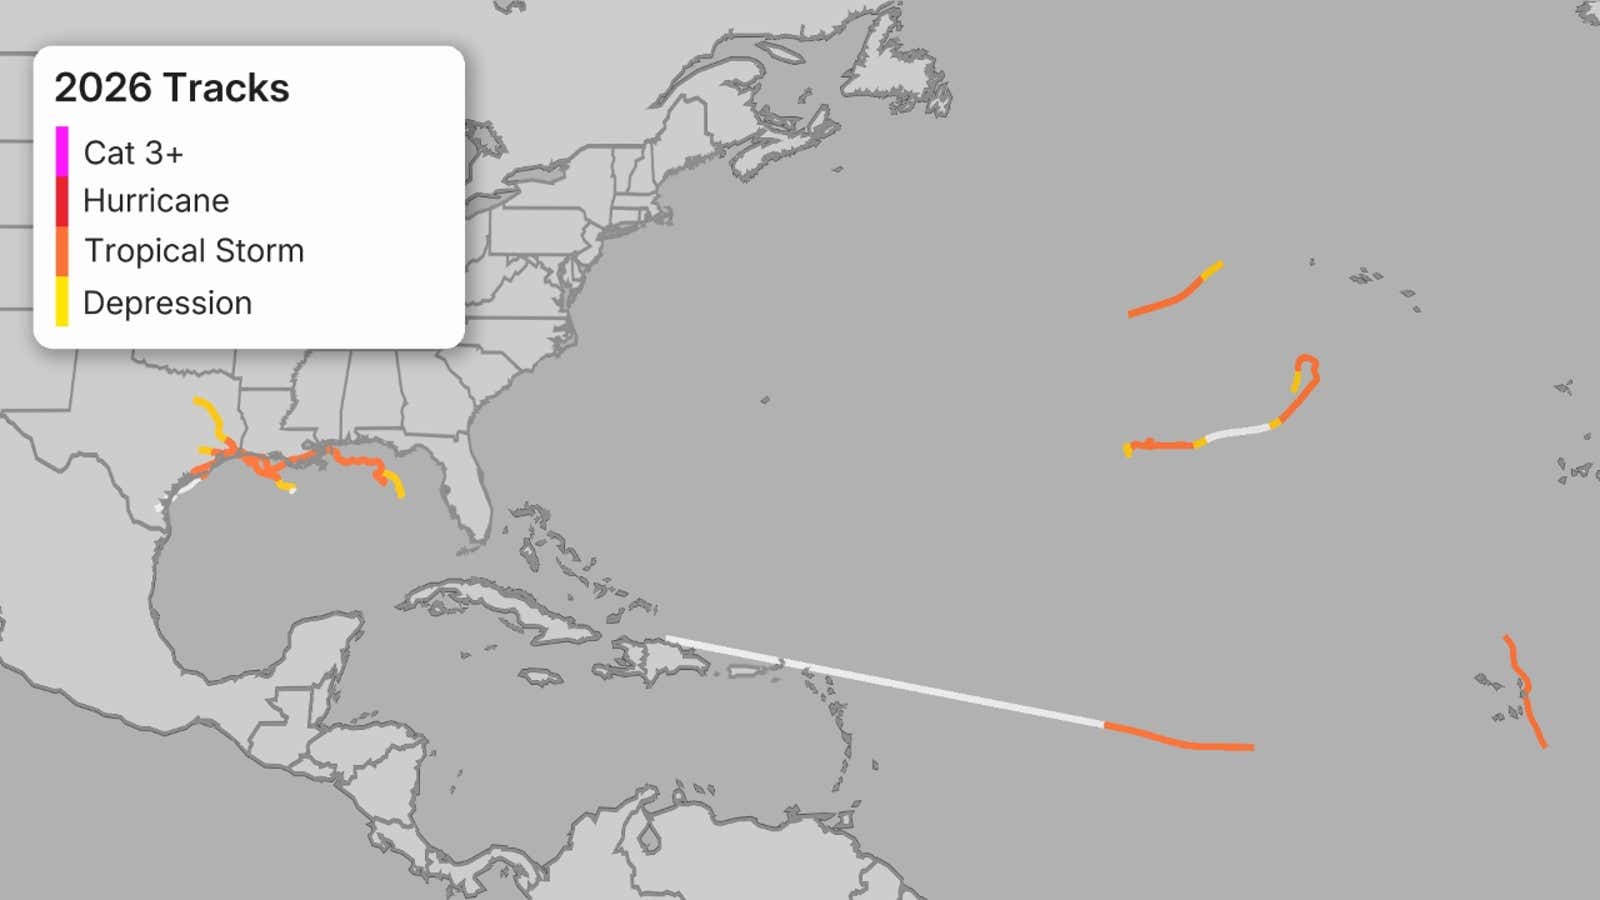
Atlantic tracks so far this season
These are the tracks of systems that were at least tropical or subtropical storms, so far in the Atlantic Basin.
 Season activity compared to average
Accumulated Cyclone Energy, or ACE, is a metric that measures the total energy produced by tropical storms and hurricanes over a given period, accounting for both how strong they were and how long they lasted.
It’s another measure meteorologists use to gauge how active a hurricane season has been.
As you can see below, it has been a historically quiet Atlantic season while the Pacific, especially the Eastern Pacific, has been much more active than usual.
(MORE: Complete El Niño coverage)
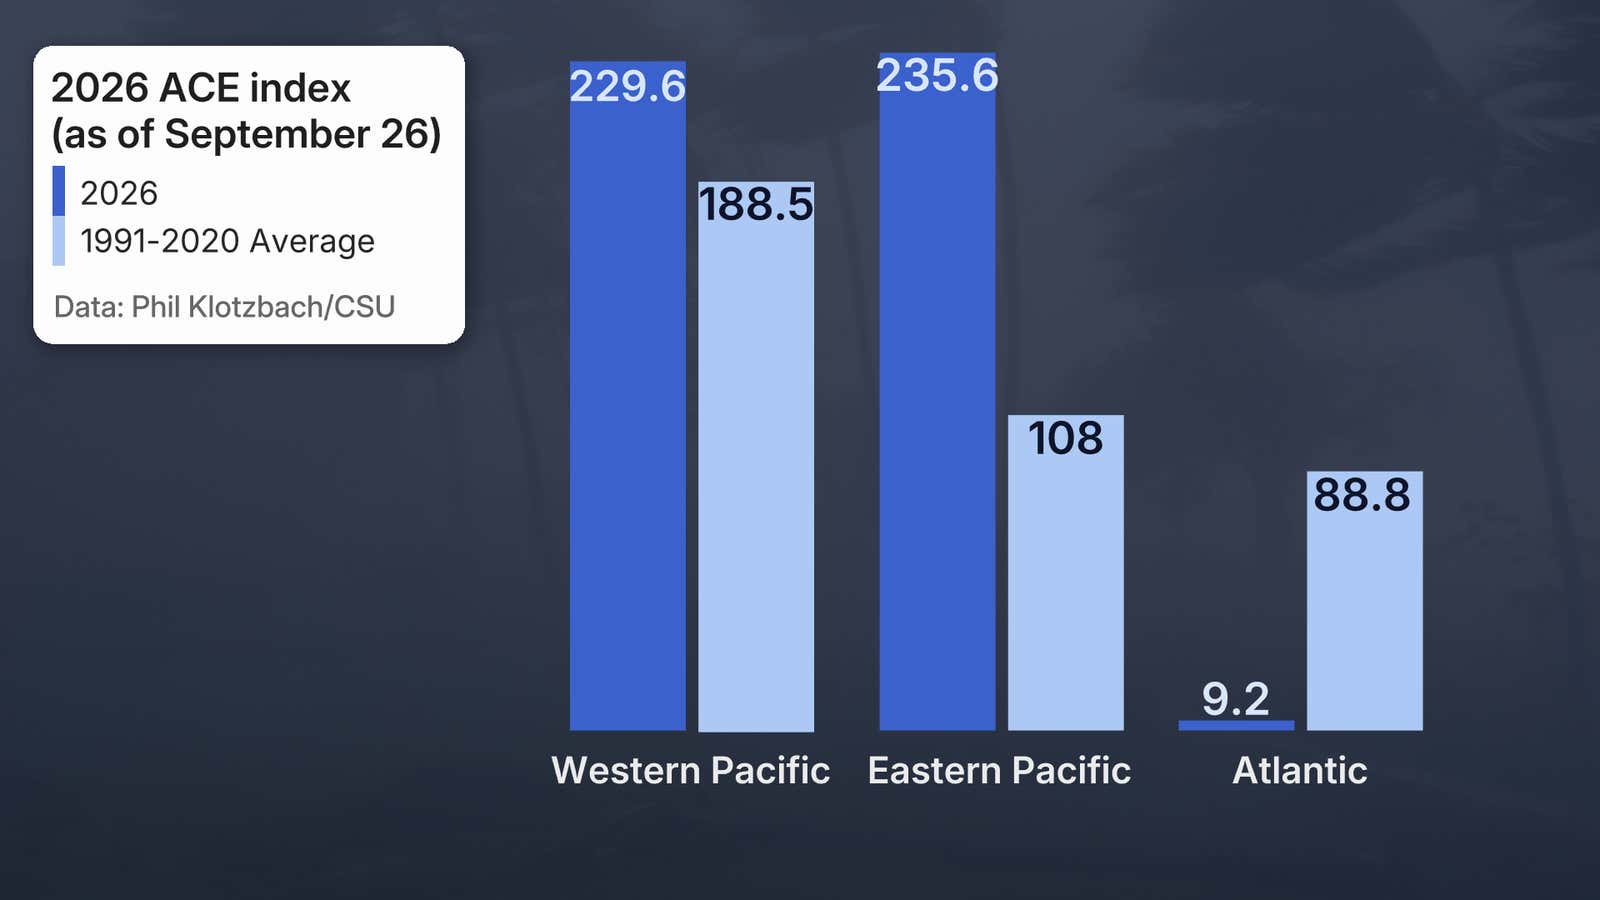
Accumulated Cyclone Energy, or ACE, is a metric that measures total energy produced by tropical storms and hurricanes over a given period, accounting for both how strong they were and how long they lasted.
(Data: Phil Klotzbach/CSU)