
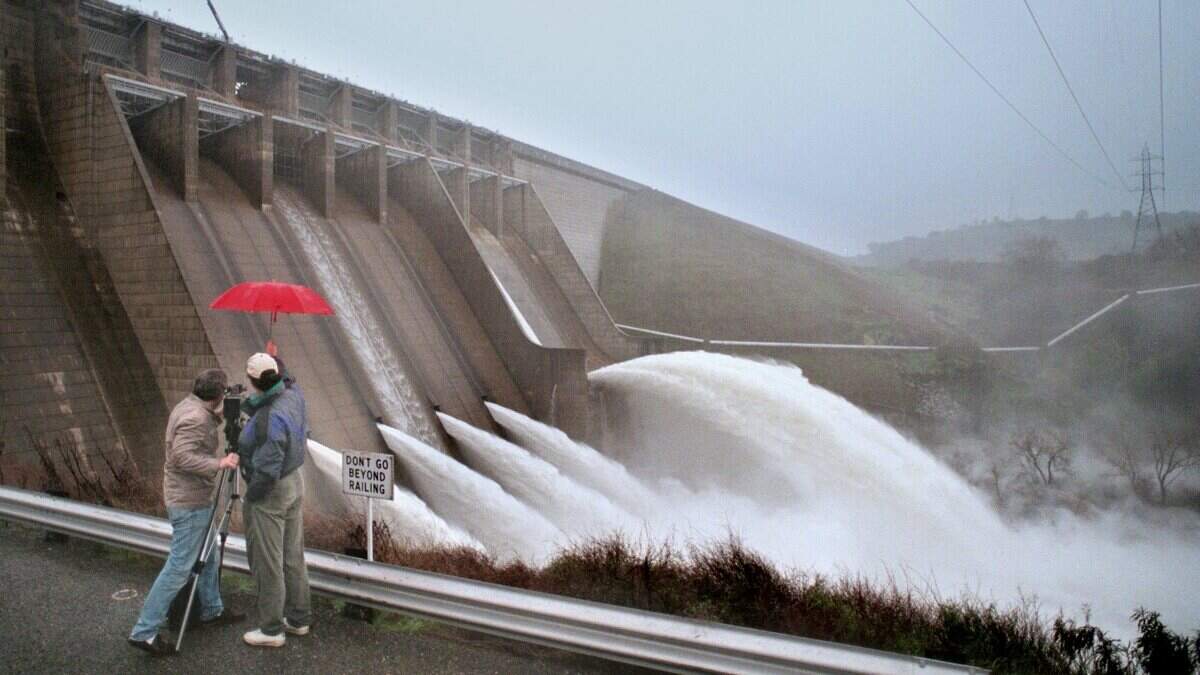
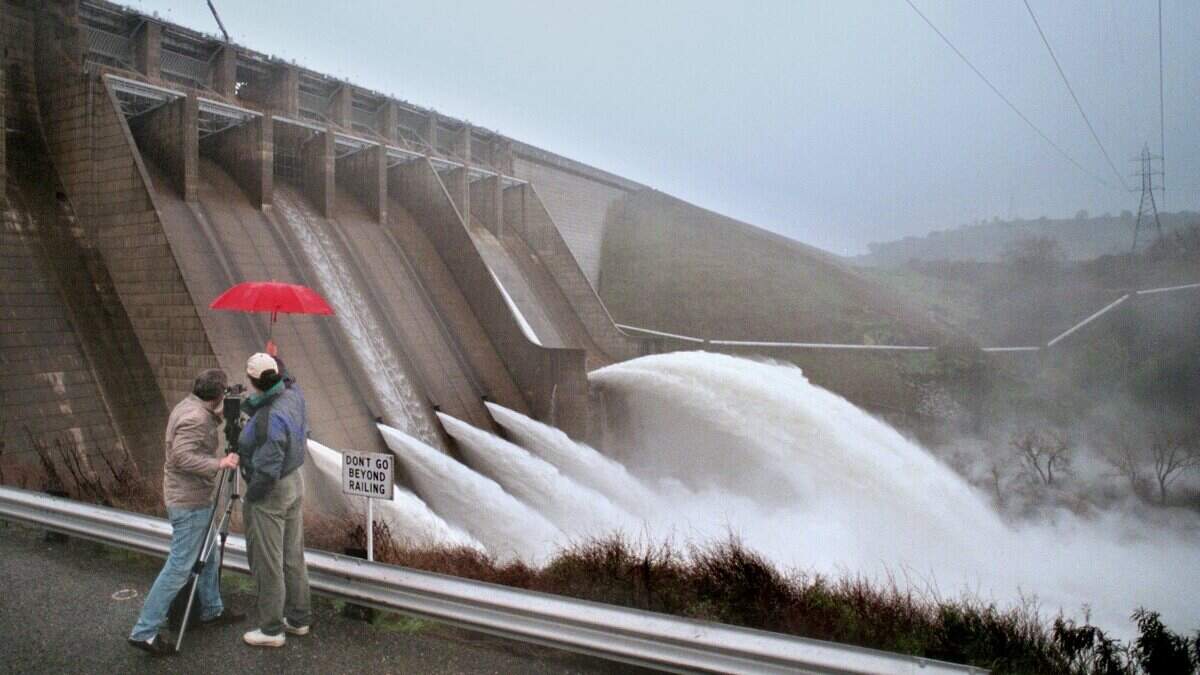
A video crew records water being released from Folsom Dam at a high rate on Jan. 1, 1997, during an El Niño winter.
OWEN BREWER
Sacramento Bee file
El Niño, as you might have heard already, is a big deal this year. The eastern Pacific is running as warm as it ever has going back into the record books. And with more warming expected over the next two to three months, there will be no shortage of attention given into early 2027.
At that makes sense — El Niño can be a big event for the world. As it reshapes weather patterns globally, it influences the occurrence of drought, rain and even hurricanes (as we are seeing right now in the eastern Pacific).
Here is an El Niño explainer if you are curious. In short, El Niño is an accumulation of warm water in the eastern Pacific Ocean that reoccurs every two to seven years.
Very strong El Niño events has been associated with floods and famine in the past. That’s not to say anything of the sort is guaranteed soon — single events are never guaranteed this far out — but there are reasons to take this El Niño seriously thanks to just how astonishing some of the numbers are.
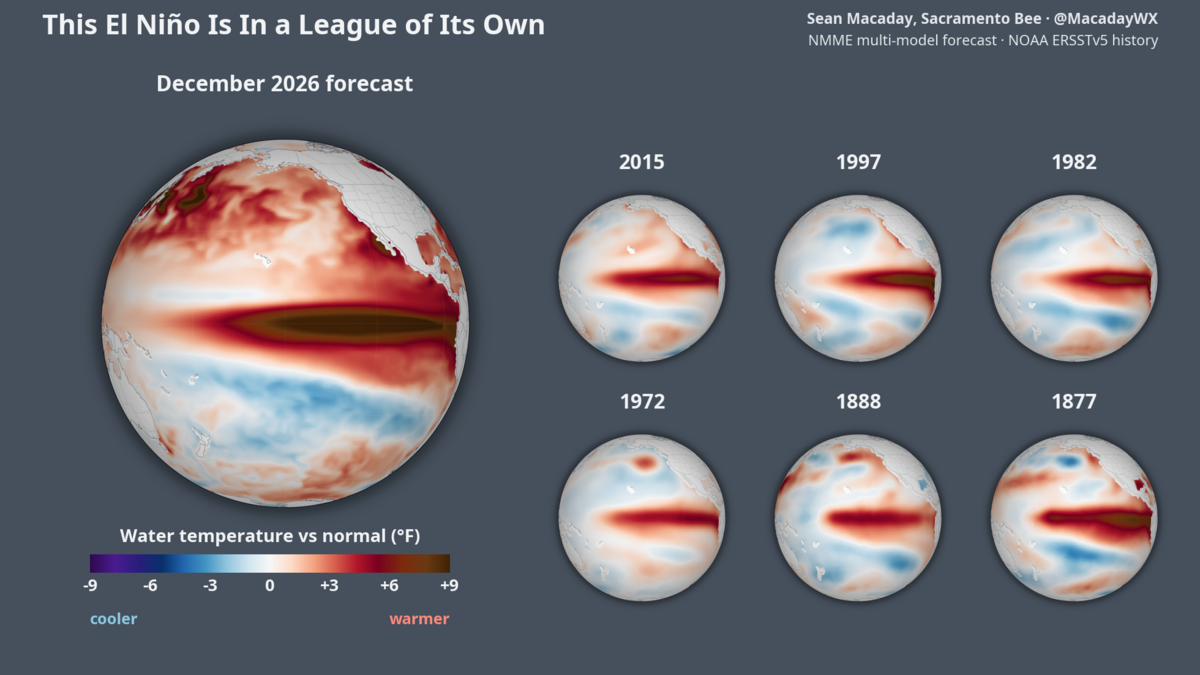 Sea surface temperatures in the eastern Pacific have already exceeded nearly every very strong El Niño event on record, and they will continue to warm into winter. The Sacramento Bee El Niño has pushed above previous records
Over the past week, the ocean temperatures associated with El Niño have breached an important new threshold. Three degrees Celsius: That’s how much sea surface temps are running above average in the key Niño 3.4 monitoring zone along the equator. NOAA’s climate prediction center made that official on Monday in its weekly update. It’s a number that has only occurred once on a weekly basis, happening briefly in 2015. That fact that these temperatures have already been reached in September, and not near the normal peak around November, is a testament to how super-charged this event is.
.png "enso_globe_chart_record_nino34_20260921 (1).png") Sea surface temperatures in the key Niño 3.4 monitoring region have pushed above 3 degrees Celsius (5.4 degrees Fahrenheit) above normal for the first time in the satellite era. Sacramento Bee
Sea surface temperatures in the key Niño 3.4 monitoring region have pushed above 3 degrees Celsius (5.4 degrees Fahrenheit) above normal for the first time in the satellite era. Sacramento Bee 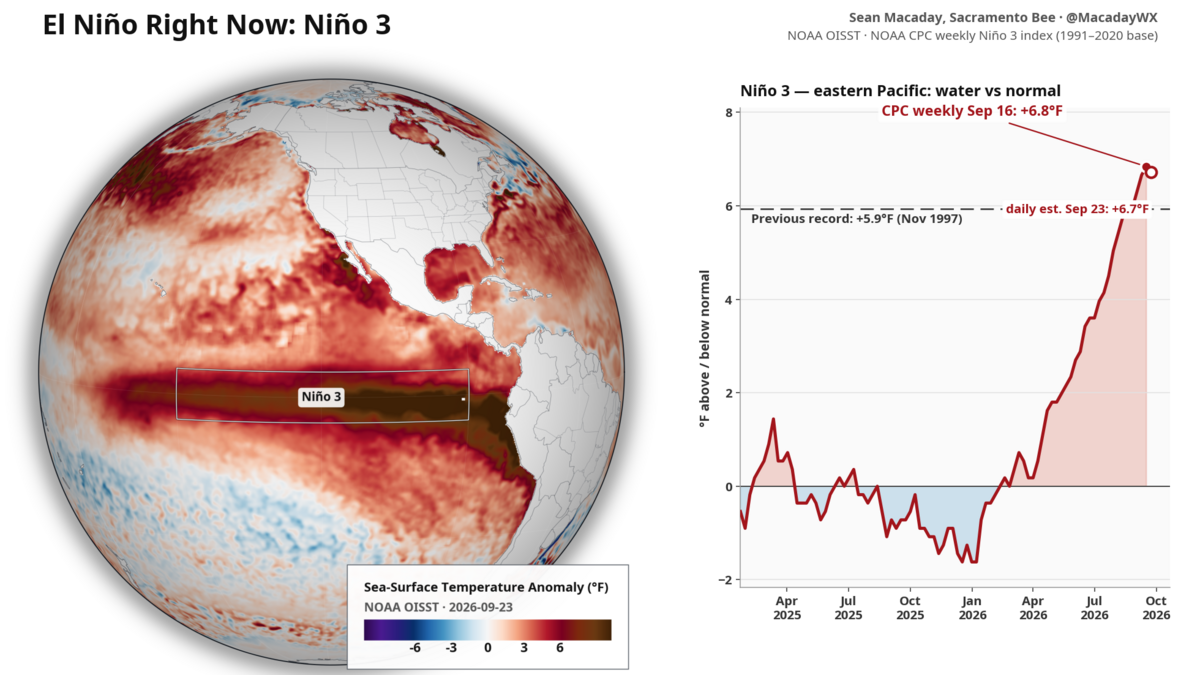 Further east, temperatures in the key Niño 3 region have reached 3.8 degrees Celsius (6.8 degrees Fahrenheit) above normal, well past the previous record. Sacramento Bee
The data is even more absurd the further east you go. In the Niño 3 monitoring region further east towards South America, ocean temps have blown past the previous record set in 1997 of 3.3 degrees Celsius (5.9 degrees Fahrenheit), and are approaching 4 degrees Celsius fast. The east-tilted nature of this El Niño event is similar to the previous very strong El Niños of 1982-83 and 1997-98, both of which were exceptionally wet years for California. More on that further down.
It would be one thing if these records were being broken in a few months, when most El Niño events typically peak. The fact that these record numbers are coming months early, with plenty of time to strengthen, is what is alarming. As temperatures in the eastern Pacific rise into uncharted waters, they will further influence the atmosphere and reshape weather patterns into early 2027. In fact, they already are.
The atmosphere is already locked in
El Niño would not be much to talk about if it were just warm water. The air above has the ocean has to respond, and this year it has. Over the past month, winds near the surface over the central Pacific have blown about 19 mph more westerly than normal. That largely cancels the trade winds that usually push warm water toward Asia. High above, the winds have reversed in step.
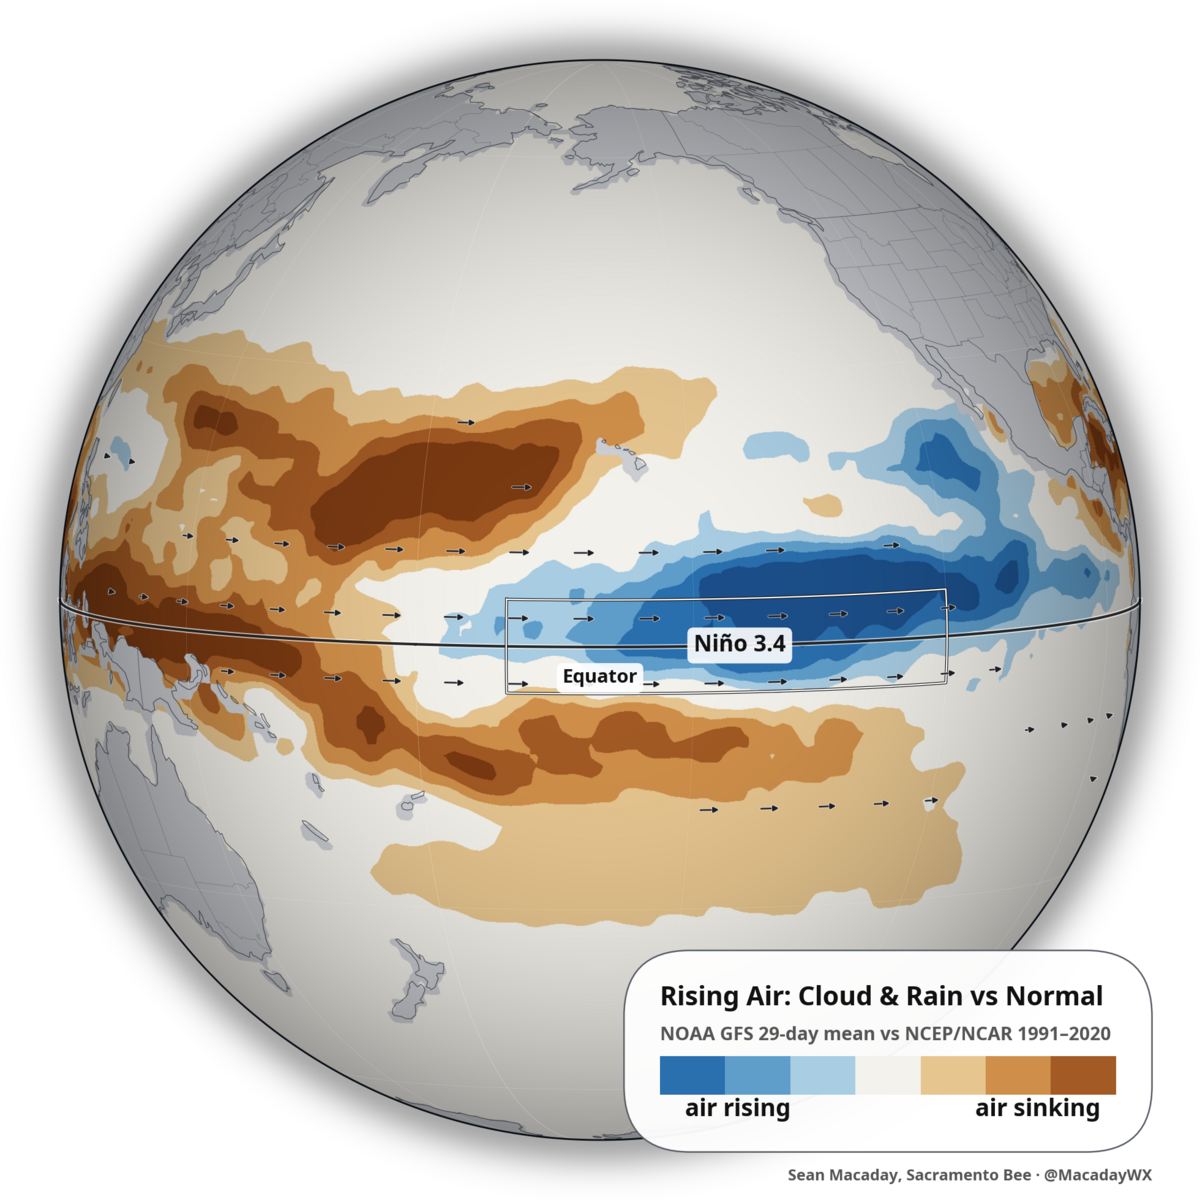 Extra rising air, in blue, is dominating the eastern Pacific, and will reshape weather patterns globally in the months to come as the winter jet stream grows stronger. The Sacramento Bee
Those shifting winds change where it rains. Normally, the Pacific’s largest thunderstorms and rising air sit over Indonesia and the western Pacific. Satellites now show that region unusually dry and cloud-free, while towering storms have moved to the central and eastern Pacific, over the warmest water.
For the second time this season, three distinct tropical cyclones are spinning out in the Pacific Ocean south of California, aided by the warm water and extra rising air that El Niño provides. Meanwhile, Hurricane Nolo is hammering the Big Island with rain. Category 5 Hurricane Polo will impact Baja California early next week, and splash New Mexico and western Texas with drenching rains soon after.
Yet again, three tropical cyclones are spining out in the eastern Pacific Ocean, boosted by El Nino’s extra warmth and favorable atmosphere. #Nolo and #Polo are both set to impact Hawaii and Baja California respectively, with Polo making a direct landfall early next week. pic.twitter.com/sOwxeAHJK8
— Sean Macaday (@MacadayWX) September 24, 2026
This coupling between the ocean and atmosphere matters because it feeds itself: Weaker trade winds let more warm water spread east, which moves the storms farther east, which weakens the trades further. It’s also the link that lets oceanic weather, such as atmospheric rivers, reach California’s shores. In these east-based and particularly strong events, this influence and extra storm activity bends the jet stream south towards the Golden State.
It will continue to get stronger
Climate models say El Niño has yet to peak. We gathered every run from four of North America’s leading seasonal forecast models, 92 in all. On average, they bring the monitoring region sea surface anomaly to about 4.1 C above normal in November, and every one of the 92 exceeds the strongest month on record, set in November 2015.
Of course, we live in a warmer world than we used to. For that reason, NOAA is using a new “relative” index this year which considers the background warmth across the greater Pacific Ocean. Even on the tougher “relative” measure that strips out background ocean warming, the models still peak near 2.8 degrees Celsius in November. Two-thirds of them (61 of 92) beat that index’s monthly record, set in January 1983.
.png "enso_roni_outlook_cpc (2).png") When considering the new Relative Oceanic Niño Index, the current El Niño is forecast to be in range of breaking the previous strongest event of 1982-83 by this metric. Sacramento Bee
When considering the new Relative Oceanic Niño Index, the current El Niño is forecast to be in range of breaking the previous strongest event of 1982-83 by this metric. Sacramento Bee
Forecasts at this range carry real uncertainty, and one model in particular can run far hotter or colder than the rest. Nonetheless, together, they have strong support. Beneath the ocean waves, the equatorial Pacific holds a large reservoir of extra heat. The top 1,000 feet of ocean ran about 5 degrees Fahrenheit above normal in July, with some recent measurements from the top few hundred feet indicating waters have reached more than 20 degrees above normal — far hotter than ever seen before. That warm water can keep feeding the surface and thereby the atmosphere for months.
California winter is likely to be wet
The last very strong El Niño of 2015-2016 did not produce a notably wet winter for California, but there may be some real science behind why. Several studies have pointed to the east-based nature of very strong events as having a greater influence on seasonal rainfall for the western United States.
That matters because of how the storms steer the atmosphere. A cluster of tropical thunderstorms acts like a rock in a stream, bending the jet stream down further east. The farther east the storms sit, the more the jet stream and its storms are pulled toward California. Research from Lawrence Berkeley National Laboratory and Iowa State University found that this eastward position — dubbed the ENSO Longitudinal Index or ELI — explains west coast rain extremes better than the standard El Niño index. It also helps explain why the strong 2015-16 El Niño, whose warmth sat farther west, left Southern California dry a decade ago.
By this east-based ELI metric, the current El Niño again stands out above the rest. Never before in records has the reservoir of warm storm-fueling waters sat so far to the east in September. Only the events of 1982-83 and 1997-98 can match, and both peaked on this metric the following spring. To reiterate, the current El Niño is still strengthening.
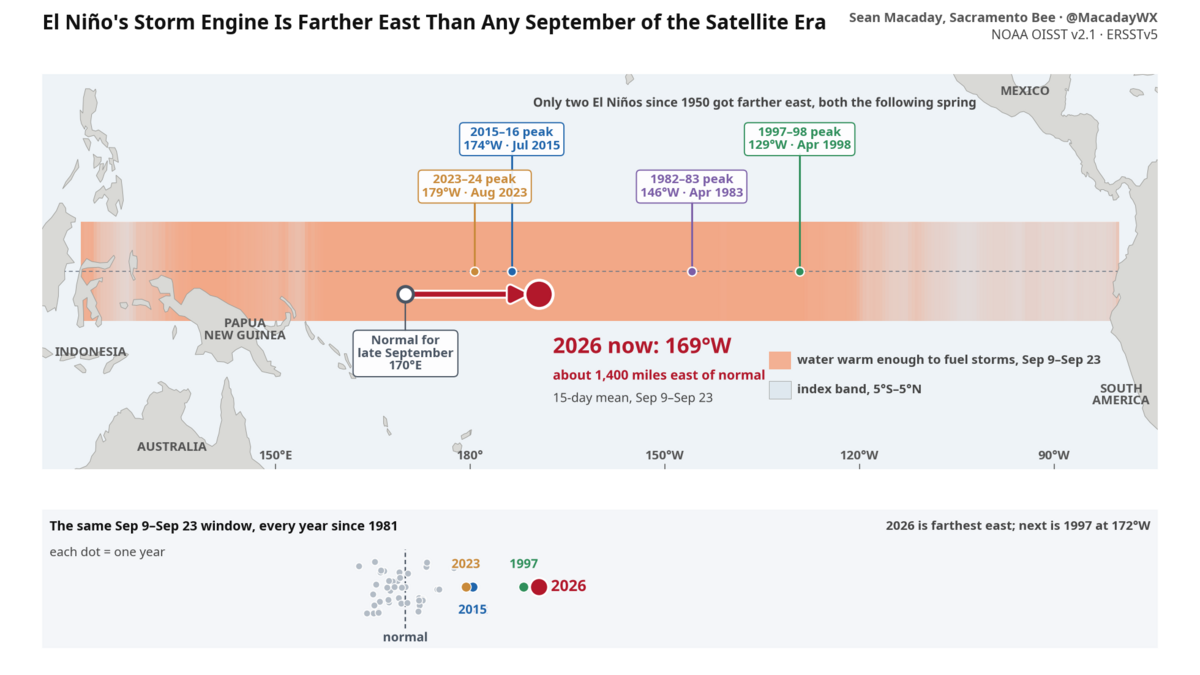 Sacramento Bee
None of this guarantees a wet California winter. El Niño explains only about a quarter to a third of California’s year-to-year rainfall; the rest comes down to individual storms and atmospheric rivers, which can override El Niño in either direction. And the east-based pattern has to hold through winter and spring, as it did in 1982-83 and 1997-98. Nonetheless, the ingredients for California’s wettest El Niño winters are lining up before us in the east Pacific.
And climate models are seeing this too. The long-range signals lean wet. The European model’s seasonal forecast, among the most skillful available for the western U.S., projects Sacramento about 1.9 inches wetter than normal in December and 3.4 inches wetter in January, with 78% of its runs notably wetter than normal. The North American models broadly agree. NOAA’s official winter outlook gives Sacramento, the Bay Area and Fresno a 40% chance of a wetter-than-normal December through February, and San Luis Obispo to San Diego 50%.
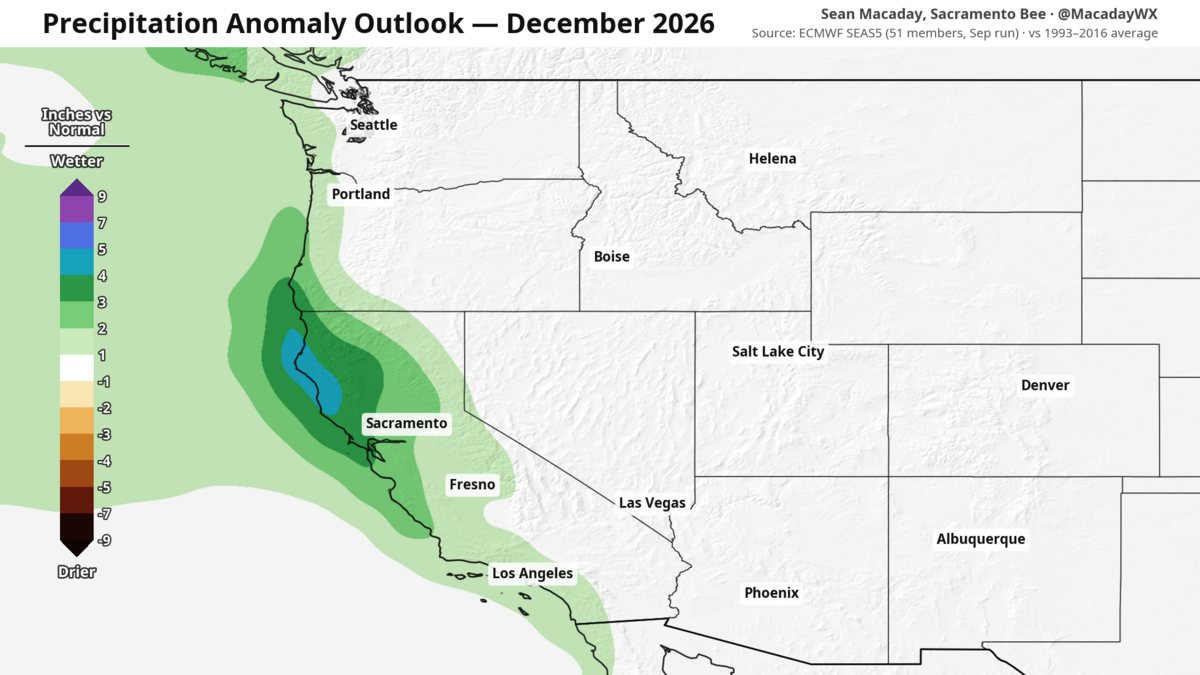 Approximate December rainfall anomaly as computed by the SEAS5 European climate model. Sacramento Bee
 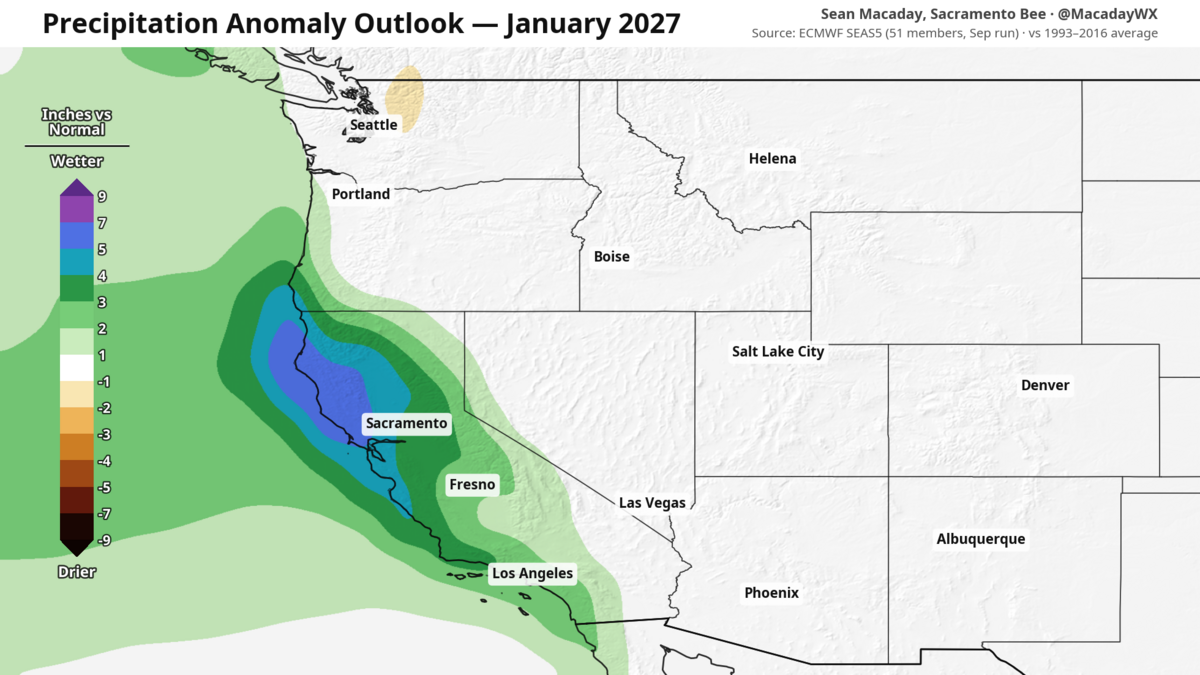 Approximate January rainfall anomaly as computed by the SEAS5 European climate model. Sacramento Bee
While flooding itself will not be expected across a wide area, the opportunity for strong flood events does look elevated for the state starting in December. And even though most people are individually unlikely to see a major flood — the odds remain elevated as the winter months draw closer.
This story was originally published September 27, 2026 at 7:00 AM.

The Sacramento Bee
Sean Macaday covers the weather for McClatchy Media in California. Originally from Chicago, Sean worked 6 years covering the weather on local television in Minnesota. He holds a bachelor’s degree in meteorology and marine science from the University of Miami.