October 25, 2026
Our latest national tracking survey was conducted from October 16 to 21, 2026, as the federal government continues to navigate an uncertain economic environment, ongoing tensions with the United States, and persistent concerns about affordability and the cost of living.
Despite those pressures, support for the Liberal Party and the federal government led by Mark Carney remains strong. In fact, our latest survey finds the Liberals reaching a level of national support we have not measured in more than a decade.
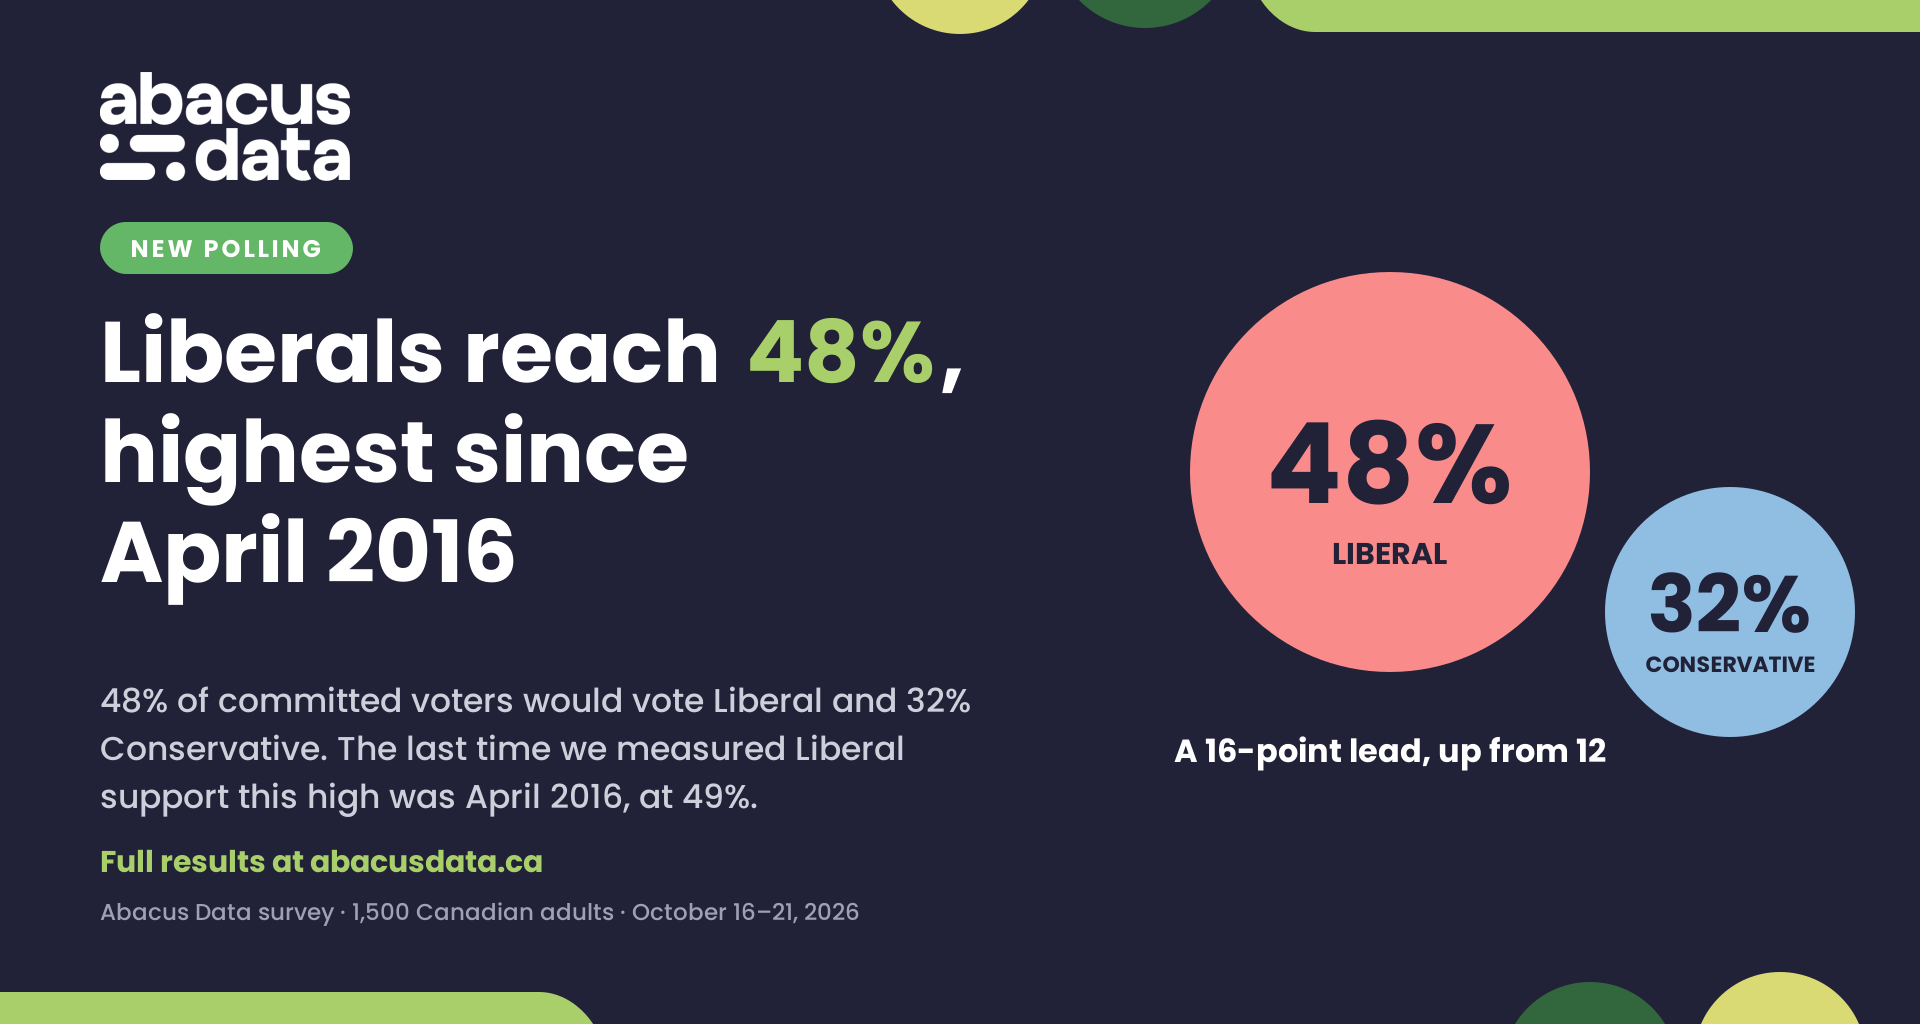
Forty-eight percent of committed voters would vote Liberal if an election were held today, the highest level of Liberal support in our tracking since April 2016.
The last time we measured Liberal support this high was during the first year of Justin Trudeau’s government, when the party received 49% of the vote in our April 2016 survey.
More than ten years later, the Liberals have returned to that level of public support under Mark Carney.
If an election were held today, 48% of committed voters would vote Liberal, 32% Conservative, 9% NDP, 6% Bloc Québécois, 3% Green, 1% People’s Party, and 1% another party.
The Liberal lead over the Conservatives is now 16 points, compared with 12 points in our October 13 survey.
Liberal support is up two points, from 46% to 48%, while Conservative support has fallen two points, from 34% to 32%.
And the improvement in Liberal vote intention is accompanied by continued positive assessments of the government and the Prime Minister.
Fifty-nine percent of Canadians approve of the job the federal government led by Mark Carney is doing, up two points from our previous survey. Disapproval has fallen three points to 26%.
The government’s net approval rating is now +33, compared with +28 in our October 13 survey.
Carney’s personal impression rating has also improved. Fifty-six percent of Canadians have a positive impression of the Prime Minister, while 27% have a negative impression, producing a net rating of +29.
That is up three points from our previous survey and leaves Carney with a substantially more positive personal rating than Pierre Poilievre, whose net impression remains at -8.
There is also evidence that the public’s underlying appetite for political change continues to look very different than it did one or two years ago.
Forty-two percent of Canadians now say they would re-elect the Liberals, compared with 36% who believe it is time for a change and that there is a good alternative available. Another 21% believe it is time for change but do not think there is a good alternative.
Two years ago, only 16% said they would re-elect the Liberals, while 54% believed it was time for a change and there was a good alternative.
That represents a substantial change in the underlying political environment.
But the latest results also reveal some important tensions.
The rising cost of living remains, by a considerable margin, the most frequently cited issue facing Canada, selected by 65% of Canadians.
And while almost six in ten Canadians approve of the government overall, only 31% approve of how it is handling the cost of living and inflation, down seven points from September.
On Canada’s relationship with the United States, by comparison, 56% approve of the government’s performance, while 54% approve of its handling of national defence and Canada’s security.
The result is a political environment in which support for the Liberals and the Prime Minister remains strong, even though Canadians continue to express considerable dissatisfaction with the handling of some of the domestic issues that matter most to them.
Liberals Lead Conservatives by 16 Points, Reaching Their Highest Vote Share Since April 2016
If an election were held today, 48% of committed voters would vote Liberal, 32% Conservative, 9% NDP, 6% Bloc Québécois, 3% Green, 1% People’s Party, and 1% another party.
Compared with our October 13 survey, Liberal support has increased two points while Conservative support has declined two points.
The NDP remains unchanged at 9%, while the Bloc Québécois has declined one point to 6%. Green Party support is unchanged at 3%, as is People’s Party support at 1%.
While the individual changes are modest and should be interpreted with the normal caution that applies to survey-to-survey movement, the longer-term picture is more notable.
At 48%, Liberal support is now at its highest level in our tracking since April 2016, when the party stood at 49%.
That was during the early months of Justin Trudeau’s first government, following the Liberal victory in the 2015 federal election.
Among those who say they are certain to vote in an election, the Liberals receive 48%, compared with 34% for the Conservatives.
That produces a 14-point Liberal lead among those expressing the greatest certainty about voting.
The NDP receives 8% among those certain to vote, the Bloc Québécois 6%, and the Greens 2%.
The Liberals also continue to have the largest accessible voter pool.
Sixty percent of Canadians say they would consider voting Liberal, compared with 47% who would consider voting Conservative and 33% who would consider voting NDP.
That represents a 13-point difference between the Liberal and Conservative accessible voter pools.
These results suggest that the Liberal Party’s advantage is not limited to current vote intention. The party also has a larger pool of Canadians who are open to supporting it.

Canadian Public Affairs Update · October 2026
Vote Intention: Liberals Lead Conservatives 48% to 32%
n=1,500 Canadian adults · October 16–21, 2026 · MoE ±2.53%
Overall
Trend Line
Subgroups
Likely Voters
Methodology
If an election was held today, which national political party would you vote for? (Undecided removed.)
Overall Federal Vote Intention
Liberals lead Conservatives by 16 points, 48% to 32%. Since October 13, Liberal support is up 2 points and Conservative support is down 2. The NDP is at 9%, the Bloc Québécois at 6%, and the Greens at 3%.
PartyCurrentOct 13, 2026ChangeLiberal48%46%▲ +2Conservative32%34%▼ -2NDP9%9%NCBloc Québécois6%7%▼ -1Green3%3%NCPeople’s Party1%1%NCOther1%0%▲ +1
Changes are percentage-point differences from October 13, 2026. NC means no change. Overall and likely-voter bars use a shared maximum of 48%. Undecided respondents are removed.
If an election was held today, which national political party would you vote for? (Undecided removed.)
Federal Vote Intention Trend
Liberal support is 48% and Conservative support is 32%. The Liberal lead widens from 12 to 16 points since October 13. NDP support remains 9%, Bloc Québécois support is 6%, and Green support remains 3%.
Liberal 48%Conservative 32%NDP 9%BQ 6%Green 3%
Trend over time0%10%20%30%40%50%Aug 7-24Jan 28-25Apr 27-25Oct 29-25Apr 22-26Oct 21-26
If an election was held today, which national political party would you vote for? (Undecided removed.) (By region, gender and age.)
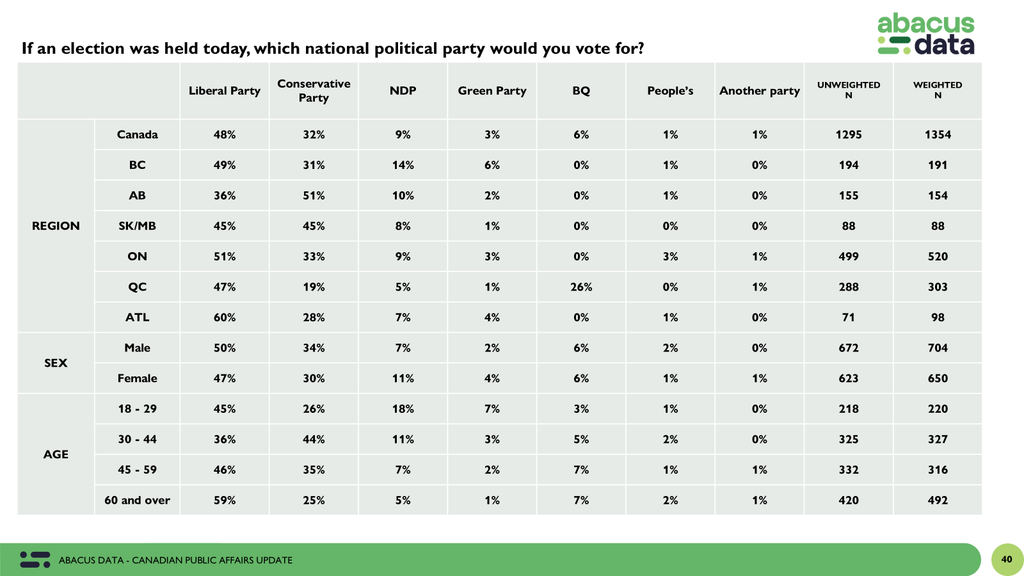
Liberals lead in British Columbia, Ontario, Quebec and Atlantic Canada. Conservatives lead in Alberta, while the two parties tie at 45% in Saskatchewan and Manitoba. Liberal support reaches 59% among adults aged 60 and over; the NDP reaches 18% among those aged 18 to 29.
Vote Intention by Region
PartyCanadaBCABSK/MBONQCATLLiberal48%49%36%45%51%47%60%Conservative32%31%51%45%33%19%28%NDP9%14%10%8%9%5%7%Bloc Québécois6%0%0%0%0%26%0%Green3%6%2%1%3%1%4%People’s Party1%1%1%0%3%0%1%Other1%0%0%0%1%1%0%
The top three parties in each column are highlighted in their party colours. Percentages may not sum to 100 due to rounding.
Vote Intention by Gender and Age
PartyCanadaMaleFemale18 to 2930 to 4445 to 5960 and overLiberal48%50%47%45%36%46%59%Conservative32%34%30%26%44%35%25%NDP9%7%11%18%11%7%5%Bloc Québécois6%6%6%3%5%7%7%Green3%2%4%7%3%2%1%People’s Party1%2%1%1%2%1%2%Other1%0%1%0%0%1%1%
The top three parties in each column are highlighted in their party colours. Canada is the national reference. Scroll horizontally to see all columns on narrow screens.
If an election was held today, which national political party would you vote for? (Undecided removed.) (Among those certain to vote.)
Federal Vote Intention Among Those Certain to Vote
Among those certain to vote, Liberals lead 48% to 34%. Conservative support is 2 points higher than among all decided voters. NDP and Green support are each 1 point lower, while Liberal and Bloc Québécois support are unchanged.
Turnout boost or suppression is the percentage-point difference from overall results, not a forecast. NC means no change. Shares total 99% due to rounding. Undecided respondents are removed; the subgroup sample size was not supplied.
Methodology
This research was conducted via online survey with 1,500 adults (age 18+) living in Canada from October 16 to 21, 2026.
A random sample of panelists were invited to complete the survey from a set of partner panels. These partners are typically double opt-in survey panels, blended to manage out potential skews in the data from a single source.
The margin of error for a comparable probability-based random sample of the same size is plus or minus 2.53 percentage points, 19 times out of 20.
The data were weighted according to census data to ensure that the sample matched Canada’s population. Totals may not add up to 100 due to rounding.
Abacus Data · Canadian Public Affairs Update · October 21, 2026 · n=1,500 · MoE ±2.53%
abacusdata.ca
Liberals Lead Across Most of the Country, with Particularly Strong Results in Atlantic Canada, Quebec, and Ontario
The regional picture continues to show substantial differences in federal voting preferences.
In Ontario, the Liberals lead the Conservatives by 18 points, with 51% of committed voters supporting the Liberals compared with 33% for the Conservatives. The NDP receives 9%.
In British Columbia, the Liberals also lead by 18 points, receiving 49% compared with 31% for the Conservatives and 14% for the NDP.
Atlantic Canada remains particularly favourable to the Liberals.
Sixty percent of committed voters in the region would vote Liberal, compared with 28% Conservative and 7% NDP.
That represents a 32-point Liberal advantage.
Quebec also continues to be an important source of Liberal strength.
Forty-seven percent of committed voters in Quebec would vote Liberal, compared with 26% for the Bloc Québécois and 19% for the Conservatives. The NDP receives 5%.
The Liberals therefore lead the Bloc by 21 points in Quebec.
In Alberta, the Conservatives lead with 51%, compared with 36% for the Liberals and 10% for the NDP.
In Saskatchewan and Manitoba, the two largest parties are tied, with the Liberals and Conservatives each receiving 45%. The NDP is at 8%.
There are also important differences by age.
Among Canadians aged 60 and over, the Liberals receive 59% of the vote, compared with 25% for the Conservatives.
That 34-point Liberal advantage is considerably larger than the national gap.
Among Canadians aged 45 to 59, the Liberals lead 46% to 35%.
Among younger Canadians aged 18 to 29, the Liberals receive 45%, compared with 26% for the Conservatives and 18% for the NDP. The Greens receive 7%.
The clearest Conservative advantage is among Canadians aged 30 to 44.
In this group, 44% would vote Conservative compared with 36% Liberal and 11% NDP.
The Liberals also lead among both men and women.
Among men, Liberal support is 50% compared with 34% for the Conservatives. Among women, the numbers are 47% and 30%, respectively.
Educational attainment continues to be strongly associated with voting preferences.
Among university graduates, the Liberals lead the Conservatives by 28 points, 55% to 27%.
Among college graduates, the Liberal lead is 18 points, 48% to 30%.
But among Canadians with a high school education or less, the two parties are effectively tied, with the Liberals at 42% and the Conservatives at 41%.
The overall picture is of a Liberal coalition with substantial support across most regions and demographic groups, particularly among older Canadians and university graduates.
At the same time, the Conservatives retain important areas of strength, especially in Alberta, among Canadians aged 30 to 44, and among those without post-secondary education.
Government Approval Rises to 59%, with Disapproval Falling to 26%
The latest survey also finds continued positive assessments of the federal government led by Mark Carney.
Fifty-nine percent of Canadians approve of the job the government is doing, while 26% disapprove and 15% neither approve nor disapprove.
Compared with our October 13 survey, approval has increased two points, from 57% to 59%, while disapproval has fallen three points, from 29% to 26%.
The government’s net approval rating is now +33, compared with +28 in our previous survey.
Canadian Public Affairs Update · October 2026
Government Approval: 59% Approve of the Federal Government
n=1,500 Canadian adults · October 16–21, 2026 · MoE ±2.53%
Overall
Trend Line
Methodology
Overall, do you approve or disapprove of the job the federal government led by Mark Carney is doing?
Overall Government Approval
A majority of Canadians approve of the federal government, at 59%. Approval is up 2 points since October 13, while disapproval is down 3 points to 26%. Fifteen per cent neither approve nor disapprove.
Approve59%
▲ +2 since October 13
Neither15%
Neither approve nor disapprove
Disapprove26%
▼ -3 since October 13
Neither approve nor disapprove
15%
Approve combines strongly and somewhat approve; disapprove combines somewhat and strongly disapprove. The 22% strongly and 36% somewhat approve shares sum to 58% after rounding, compared with 59% overall approval. Five rounded components total 99%. Changes are from October 13, 2026.
Overall approval and disapproval of the federal government over time.
Government Approval Trend
Approval is 59% and disapproval is 26%. The October 13 wave rounds to 57% approval and 29% disapproval, consistent with the current changes of +2 and -3 points.
Approve 59%Disapprove 26%
Trend over time0%10%20%30%40%50%60%70%July 23-24Dec 17-24Jun 5-25Nov 27-25May 20-26Oct 21-26
Methodology
This research was conducted via online survey with 1,500 adults (age 18+) living in Canada from October 16 to 21, 2026.
A random sample of panelists were invited to complete the survey from a set of partner panels. These partners are typically double opt-in survey panels, blended to manage out potential skews in the data from a single source.
The margin of error for a comparable probability-based random sample of the same size is plus or minus 2.53 percentage points, 19 times out of 20.
The data were weighted according to census data to ensure that the sample matched Canada’s population. Totals may not add up to 100 due to rounding.
Abacus Data · Canadian Public Affairs Update · October 21, 2026 · n=1,500 · MoE ±2.53%
abacusdata.ca
Canadians Continue to Rate the Government More Positively on Canada-U.S. Relations and National Security Than on Affordability
Our survey asks Canadians whether they approve or disapprove of how the federal government is handling ten specific policy areas.
The results show a substantial difference between overall government approval and assessments of its performance on some of the most pressing domestic issues.
The government’s strongest approval ratings are on Canada’s relationship with the United States and national defence.
Fifty-six percent of Canadians approve of how the government is handling Canada’s relationship with the United States, compared with 57% in September and 50% in August.
On national defence and Canada’s security, 54% approve, up from 52% in September and 50% in August.
These are the only two areas where a majority of Canadians approve of the government’s performance.
After that, approval falls below 50%.
Forty-four percent approve of the government’s handling of jobs and economic growth, up from 43% in September and 41% in August.
Thirty-nine percent approve of its handling of crime and public safety, while 38% approve of its handling of access to healthcare.
Thirty-seven percent approve of the government’s handling of immigration, and the same proportion approve of its handling of climate change and the environment.
Thirty-six percent approve of its handling of the federal deficit and government spending.
On housing affordability and supply, approval stands at 34%.
And on the cost of living and inflation, only 31% approve of the government’s performance.
That is the lowest approval rating of the ten issues tested.
It is also down seven points from September, when 38% approved of the government’s handling of the cost of living and inflation.
Forty-six percent now disapprove of how the government is handling that issue.
This is one of the most important tensions in the current political environment.
Almost six in ten Canadians approve of the federal government overall.
But fewer than one in three approve of how it is handling the cost of living and inflation, which continues to be the most frequently identified issue facing the country.
They continue to make significant distinctions between how the government is managing Canada’s relationship with the United States, how it is approaching national security, and how it is responding to domestic economic pressures.
For now, those weaker assessments on affordability have not been accompanied by a decline in overall government approval or Liberal vote intention.
Carney’s Personal Impression Improves to +29, While Poilievre Remains at -8
Mark Carney continues to have a strongly positive personal impression rating.
Fifty-six percent of Canadians have a positive impression of the Prime Minister, while 27% have a negative impression and 15% are neutral.
That produces a net impression of +29.
Compared with our October 13 survey, Carney’s positive rating has increased one point, while his negative rating has declined two points.
His net impression has therefore improved from +26 to +29.
While that remains slightly below the +31 net impression recorded in late September, it is nevertheless a substantially positive result.
And Carney continues to have a considerably more positive net impression than the other major federal party leaders.
Pierre Poilievre is viewed positively by 37% of Canadians and negatively by 45%, producing a net impression of -8.
That is unchanged from the reported net impression in our previous survey.
Avi Lewis is viewed positively by 17% and negatively by 27%, for a net impression of -10.
Twenty-four percent of Canadians say they do not know enough about Lewis to offer an opinion.
Canadian Public Affairs Update · October 2026
Leader Impressions: Carney Records a +29 Net Rating
n=1,500 Canadian adults · October 16–21, 2026 · MoE ±2.53%
Overall Comparison
Trend Line
Subgroups: Carney
Subgroups: Poilievre
Methodology
Do you have a positive or negative impression of the following people?
Overall Leader Comparison
Mark Carney has a net-positive impression of +29. Pierre Poilievre is at -8 and Avi Lewis at -10. Carney is viewed positively by 56%, compared with 37% for Poilievre and 17% for Lewis.
Mark Carney
Liberal leader
Net +29
Positive 56%
Neutral 15%
Negative 27%
Don’t know enough to say 2%
Pierre Poilievre
Conservative leader
Net -8
Positive 37%
Neutral 14%
Negative 45%
Don’t know enough to say 4%
Avi Lewis
NDP leader
Net -10
Positive 17%
Neutral 32%
Negative 27%
Don’t know enough to say 24%
Net impression is positive minus negative, reported in percentage points. Totals may not add up to 100 due to rounding.
Net impression of Mark Carney and Pierre Poilievre over time.
Carney versus Poilievre: Net Impression
Carney has a net impression of +29 and Poilievre is at -8. Since October 13, Carney improves 3 points from +26 while Poilievre remains at -8.
Mark Carney +29Pierre Poilievre -8
Trend over time-20-100+10+20+30+40Jan 27-25Apr 15-25Aug 20-25Jan 14-26Jun 3-26Oct 21-26
Do you have a positive or negative impression of Mark Carney? (Net impression by subgroup.)
Mark Carney Net Impression by Subgroup
Carney’s net impression is positive in every region. His net rating reaches +42 in Quebec and +47 among adults aged 60 and over. Among 2025 Liberal voters it is +83, compared with -28 among Conservative voters.
Overall
Canada+29
Region
BC+30
AB+20
SK/MB+18
ON+27
QC+42
ATL+27
Gender
Male+31
Female+28
Age
18 to 29+31
30 to 44+9
45 to 59+20
60 and over+47
Household income
Under $35K+21
$35K to $50K+27
$50K to $75K+26
$75K to $100K+32
$100K ++39
Community
Urban+33
Suburban+27
Rural+23
2025 Vote
Liberal+83
Conservative-28
NDP+42
BQ+17
Values are net impressions in percentage points. The shared signed scale is -100 to +100, with zero at the centre. Green denotes positive and red negative. The national reference is shown once; 2025 vote is past federal vote choice, not current intention.
Do you have a positive or negative impression of Pierre Poilievre? (Net impression by subgroup.)
Pierre Poilievre Net Impression by Subgroup
Poilievre’s net impression is positive in Alberta and Saskatchewan and Manitoba. His net rating is +18 in Alberta and -22 in Quebec. Among adults aged 30 to 44 it is +13, compared with -23 among those aged 60 and over.
Overall
Canada-8
Region
BC-9
AB+18
SK/MB+11
ON-10
QC-22
ATL-5
Gender
Male-6
Female-9
Age
18 to 29-4
30 to 44+13
45 to 59-7
60 and over-23
Household income
Under $35K-9
$35K to $50K-16
$50K to $75K-7
$75K to $100K+3
$100K +-10
Community
Urban-5
Suburban-12
Rural-5
2025 Vote
Liberal-59
Conservative+73
NDP-50
BQ-45
Values are net impressions in percentage points. The shared signed scale is -100 to +100, with zero at the centre. Green denotes positive and red negative. The national reference is shown once; 2025 vote is past federal vote choice, not current intention.
Methodology
This research was conducted via online survey with 1,500 adults (age 18+) living in Canada from October 16 to 21, 2026.
A random sample of panelists were invited to complete the survey from a set of partner panels. These partners are typically double opt-in survey panels, blended to manage out potential skews in the data from a single source.
The margin of error for a comparable probability-based random sample of the same size is plus or minus 2.53 percentage points, 19 times out of 20.
The data were weighted according to census data to ensure that the sample matched Canada’s population. Totals may not add up to 100 due to rounding.
Abacus Data · Canadian Public Affairs Update · October 21, 2026 · n=1,500 · MoE ±2.53%
abacusdata.ca
Carney’s personal standing remains positive in every region of the country.
His net impression is +42 in Quebec, +30 in British Columbia, +27 in Ontario and Atlantic Canada, +20 in Alberta, and +18 in Saskatchewan and Manitoba.
Poilievre’s personal ratings show a different pattern.
His net impression is positive in Alberta (+18) and Saskatchewan and Manitoba (+11), but negative in British Columbia (-9), Ontario (-10), Quebec (-22), and Atlantic Canada (-5).
He is also viewed more positively by Canadians aged 30 to 44, among whom his net impression is +13.
Among those aged 60 and over, his net impression is -23.
Cost of Living Remains the Top Issue Facing Canada, Selected by 65%
The rising cost of living remains, by a considerable margin, the most frequently selected issue facing Canada.
Sixty-five percent of Canadians identify it as one of the three most important issues facing the country, up one point from our October 13 survey.
Donald Trump and his administration remain second, selected by 40% of Canadians.
The economy is selected by 34%, healthcare by 33%, and housing affordability and accessibility by 28%.
Immigration is selected by 23%, crime and public safety by 17%, and job security and unemployment by 15%.
Climate change and the environment is selected by 14%, inequality and poverty by 12%, and the rise of artificial intelligence by 11%.
The threat posed by China and Russia is selected by 7%, while Indigenous reconciliation is selected by 3%.
Canadian Public Affairs Update · October 2026
Top Issues: Cost of Living Leads at 65%
n=1,500 Canadian adults · October 16–21, 2026 · MoE ±2.53%
Overall Top Issues
Regional Breakout
Best Party Able to Handle Issue
Methodology
What are the 3 most important issues facing Canada today? Please select 3 issues.
Overall Top Issues
The rising cost of living leads at 65%. Donald Trump and his administration ranks second at 40%, followed by the economy at 34%, healthcare at 33% and housing affordability and accessibility at 28%.
The rising cost of living
65%
Donald Trump and his administration
40%
Housing affordability and accessibility
28%
Crime and public safety
17%
Job security and unemployment
15%
Climate change and the environment
14%
Inequality and poverty
12%
The rise of artificial intelligence
11%
The threat posed by China and Russia
7%
Indigenous reconciliation
3%
Respondents selected three issues, so totals exceed 100%.
What are the 3 most important issues facing Canada today? Please select 3 issues. (By region.)
The rising cost of living is the leading issue in every region. It reaches 72% in Atlantic Canada and 69% in Alberta. Healthcare is selected by 42% in Saskatchewan and Manitoba, while concern about Donald Trump reaches 51% in Quebec.
Top Issues by Region
IssueBCABSK/MBONQCATLThe rising cost of living67%69%66%61%66%72%Donald Trump and his administration38%30%34%39%51%36%The economy34%46%25%34%33%29%Healthcare37%29%42%27%37%37%Housing affordability and accessibility26%26%16%32%25%32%Immigration18%25%32%22%26%21%Crime and public safety20%19%26%19%6%16%Job security and unemployment18%14%10%19%7%11%Climate change and the environment13%12%10%12%21%11%Inequality and poverty12%8%14%10%15%12%The rise of artificial intelligence8%13%14%13%6%12%The threat posed by China and Russia7%7%7%7%6%9%Indigenous reconciliation1%2%4%4%2%1%
Exactly three issues per column are highlighted. Regional percentages are column percentages. Respondents selected three issues, so column totals exceed 100%. Scroll horizontally to view all six regions.
Which party do you think would do best on… (Among those who rated the issue in their Top 3.)
Best Party Able to Handle Each Issue
Liberals lead on seven issues, Conservatives on four, and Greens on climate. On the economy, Liberals and Conservatives tie at 40%. On climate, Green support is 30%, ahead of the Liberals at 28%.
The rising cost of livingConservative 37%Housing affordability and accessibilityLiberal 31%Crime and public safetyConservative 55%Climate change and the environmentGreen 30%The threat posed by China and RussiaLiberal 51%Inequality and povertyLiberal 33%Indigenous reconciliationLiberal 37%ImmigrationConservative 59%The rise of artificial intelligenceLiberal 41%Donald Trump and his administrationLiberal 67%Job security and unemploymentConservative 38%IssueLiberalConservativeNDPUnsureLeading partyHealthcare39%21%18%18%Liberal +18The rising cost of living32%37%9%17%Conservative +5Housing affordability and accessibility31%28%14%21%Liberal +3Crime and public safety24%55%4%13%Conservative +31The economy40%40%4%12%Liberal / Conservative tieClimate change and the environment28%10%12%15%Green +2The threat posed by China and Russia51%27%3%10%Liberal +24Inequality and poverty33%16%25%19%Liberal +8Indigenous reconciliation37%18%21%10%Liberal +16Immigration13%59%3%13%Conservative +46The rise of artificial intelligence41%17%6%28%Liberal +24Donald Trump and his administration67%14%3%12%Liberal +53Job security and unemployment29%38%8%18%Conservative +9
The chart shows the leading party’s share. The table compares Liberal, Conservative and NDP shares, plus Unsure. Green leads on climate at 30%, versus Liberal 28%, NDP 12% and Conservative 10%. The economy is a 40%-40% Liberal-Conservative tie, not a party advantage. Margins compare the two highest party shares, not Unsure. Omitted shares and rounding mean displayed rows do not sum to 100%.
Methodology
This research was conducted via online survey with 1,500 adults (age 18+) living in Canada from October 16 to 21, 2026.
A random sample of panelists were invited to complete the survey from a set of partner panels. These partners are typically double opt-in survey panels, blended to manage out potential skews in the data from a single source.
The margin of error for a comparable probability-based random sample of the same size is plus or minus 2.53 percentage points, 19 times out of 20.
The data were weighted according to census data to ensure that the sample matched Canada’s population. Totals may not add up to 100 due to rounding.
Abacus Data · Canadian Public Affairs Update · October 21, 2026 · n=1,500 · MoE ±2.53%
abacusdata.ca
Compared with our previous survey, the overall ranking of issues has changed relatively little.
Concern about the rising cost of living has increased one point, while concern about Donald Trump and his administration is unchanged at 40%.
The economy has declined three points to 34%, while housing affordability and accessibility has declined four points to 28%.
Concern about job security and unemployment has increased three points to 15%.
The broader pattern remains one in which Canadians are focused on a combination of domestic affordability pressures and the challenges associated with Canada’s relationship with the United States.
There are also some important regional differences.
In Atlantic Canada, 72% select the rising cost of living as a top-three issue.
The share is 69% in Alberta, 67% in British Columbia, 66% in Saskatchewan and Manitoba, 66% in Quebec, and 61% in Ontario.
The rising cost of living is therefore the most frequently selected issue in every region of the country.
Quebec continues to stand out when it comes to concern about Donald Trump and his administration.
Fifty-one percent of Quebecers select Trump and his administration as a top-three issue, compared with 40% nationally.
But the cost of living is now selected by 66% of Quebecers, leaving it 15 points ahead of concern about Trump.
Liberals Retain a Large Advantage on Trump, While Conservatives Lead on Immigration, Crime, and the Cost of Living
Our survey also asks Canadians which political party they think would do the best job dealing with the issues they identify as most important.
The results reveal substantial differences in how the parties are perceived across the public agenda.
Among Canadians who identify Donald Trump and his administration as one of their three most important issues, 67% think the Liberal Party would do the best job dealing with it, compared with 14% who select the Conservatives.
That represents a 53-point Liberal advantage.
It remains one of the largest differences between the two parties on any issue we measure.
The Liberals are also ahead among those concerned about the threat posed by China and Russia, with 51% selecting the Liberals and 27% the Conservatives.
On healthcare, 39% select the Liberals, compared with 21% for the Conservatives and 18% for the NDP.
On housing affordability and accessibility, the Liberals are selected by 31%, the Conservatives by 28%, and the NDP by 14%.
On the economy, however, the two parties are tied.
Forty percent of Canadians who identify the economy as a top-three issue think the Liberals would do the best job handling it, and the same proportion select the Conservatives.
And on the rising cost of living, the Conservatives hold a modest advantage.
Thirty-seven percent of those who identify the cost of living as a top issue think the Conservatives would do the best job dealing with it, compared with 32% who select the Liberals.
The Conservative advantage is much larger on some other issues.
Among Canadians who identify immigration as a top-three issue, 59% select the Conservatives as the party best able to handle it, compared with 13% who select the Liberals.
On crime and public safety, the Conservatives lead 55% to 24%.
On job security and unemployment, the Conservatives are selected by 38%, compared with 29% for the Liberals.
Optimism About Canada Holds at 47%, While Views of the World and United States Remain Deeply Negative
Forty-seven percent of Canadians believe the country is heading in the right direction, while 41% think Canada is on the wrong track.
Compared with our October 13 survey, the share who think Canada is heading in the right direction is unchanged, while the share who think it is on the wrong track has declined one point.
The balance of opinion remains more positive than negative, although fewer than half of Canadians believe the country is heading in the right direction.
And the contrast between how Canadians view Canada and how they view the rest of the world remains substantial.
Only 13% believe the world is heading in the right direction, while 74% think it is on the wrong track.
For the United States, just 12% believe the country is heading in the right direction, while 82% think it is on the wrong track.
The gap between optimism about Canada and optimism about the world is therefore 34 points.
The Upshot
Proposed commentary for Abacus Data CEO David Coletto:
“This is a particularly notable survey because the Liberals have reached a level of national support we haven’t measured in more than ten years.
At 48%, the Liberal Party is at its highest point in our tracking since April 2016.
That was during the early months of Justin Trudeau’s first government, when the Liberals were still enjoying the support that followed their 2015 election victory.
More than a decade later, we are seeing the party return to that level under Mark Carney.
And I think that is the most important finding in this survey.
The Liberals are now at 48%. The Conservatives are at 32%. The Liberal lead has widened to 16 points.
Government approval is back to 59%, while disapproval has fallen to 26%. Carney’s personal net impression has improved to +29, compared with -8 for Pierre Poilievre.
None of these individual movements is especially dramatic. But taken together, they point to a political environment in which the government continues to enjoy substantial public support, and where the Liberals have reached a historically high level of voting intention.
There are three things that stand out to me.
First, the continued strength of the Liberals is particularly notable given the economic and political environment in which this government is operating.
The cost of living remains the most important issue facing the country for almost two thirds of Canadians.
There is substantial concern about housing affordability, the economy, healthcare, and job security.
And Canadians are far from uniformly satisfied with how the government is responding to those pressures.
Only 31% approve of how the government is handling the cost of living and inflation. That’s down seven points from September.
Only 34% approve of its handling of housing affordability and supply, and 44% approve of its approach to jobs and economic growth.
These are not especially strong performance ratings on issues that matter a great deal to Canadians.
And yet, 59% approve of the government overall, and 48% of committed voters say they would vote Liberal.
That tells me Canadians are making a distinction between their assessment of specific policy outcomes and their broader assessment of the government and Prime Minister.
They may be dissatisfied with the cost of living or worried about the economy, while still feeling more positive about the overall direction and leadership of the government.
Second, the Liberals continue to have a very substantial advantage when it comes to managing Canada’s relationship with the United States.
Forty percent of Canadians still identify Donald Trump and his administration as one of the three most important issues facing the country.
And among those who identify it as a major concern, 67% think the Liberals would do the best job handling it, compared with just 14% who select the Conservatives.
That is an enormous difference.
It is also consistent with the government’s broader performance ratings.
Fifty-six percent approve of how the government is handling Canada’s relationship with the United States, and 54% approve of its handling of national defence and security.
These remain the two areas where the government receives majority approval.
So even as the cost of living dominates the public agenda, the relationship with the United States remains an important part of how Canadians are evaluating the federal government.
The central story of this survey is unmistakable.
More than a year and a half into Mark Carney’s time as Prime Minister, the Liberal Party is polling at its highest level in more than a decade, almost six in ten Canadians approve of the government, and the Prime Minister continues to have a substantially positive personal rating.
The striking thing is not that Canadians are satisfied with every aspect of the government’s performance.
It’s that substantial support for the government and the Liberal Party continues despite clear dissatisfaction with some of the country’s most pressing domestic challenges.”
Methodology
The survey was conducted with 1,500 Canadian adults from October 16 to 21, 2026.
A random sample of panellists was invited to complete the online survey from a set of partner panels. These partners are typically double opt-in survey panels, blended to help manage potential skews in the data from relying on a single source.
The data were weighted according to census data to ensure the sample matched Canada’s population.
The margin of error for a comparable probability-based random sample of the same size is plus or minus 2.5 percentage points, 19 times out of 20.
Totals may not add to 100 because of rounding.
The survey was paid for by Abacus Data.
About Abacus Data
We are Canada’s most sought-after, influential, and impactful polling and market research firm. We are hired by many of North America’s most respected and influential brands and organizations.
We use the latest technology, sound science, and deep experience to generate top-flight research-based advice to our clients. We offer global research capacity with a strong focus on customer service, attention to detail, and exceptional value.
And we are growing throughout all parts of Canada and the United States and have capacity for new clients who want high quality research insights with enlightened hospitality.
With offices in Halifax, Ottawa, Toronto, and now in Winnipeg following our acquisition of Probe Research, we can serve clients across the country.
Our record speaks for itself: we were one of the most accurate pollsters conducting research during the 2025 Canadian election following up on our outstanding record in the 2021, 2019, 2015, and 2011 federal elections.
Contact us with any questions.
Find out more about how we can help your organization by downloading our corporate profile and service offering.