
Stability analysis, morphological characterization, and Colchicine release evaluation of nanoparticles in biological and physiological environments
The polymer for the preparation of NPs was synthesized by ring-opening polymerization of lactide in the presence of the catalyst/initiator system composed of tin (II) octoate/methylated-β-cyclodextrin (MβCD)9. In the applied condition, a star-shaped homopolymer of lactide with a MβCD core was successfully achieved (Supplementary Data, Fig. 1S). The molar mass of the polymer and the number of average arms were estimated by using size-exclusion chromatography (Mn= 12,000 g/mol) and 1H NMR (Mn= 7000 g/mol). The comparison of molar masses obtained from these two methods allows for the estimation of the average number of arms in the polymer as 7.
A dynamic light scattering (DLS) apparatus was utilised to determine the sizes of two types of nanoparticles: empty nanoparticles (NPs) and colchicine-loaded nanoparticles (NPs-C). The results, shown in Fig. 1A, indicate that both types of nanoparticles, prepared from MβCD-PLA and colchicine, have monomodal size distributions. The average size of the NPs-C was found to be 210 nm (PDI = 0.068, ζ= -25.3 mV), while the NPs measured an average size of 230 nm (PDI = 0.077, ζ = -34 mV). Furthermore, FTIR analysis was conducted on the NPs, NPs-C, and pure colchicine to confirm the successful encapsulation of colchicine within the nanoparticles. Figure 2S in the Supporting Information displays the spectra for pure colchicine (blue line), NPs (green line), and NPs-C (red line). The FTIR spectrum of NPs-C exhibits characteristic signals of PLA at 1750 cm–1, along with additional peaks in the 1700–1300 cm–1 range corresponding to colchicine, confirming its presence in the formulated nanoparticles.
A key parameter for characterizing these nanoparticles is their long-term stability, which significantly impacts their applicability. The stability of the nanoparticles was assessed over 12 days. Measurements revealed slight variations in particle size, ranging between 200 nm and 240 nm, as illustrated in Fig. 1B.
Transmission electron microscopy (TEM) played a crucial role in visualizing and morphologically characterizing both empty nanoparticles (NPs) and colchicine-containing nanoparticles (NPs-C). As shown in Fig. 1C, TEM images confirm the DLS measurements in terms of the differences in nanoparticle size, both empty and loaded with colchicine. However, it should be noted that the nanoparticles appear smaller in TEM (NPs-99.86 nm and NPs-C-85.19 nm) compared to the DLS measurements. Importantly, TEM only measures the solid core, while DLS considers the hydrodynamic diameter, which includes solvent layers, surface coatings, and any aggregations10. Furthermore, the drying process during TEM can lead to shrinkage or collapse of softer coatings, which can further decrease the apparent size of the nanoparticles.
Fig. 1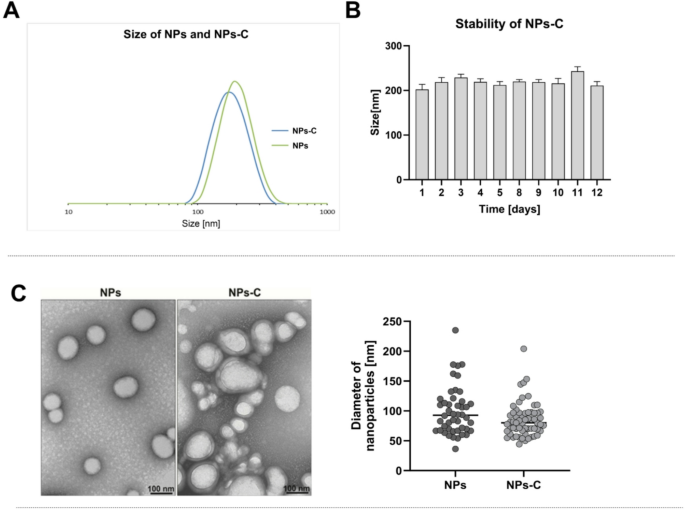
Characterization of nanoparticles: A/ The size and B/ Stability measured by Dynamic Light Scattering; C/ Representative TEM images show the morphology and diameter of nanoparticles. NPs – empty nanoparticles; NPs-C – colchicine-loaded nanoparticles.
In vitro testing of cytocompatibility for nanoparticles
The metabolic activity and viability of cells exposed to empty or colchicine-loaded nanoparticles (NPs and NPs-C, respectively) were assessed using the MTT salt reduction assay, following the ISO 1099-3-2009 standard for substances with potential biomedical applications. The metabolic activity of the cells, which reflects their viability after incubation with the nanoparticles, was expressed as a percentage and compared to a positive control, consisting of untreated cells with 100% metabolic activity/viability (C+). The assay also included the control of cells cultured in the presence of 0.1% H2O2 (all cells were destroyed, C-). According to ISO 1099-3-2009, substances intended for biomedical use are considered safe if they do not reduce the metabolic activity of mouse fibroblasts L929 below 70% in an in vitro model. This approach allowed for the testing of empty nanoparticles (NPs) to assess their cytotoxicity over a concentration range of 0.05 to 2.50 mg/mL. The results indicate that the preparation met the safety criteria for cells in the concentration range from 0.05 to 1.88 mg/ml; however, cells cultured in the presence of NPs at concentrations from 0.21 mg/ml showed full metabolic activity (Fig. 2A). Based on the obtained results, nanoparticles in the concentration of 0.21 mg/ml were used to encapsulate colchicine in the NPs-C complex.
The results in Fig. 2B–D refer to the cytotoxicity test of colchicine-loaded nanoparticle preparations against selected eukaryotic cells within 24 h. Thus, nanoparticles loaded with colchicine (NPs-C) at drug concentrations ranging from 0.03 to 0.50 mg/ml did not exhibit cytotoxic effects on L929 and HUVEC cells. In contrast, for the LoVo cell line, NPs-C were safe at concentrations ranging from 0.03 to 0.10 mg/ml.
Fig. 2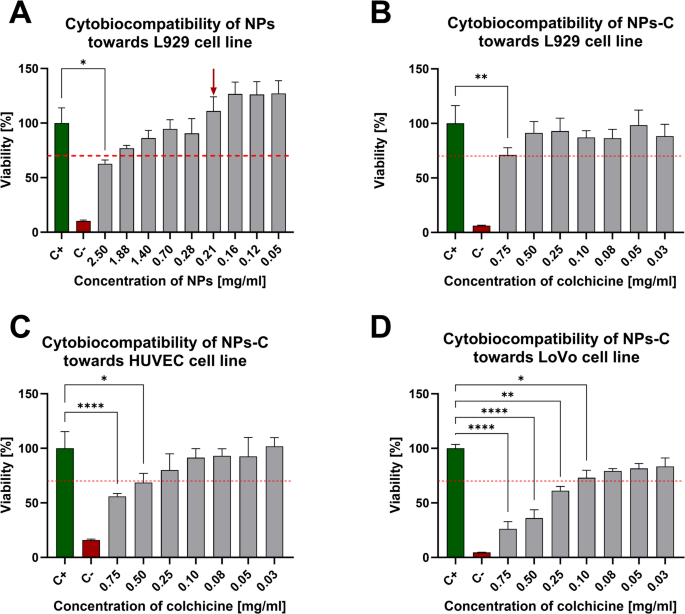
Metabolic activity of L929 cells treated with empty nanoparticles (NPs) for 24 h – A/. Metabolic activity of various cell lines: L929 – B/, HUVEC primary cells – C/, and LoVo cells – D/ stimulated with colchicine-loaded nanoparticles (NPs-C) for 24 h – C+ – untreated cells, C- cells treated with 0,1% H2O2. Results are presented as the mean values ± SD. Statistical analysis for graph A, B, C, D was performed using Kruskal–Wallis non-parametric test followed by Dunn’s post-hoc multiple comparisons test, n ≥ 4; ns – p > 0.05, (*) – p ≤ 0.05, (**) – p ≤ 0.01, (***) – p ≤ 0.001, (****) – p ≤ 0.0001.
Although short-term exposure of eukaryotic cells to colchicine (24 h) does not cause changes in cell metabolic activity in the concentration range of 0.03–0.5 mg/ml (Fig. 3S), the potential adverse effects of colchicine on cells during long-term exposure (72 h). The study evaluated the metabolic activity of selected eukaryotic cells (L929, HUVEC, LoVo) cultured for 72 h with colchicine-containing nanoparticles (NPs-C), and the results were compared with those obtained for colchicine that was never included in the carrier. The results (Fig. 3A, B) show that L929 and HUVEC eukaryotic cells exposed to free colchicine for 72 h experienced a significant loss of metabolic activity at concentrations ranging from 0.10 to 0.50 mg/mL.
Fig. 3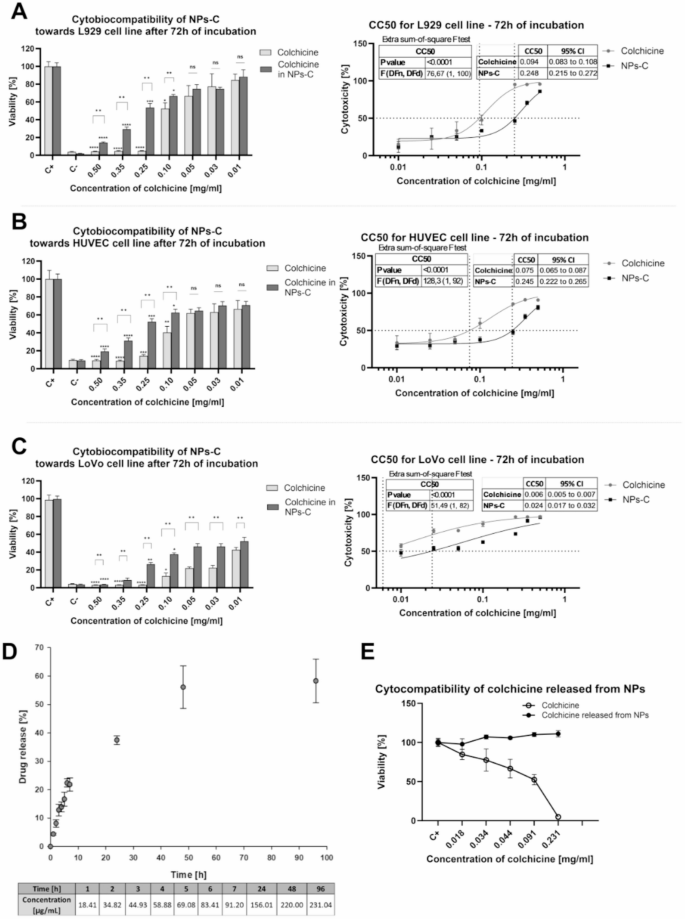
The effect of nanoparticles loaded with colchicine (NPs-C) and free colchicine (C) on the metabolic activity of various eukaryotic cell lines: (A) L929, (B) HUVEC, and (C) LoVo after 72 h of exposure. C+ – untreated cells, C– cells treated with 0.1% H2O2. D/ The release of colchicine from nanoparticles (NPs-C) over a 96-hour period. The table includes the average concentrations of colchicine released from NPs-C at each time point. E/ The effect of free colchicine and colchicine released from nanoparticles (NPs-C) on the metabolic activity of L929 cells after 72 h of exposure. Results are presented as the mean values ± SD, n ≥ 4. Statistical analysis for cytobiocompatibility on A, B, and C graphs was performed to compare cell viability values for free colchicine and NPs-C at each concentration separately using multiple Mann-Whitney tests with a two-tailed p-value, and Holm-Šídák multiple comparisons correction. Adjusted p-values are reported above brackets. Moreover, a Kruskal-Wallis test with Dunn’s post-hoc multiple comparisons test was performed to compare each concentration of free colchicine or NPs-C with untreated cells (C+); adjusted p values are reported above the bars. An extra sum-of-squares F test was performed to compare best-fit CC50 values for each cell line, and the p-value is reported on the graphs. ns – p > 0.05, (*) – p ≤ 0.05, (**) – p ≤ 0.01, (***) – p ≤ 0.001, (****) – p ≤ 0.0001.
Colchicine encapsulated in nanoparticles was found to be safer for all three tested cell lines, allowing the cells to maintain their metabolic activity. However, in the case of LoVo cells, free colchicine was toxic over a wide range of exposure concentrations (0.01–0.50 mg/ml). While it is true that approximately 50% cell viability was observed in LoVo cells after 72 h of exposure to NPs-C, this does not contradict our conclusion. On the contrary, the comparative analysis reveals a substantial reduction in toxicity and a notable improvement in cytocompatibility when colchicine is delivered via nanoparticles compared to its free form. Based on the data obtained, the concentration of colchicine, free or complexed with NPs-C, that caused a cytotoxic effect in 50% of cells (50% cell cytotoxicity – CC50) was calculated (Fig. 3A–C). Statistical analysis of CC50 values showed that the CC50 of NPs-C is significantly higher than that of colchicine CC50, with a p-value < 0.0001 for each cell line.
UV-VIS spectroscopy with a Flot-a-layer membrane with a cutoff of 3000 was used to study the release of colchicine from the NPs-C complex. Colchicine was encapsulated in the carrier at a concentration of 0.40 mg/ml (400 µg/ml), which was demonstrated to be safe for L929 reference cells (Fig. 2B). The encapsulation efficiency and drug loading were calculated to be 30% and 75%, respectively. The results obtained in the colchicine release study from the complex (Fig. 3D) indicate that release can be rapid within the first 7 h, which can be attributed to the release of the drug from the polymer surface of the NPs (the concentration of released colchicine after 7 h was 91.20 µg/ml). After 48 h, release tends to plateau. The concentration of colchicine in the incubation fluids was measured as 220.00 µg/ml after 48 h and 231.04 µg/ml after 96 h. The table below provides detailed information on colchicine concentration at each time point within this time frame (see Fig. 3D). It is worth noting that approximately 60% of the drug concentration is released from the nanoparticles into the reaction environment at 72 h. Therefore, the NPs-C complex can be considered colchicine bound/released from NPs-C.
Since colchicine bound/released from nanoparticles appears to be safer for eukaryotic cells during prolonged exposure, an experiment was conducted to compare the metabolic activity of L929 cells after 72 h of incubation with unbound colchicine and colchicine released from nanoparticles (Fig. 3E). The highest concentration of colchicine released from the carrier (NPs-C) used in the experiment was 231 ug/ml, which is the concentration of colchicine released from nanoparticles after 96 h (see Fig. 3D – release of colchicine from the NPs-C complex). The results indicate (Fig. 3E) that colchicine released from nanoparticles (NPs-C) was safe for L929 cells within the tested concentration range of 0.018 to 0.231 mg/mL, in contrast to colchicine that was never bound to the carrier and was present in the experiment at similar concentrations. L929 cells cultured in unbound colchicine at a concentration of 0.231 mg/ml completely lost their metabolic activity, which may indicate the high toxicity of the preparation in long-term exposure.
Microscopy based cytobiosafety evaluation of colchicine-loaded nanoparticles in cells
A preliminary assessment of the cytobiosafety of colchicine bound/released from nanoparticles (NPs-C in THP-1 cells was conducted using light microscopy. The material, fixed and embedded in Epon-Spurr resin, was cut into semi-thin sections and placed on glass slides. These sections were stained and analyzed in transmitted light to evaluate the morphology of at least 100 cells. Representative images of cells from each experimental condition are shown in Fig. 4.
Fig. 4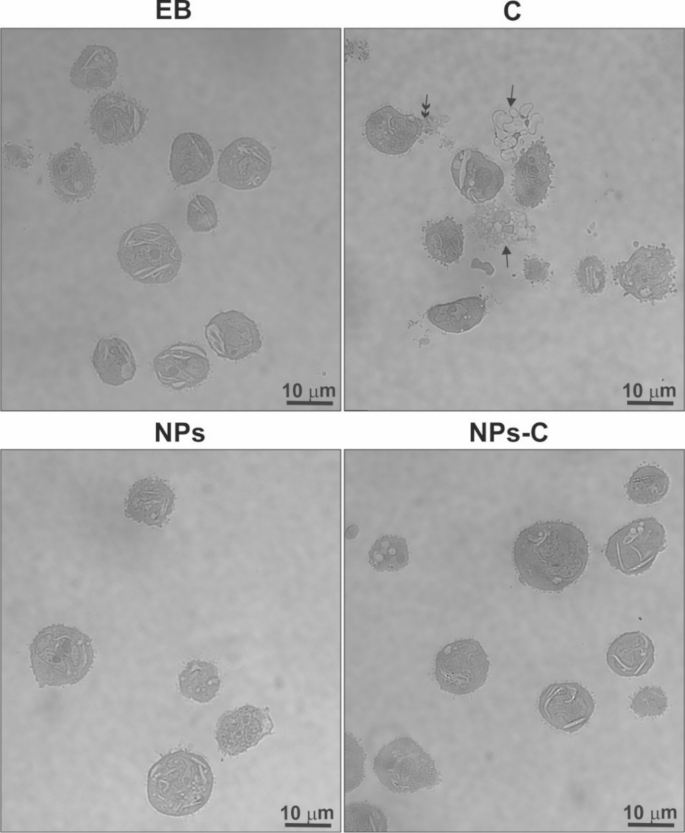
THP-1 cell morphology assessed by light microscopy on semi-thin sections of Epon-Spurr resin-embedded material. In colchicine-treated material, many cells appeared to be destroyed (solid arrow) or partially disrupted (double arrow). EB – experimental buffer; C – colchicine; NPs – empty nanoparticles; NPs-C – colchicine-loaded nanoparticles.
The results indicate that only colchicine, never bound to the carrier, caused significant damage to THP-1 cells during the 1.5-hour treatment period. Many cells appeared either destroyed or partially damaged, as indicated by a solid and a double arrow, respectively (Fig. 4). In contrast, THP-1 cells treated with colchicine bound to/released from the NPs-C, as well as those treated with empty nanoparticles, exhibited morphology similar to that of the control cells. The concentration of free colchicine used in the experiment corresponded to that released from the complex after approximately 2 h, which was measured at 34.82 µg/ml (see Fig. 3D).
TEM is utilized in biosafety studies to provide high-resolution images of cellular ultrastructure and the interactions between nanoparticles and cells at the nanometer scale. This imaging technique facilitates the assessment of cytotoxic effects, determination of intracellular localization, and identification of any potential structural damage caused by the substances being tested. Such detailed visualization is essential for evaluating biocompatibility and identifying potential hazards in biomedical applications.
TEM analysis showed that THP-1 cells cultured with nanoparticles (NPs, Fig. 5C, D) exhibited a similar ultrastructure to the control cells (Fig. 5A, B). Both cell types were comparable in size, shape, granularity, and displayed lobate nuclei (Fig. 5A, C). The membranes of cells from both groups exhibited some ruffling, and numerous pseudopodia were visible (Fig. 5A, B). A few small vacuoles were primarily located in the peripheral regions of the cells (Fig. 5A, C). The cytoplasm contained many Golgi apparatus (GA) cisternae, abundant vesicles, and mitochondria, which displayed an electron-dense matrix and numerous cristae (Fig. 5B, D). Small, opaque lysosomes were observed near the Golgi apparatus (Fig. 5D), and endoplasmic reticulum (ER) cisternae were scattered throughout the cytoplasm (Fig. 5B).
Fig. 5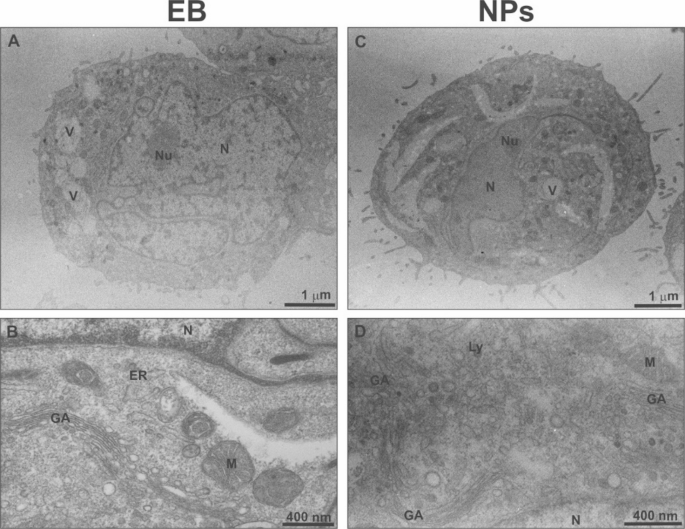
Representative TEM images of THP-1 cells cultured for 1.5 h in experimental buffer (EB) and in the presence of empty nanoparticles (NPs). N – nucleus, Nu – nucleolus, V – vacuole, M – mitochondrium, GA- Golgi apparatus, Ly – lysosome, ER – endoplasmic reticulum.
As illustrated in Fig. 6, most of the THP-1 cells treated for 1.5 h with colchicine, which did not bind to the carrier, were severely damaged. These cells exhibited significant vacuolation, and aside from the cell nucleus, only a few cellular organelles were retained in the cytoplasm (see Fig. 6A). Some cells showed a low degree of vacuolization and had dense cytoplasm. However, their plasma membrane was disrupted (Fig. 6B, arrow) and formed plasmalemma blebbing (Fig. 6B, asterisk). No Golgi apparatus cisternae were seen in highly vacuolated cells, and mitochondria were shrunken with a very electron-dense matrix and swollen cristae; moreover, the perinuclear space ballooned at a large region (Fig. 6C, arrow). Numerous endosomes and lysosomes indicated an advanced autophagy process (Fig. 6D). Colchicine bound to/released from the NPs-C did not cause such degenerative changes in the ultrastructure of THP-1 cells as free colchicine (Fig. 6E-H). Cells treated with colchicine bound to/released from the NPs-C were similar in size, shape, and ultrastructure to control and those treated with empty NPs (Figs. 5A and C and 6E). Some cells had slightly changed shape, were distended, and contained large vesicular inclusions within the peripheral region of the cytoplasm. Moreover, the number of pseudopodia in these cells was reduced (Fig. 6F). In the cytoplasm were numerous mitochondria with a standard structure and regular ER cisternae (Fig. 6F-H). Numerous lysosomes (Fig. 6G, H) and single endosomes (Fig. 6G) were noticed in some cells. The cell nucleus and nuclear envelope showed no disturbances (Fig. 6E, F, H). Golgi apparatus cisternae were rarely observed; however, in many cells, small, numerous GA vesicles were present (Fig. 6H, arrows).
Fig. 6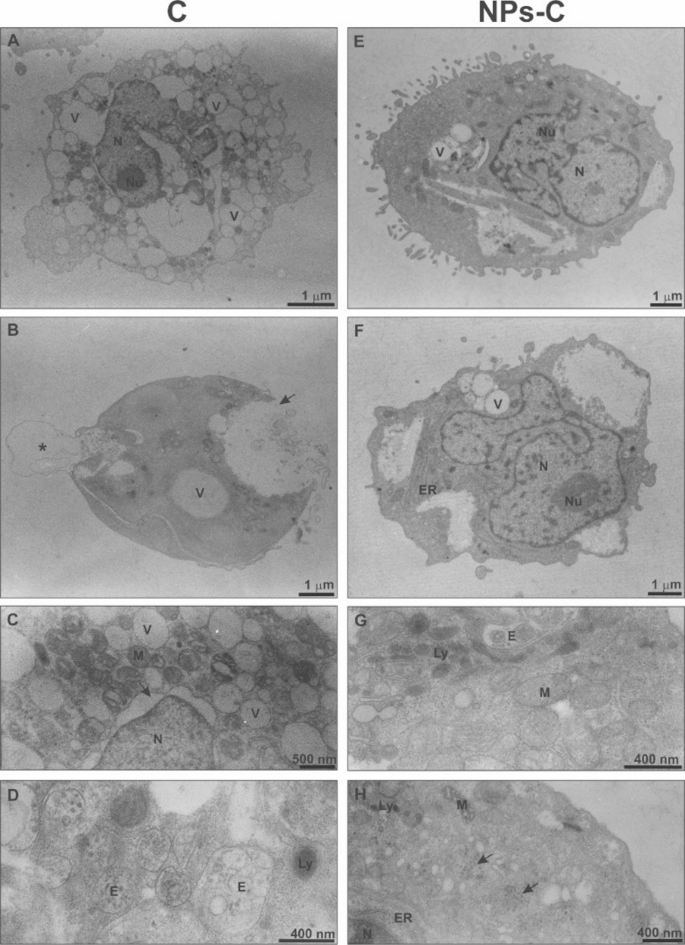
Representative TEM images of THP-1 cells incubated for 1.5 h with free colchicine (C) or colchicine-loaded nanoparticles (NPs-C). Many colchicine-treated cells were almost wholly damaged (6 A) or highly disrupted (6B, C) with numerous endosome vesicles (6D). Encapsulated colchicine didn’t cause degenerative changes in the cell ultrastructure (6E-H). N – nucleus, Nu – nucleolus, V – vacuole, M – mitochondrium, GA- Golgi apparatus, Ly – lysosome, ER – endoplasmic reticulum, E – endosome.
Evaluation of survival, body weight dynamics, and biosafety of colchicine-loaded nanoparticles in vivo
Mice were monitored for survival and changes in body weight following intraperitoneal administration of 12 doses (one dose every three days) of one of the following: colchicine encapsulated in nanoparticles (NPs-C), empty nanoparticles (NPs), free colchicine (C), or experimental buffer (EB) serving as a negative control. The experimental buffer consisted of 0.85% sodium chloride (NaCl) mixed with the vehicle used for nanoparticle synthesis, which was 5% N-methylpyrrolidone in sterile water for injection. The concentration of colchicine unbound to the carrier (C) and that encapsulated in nanoparticles (NPs-C) was ready to correspond to the concentration of the drug approved by the FDA for treating cardiovascular events (0.5 mg daily). Each test group of mice consisted of ten individuals with an equal sex distribution—five females and five males. The route of administration was intraperitoneal (IP) since it leads to systemic drug exposure comparable to intravenous (IV) injection due to rapid adsorption through the highly vascularized peritoneal membrane into the bloodstream. Empirical evidence supports that IP administration can produce pharmacological and toxicological outcomes consistent with systemic delivery11,12.
It was observed (Fig. 7A) that animals receiving colchicine encapsulated in nanoparticles (NPs-C) or empty nanoparticles (NPs) displayed behaviours similar to those of the control group (EB). In contrast, animals administered free colchicine (C) died within three days of the start of the experiment, and their deaths were associated with a significant decrease in body weight. The free colchicine group experienced weight loss exceeding 20% of their initial body weight (Fig. 7B), with male mice showing a tendency to lose more weight than females (Fig. 7B). This observed effect may indicate that the C57BL/6 strain of mice is susceptible to colchicine, even though the concentration administered did not exceed 1.47 mg/kg, which is only 25% of the LD50 value for colchicine13. Considering the mice’s body weight, this dose did not exceed 0.03 mg per dose (1.2 mg/kg).
After the animals were euthanized (using 12 doses of the preparation), we isolated their blood and organs, including the liver and spleen. These were weighed and assessed for size within their respective study groups. Additionally, photographs were taken to evaluate their appearance (not shown). It is important to note that due to the premature death of animals in the group receiving free colchicine, we were unable to collect organs and blood from this group.
The results shown in Fig. 7 illustrate the average ratio of liver or spleen (Fig. 7C) weight to the total weight of the animals, expressed as a percentage of organ weight relative to total body weight%. The percentage of liver and spleen weight to total body weight in the NPs, NPs-C, and control (EB) groups did not show any significant differences, nor did they vary between the sexes of the animals studied. However, one female in the NPs-C treated group exhibited a single instance of increased spleen weight. No noticeable changes were observed in the organs of the animals across all tested groups.
Fig. 7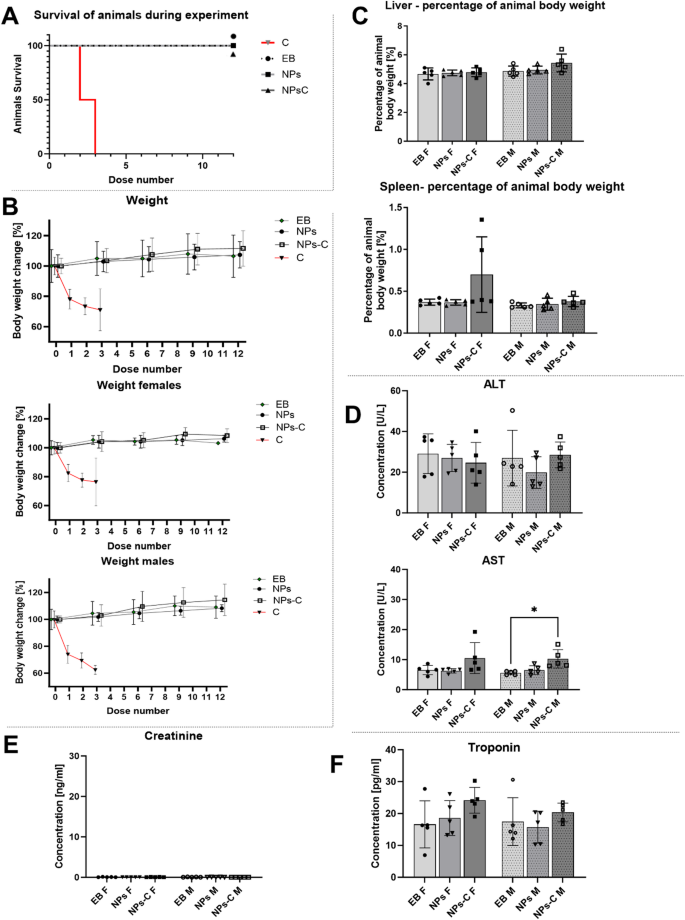
Biosafety of nanoparticles loaded with colchicine (NPs-C) in vivo. The survival evaluation – A/ and body weight change – B/ of animals receiving experimental buffer (EB, negative control), nanoparticles (NPs), colchicine-loaded nanoparticles (NPs-C), or free colchicine (C). The percentage of liver and spleen weight relative to total body weight – C/. The concentration of ALT and AST in the sera of animals – D/. The concentration of Creatinine in the sera of animals – E/. The concentration of Troponin Type 1 in the sera of all animal groups – F/. NPs-C – nanoparticles loaded with colchicine, NPs – empty nanoparticles, EB – experimental buffer, F – female, M – male. Results are presented as the mean values ± SD. Statistical analysis for liver and spleen weight was performed by one-way ANOVA and Šídák’s multiple comparisons test. Statistical analysis for graphs D, E, and F was performed using the Kruskal–Wallis non-parametric test, followed by Dunn’s post-hoc multiple comparisons test. ns – p > 0.05, (*) – p ≤ 0.05, (**) – p ≤ 0.01, (***) – p ≤ 0.001, (****) – p ≤ 0.0001. For each group of animals, n = 5.
The concentrations of the liver enzymes alanine aminotransferase (ALT) and aspartate aminotransferase (AST), which are established markers of hepatotoxicity, were measured in the sera of animals exposed to colchicine-containing nanoparticles (NPs-C), empty nanoparticles (NPs), or a control buffer (EB). The results (Fig. 7D) showed no statistically significant differences in ALT enzyme levels between the animals treated with colchicine-containing nanoparticles (NPs-C) and the control group (EB), which received the experimental buffer or were exposed to empty nanoparticles (NPs). This lack of difference was consistent regardless of the sex of the animals.
Similar results were observed for the AST enzyme, but only in female animals. In contrast, a slight but statistically significant increase in AST concentration was noted in the male group receiving NPs-C when compared to the control group (EB). However, all values obtained for the liver enzymes tested remained within the reference range recognized for Mus musculus species, not exceeding 221 U/L.
Additionally, creatinine concentrations were measured in the serum of the animals to evaluate the effect of colchicine-loaded nanoparticles (NPs-C) on renal function. The results, presented in Fig. 7E, show that the creatinine concentration in the serum of all animals (both sexes) remained below 0.156 U/L, which is the lowest but still measured value in the creatinine standard test. Therefore, these results indicate that NPs-C does not have any nephrotoxic effects in the in vivo system.
Finally, the cardiac troponin type 1 concentration was measured in serum isolated from the animals. Troponins are proteins that form part of the troponin-tropomyosin complex found in the thin fibers of cardiomyocyte myofibrils. The presence of troponins in serum indicates myocardial damage resulting from acute ischemia caused by mechanical, viral, or chemical stimuli14,15. Due to the high concentration of troponins in cardiomyocytes, even minor tissue damage can lead to increased serum concentrations. The results shown in Fig. 7F indicate that there were no statistically significant differences in the levels of cardiac troponin type 1 among the groups of animals treated with NPs-C, NPs, or EB control animals. This observation was consistent for both male and female mice, with the cardiac troponin levels in all animal sera not exceeding 30 pg/ml. In humans, elevated levels of cardiac troponin are typically considered to range from 30 pg/ml for asymptomatic damage to 200 pg/ml for myocardial damage14.
Colchicine-encapsulated nanoparticles: heart distribution and effectiveness in macrophage foam cell development in vitro
To investigate the accumulation of colchicine-loaded nanoparticles (NPs) in organs, an experiment was conducted using NPs-C, which were pre-labeled with pyrene, a fluorescent compound. Preliminary in vitro studies with these nanoparticles showed that they did not exhibit cytotoxic effects against mouse L929 fibroblasts, as assessed by a test measuring metabolic activity by evaluating the reduction of MTT salt (Supplementary Data Fig. 2S).
The accumulation of NPs and NPs-C (pre-labeled with pyrene) in the hearts and livers of mice that received NPs, NPs-C, or experimental buffer (EB) was examined using thin paraffin section (3 μm) of the examined organs. Despite excluding the toxicity of pyrene-labeled preparations in vitro (Supplementary Fig. 5S), they were administered to animals in three doses at three-day intervals. The selection of organs for biodistribution analysis of the tested preparations is related to the liver’s cleansing function in the body and the potential use of NPs-C in the treatment of ASCVD.
Thin-layer preparations of heart tissues (non-stained or stained with haematoxylin and eosin) were analysed using a Leica MICA WideField fluorescence microscope, which allowed for simultaneous imaging of the same tissue sections under transmitted light. Pyrene fluoresces in the 365/480 nm range, while colchicine fluoresces in the 365/435 nm range. By using a detection wavelength of 365/454 nm, we observed fluorescence from both the empty nanoparticles and the encapsulated colchicine.
Our analysis showed that both empty nanoparticles (NPs) and colchicine-loaded nanoparticles (NPs-C) accumulated in the hearts of animals, regardless of their sex. The results in Fig. 8A indicate that fluorescence signals were detected in animals injected with empty NPs and NPs-C. In animals that received NPs-C, this suggests that the emitted fluorescence resulted from the combined action of nanoparticles and colchicine. However, this finding did not significantly alter the overall results, as shown in Fig. 8A. Fluorescence intensity scans revealed that the highest intensity was observed in the hearts of male mice. The results for those treated with empty nanoparticles labeled with pyrene were statistically significant compared to the control group (Fig. 8A and B). Similar observations were made for female mouse heart preparations; however, the differences in fluorescence intensity between the control group and the NPs- or NPs-C-treated group were not statistically significant.
The nanoparticles, NPs and NPs-C, that accumulated in the livers of animals exhibited weaker fluorescence compared to those in the hearts. This difference may be attributed to variations in tissue structure, as the liver has a more parenchymal composition. Additionally, it could result from insufficient exposure to the preparations, as only three doses were administered, along with the liver’s strong cleansing properties (Supplementary data Fig. 6S).
Fig. 8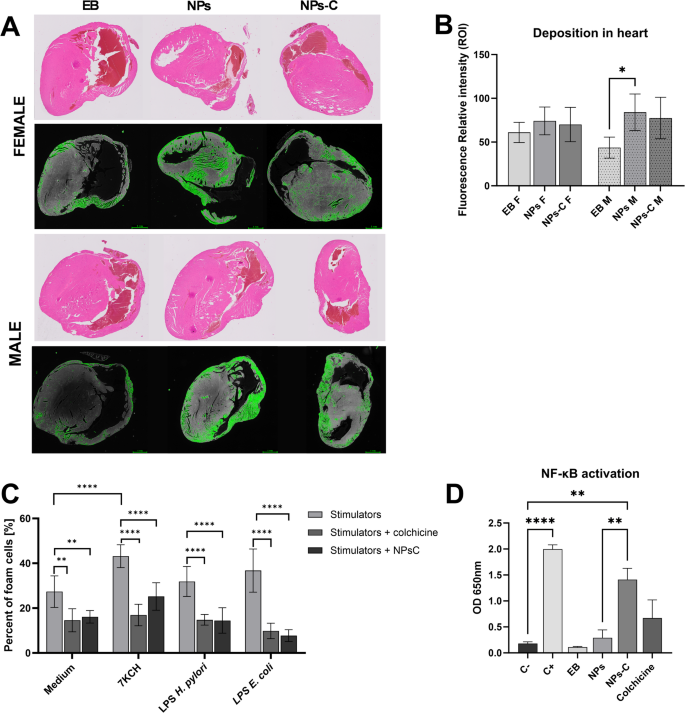
Deposition of empty and colchicine-loaded nanoparticles in the heart – A/. Representative images showing thin-layer paraffin sections of heart tissue, stained with haematoxylin and eosin and photographed in transmitted light or non-stained and photographed under a fluorescence microscope. The fluorescence intensity was calculated using the photographs in ImageJ – B/. Transformation of THP1 macrophages into foam cells upon stimulation with: medium, 7KCH, bacterial lipopolysaccharides: Helicobacter pylori (LPS H.pylori) or Escherichia coli (LPS E.coli) in the presence of free and loaded into nanoparticles colchicine – C/. NF-κB pathway in THP-1 blue cells treated with NPs, NPs-C, or Colchicine for 24 h – D/. NPs-C – nanoparticles loaded with colchicine, NPs – empty nanoparticles, EB – experimental buffer, F – female, M – male, 7KCH – 7 7-ketocholesterol. Results are presented as the mean values ± SD. Statistical analysis for graph B was performed using one-way ANOVA, and post-hoc Šídák multiple comparisons test, n = 5; Statistical analysis for graph C was performed with two-way ANOVA followed by post-hoc Šídák multiple comparisons test n = 6; Statistical analysis for graph D was performed using Brown-Forsythe and Welch ANOVA test, and post-hoc Dunnett’s T3 multiple comparisons test, n = 4–6. ns – p > 0.05, (*) – p ≤ 0.05, (**) – p ≤ 0.01, (***) – p ≤ 0.001, (****) – p ≤ 0.0001.
The development and progression of atherosclerosis are primarily driven by the accumulation and activity of foam cells, which play a central role in forming lesions. Previous research16 indicates that soluble bacterial components, such as lipopolysaccharides from E. coli or H. pylori, encourage the transformation of macrophages into foam cells, similarly to the effect of 7KCH. It was decided to use the in vitro model that had been developed16. To evaluate the ability of both free colchicine and colchicine bound/released from NPs-C to regulate this process. Foam cell formation was assessed by oil-red O staining.
As shown in Fig. 8C, colchicine bound/released from NPs-C significantly inhibited the transformation of macrophages into foam cells induced by the oxidized form of cholesterol-7KCH or infectious agents: LPS H. pylori or LPS E. coli. The transformation of macrophages into foam cells induced by 7KCH was reduced by free colchicine or colchicine bound/released from nanoparticles from 43.2 to 16.9% or 25.2%, respectively. The spontaneous transformation of macrophages into foamy cells was also attenuated by exposing cells to free colchicine or an NP-C preparation. A similar trend was observed with bacterial stimulants such as H. pylori or E. coli LPS. In the case of H. pylori LPS, the transformation decreased from 31.9 to 14.8% with free colchicine and 14.5% with NPs-C. In the case of E. coli LPS, the transformation decreased from 36.7 to 9.8% with free colchicine and 7.7% with NPs-C. The results presented in Fig. 8C indicate that colchicine, when bound to NPs-C nanoparticles, can inhibit the transformation of macrophages into foam cells, similarly to the effects of free colchicine. However, colchicine that is not bound to the carrier causes changes at the cellular level in THP-1 macrophages after just 1.5 h of exposure (see Fig. 6).
The study also tested the activation of the NF-κB signaling pathway in macrophages using THP1-Blue™ cells, which are specifically designed to monitor the activation of the NF-κB transcription factor. This was assessed by measuring the activity of embryonic alkaline phosphatase (SEAP), as these cells contain a reporter gene for this purpose. The test involved empty nanoparticles at a concentration deemed safe for eukaryotic cells (0.21 mg/mL) to eliminate any potential pro-inflammatory effects that could arise from LPS-endotoxin contamination. The results (see Fig. 8D) indicate that no activation of the NF-κB transcription factor was observed in the reporter cells cultured with the nanoparticles or those treated with the experimental buffer (EB). It is interesting that colchicine, not bound to a carrier, as well as released/bound to nanoparticles (NPs-C) at the concentration tested in in vitro studies (see Fig. 3E), stimulated the activation of the transcription factor NF-κB in reporter cells (Fig. 8D). Although the stimulation is not as intense as after the positive control LPS E. coli (C+), it is significantly higher than the negative control (untreated cells C-).