
Accuracy
In survey analysis, a common concern is the accuracy with which the survey sample aligns with the socio-demographic and political characteristics of the target population, in our case the citizens eligible to vote in Austrian parliamentary elections. Ensuring accuracy is essential as it supports the credibility of inferences about population trends, political attitudes, and electoral behavior drawn from the data. Deviations from target distributions can arise, particularly for populations that are traditionally more difficult to reach in online or political surveys, such as individuals of old age, those with low education, migration backgrounds, or non-voters.
Accuracy is commonly assessed using the Root Mean Squared Error (RMSE), which quantifies deviations between observed values and target distributions16. As illustrated in Fig. 2, the raw data from the AUTNES Online Panel Study4 demonstrate high overall accuracy, with the average RMSE across all categories typically below 0.05, corresponding to an average deviation of 5 percentage points from the target.
Fig. 2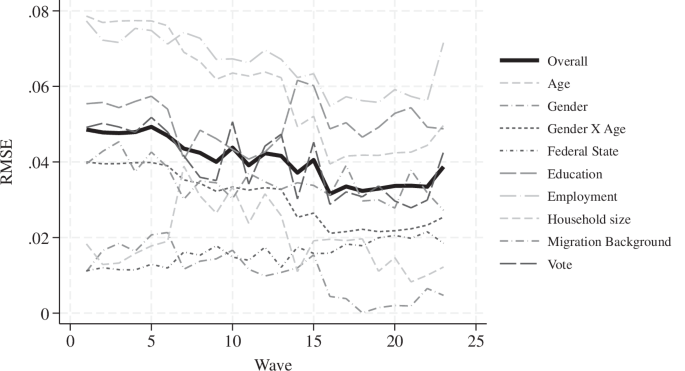
Accuracy of the Raw Unweighted Data Versus Population Targets.
Initial deviations were most pronounced for age and employment status due to underrepresentation of the oldest age cohorts and pensioners, but still these deviations remained below 0.08 averaged across the age groups. Over successive survey waves, the RMSE decreased, reflecting improved sample accuracy, primarily through better coverage of older age cohorts and retirees, indicating that the online panel became increasingly better in capturing all age groups. Due to this trend, the raw sample composition in more recent waves aligns increasingly closely with the target distributions. A comprehensive methodological comparison of the 2024 post-election wave of the AUTNES Online Panel Study and the probability-based Digitize! CSES Post-Election Survey17 further shows that the AUTNES non-probability panel achieved comparable or higher accuracy on key sociodemographic and political indicators and was also more effective in reaching non-voters and individuals with very low levels of political interest18.
To further enhance accuracy and representativeness, weights were calculated using Iterative Proportional Fitting (IPF)19. Weights adjust the sample to match the following target distributions:
Age: 6 levels
Gender: 2 levels
Age X Gender: 12 levels
Education: 5 levels
Federal State: 9 levels
Employment Status: 4 levels
Household Size: 3 levels
Migration Background: 2 levels
Vote Recall (incl. turnout and party choice): 7-8 levels
The dataset includes two weighting variables for post-stratification adjustment to known population distributions:
Demographic weight (w*_weightd): The “demographic” weight adjusts the sample to known socio-demographic population distributions. These weights are ideal for consistent comparisons across time.
Demographic + political weight (w*_weightp): The “political” weight further adjusts for turnout and vote choice marginals using reported voting behavior in the most recent elections. These weights are particularly suited for post-election analyses to accurately reproduce official election results.
Weighting variables were computed using the Stata module “ipfweight”, with values constrained to a minimum of 0.2 and a maximum of 5.020. Missing values in the target variables were weighted neutrally. The target values are based on the Austrian Mikrozensus and official election results provided by the Austrian Federal Ministry of the Interior (BMI). Across the 23 survey waves, the design effect of the demographic weights ranges from 1.26 to 1.81, with an average of 1.46. For the combined demographic and political weights, design effects range from 1.29 to 2.01, averaging 1.55. These values indicate a moderate increase in variance due to weighting, within the typical range observed for adjusted survey samples. Overall, the application of the weights is therefore recommended when analyzing the dataset, as it effectively adjusts for known deviations from population benchmarks while introducing only a modest reduction in statistical efficiency.
To sum up, while some deviations persist for certain hard-to-reach groups, the raw data demonstrates fairly high accuracy, shows improvement over time, and can be further refined through the application of the provided survey weights. However, data users should exercise some caution when interpreting results for specific subgroups or outcomes directly influenced by factors such as the online mode, undercoverage, or non-response in (political) surveys21,22.
Panel retention and refreshment samples
Panel retention is a critical aspect of longitudinal panel surveys as it can potentially introduce nonresponse bias and thus influence the quality of the data over time23. High retention rates also ensure that changes in attitudes and behaviors within respondents can be tracked consistently across waves, while refreshment samples are essential to maintain representativeness, especially when certain demographic groups drop out at higher rates24.
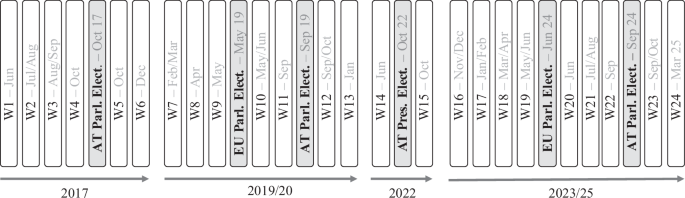
Figure 3 illustrates panel retention across the 23 waves of the AUTNES Online Panel Study4. Each bar represents the total number of respondents per wave, shaded by the wave in which they entered the panel. The gradual decline in respondents from the initial recruitment (Wave 1, shown in light grey) shows a typical pattern of panel attrition over time. To account for expected attrition while maintaining a sufficiently large sample size, the initial target was set higher at 4,000 respondents, with a 9.0 percent participation rate in the first wave. For subsequent waves, the target was set at 3,000 respondents. Thanks to retention efforts such as repeated invitations and reminders, a significant proportion of panelists remained in the study – even after extended breaks in fieldwork (e.g., between Waves 6 and 7 and Waves 13 and 14) – demonstrating strong participant engagement despite these interruptions.
Fig. 3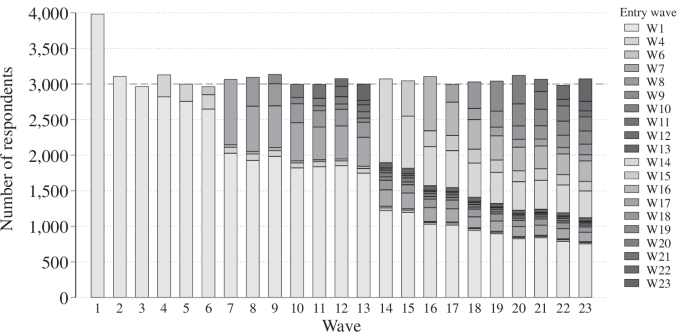
Panel Retention and Refreshment Samples.
In addition, continuous targeted recruitment of new respondents took place throughout the panel to address underrepresented demographics and thus ensure that the sample remained representative of the Austrian voting-age population. This combination of retention strategies and refreshment efforts helped to mitigate the impact of attrition and preserve the representativeness of the survey data over the full study period.
Although losses were continuously compensated for with the targeted recruitment of fresh respondents, it is often also of interest to investigate which respondents are more likely to remain in the panel and participate in multiple waves. To address this, we conducted a linear regression analysis to investigate the social and political determinants of panel participation, using the number of waves participated in as the dependent variable and various socio-demographic factors and political predispositions as independent variables. The number of waves ranges from 1 to 23, with a mean of 6.35, meaning that on average respondents took part in about 6 panel waves.
Figure 4 shows the results of the analysis as a coefficient plot displaying the estimated regression slopes along with 95% confidence intervals. The most pronounced effect is a clear age gradient. Age groups above 40 (40–49, 50–59, 60–69, and 70 + ) participated in approximately two to three more waves than the reference group (30–39), while the youngest age cohort ( < 29) participated in about 1.5 fewer waves. In contrast, gender had no significant effect on wave participation, with the coefficient close to zero. Educational attainment was associated with slightly higher participation, with respondents holding a university degree participating in about one wave more than those with vocational training. Employment status also showed some effects: retired individuals participated in about 1.5 additional waves compared to employed respondents (the reference category), while students and those classified as “others” (e.g., unemployed or inactive) participated in 0.7–0.8 fewer waves. Larger household sizes (3 + persons) and having a migration background were associated with less frequent participation, with about one wave fewer each. Regionally, differences were minimal, with respondents from Carinthia and Burgenland participating slightly more often than those from Tyrol.
Fig. 4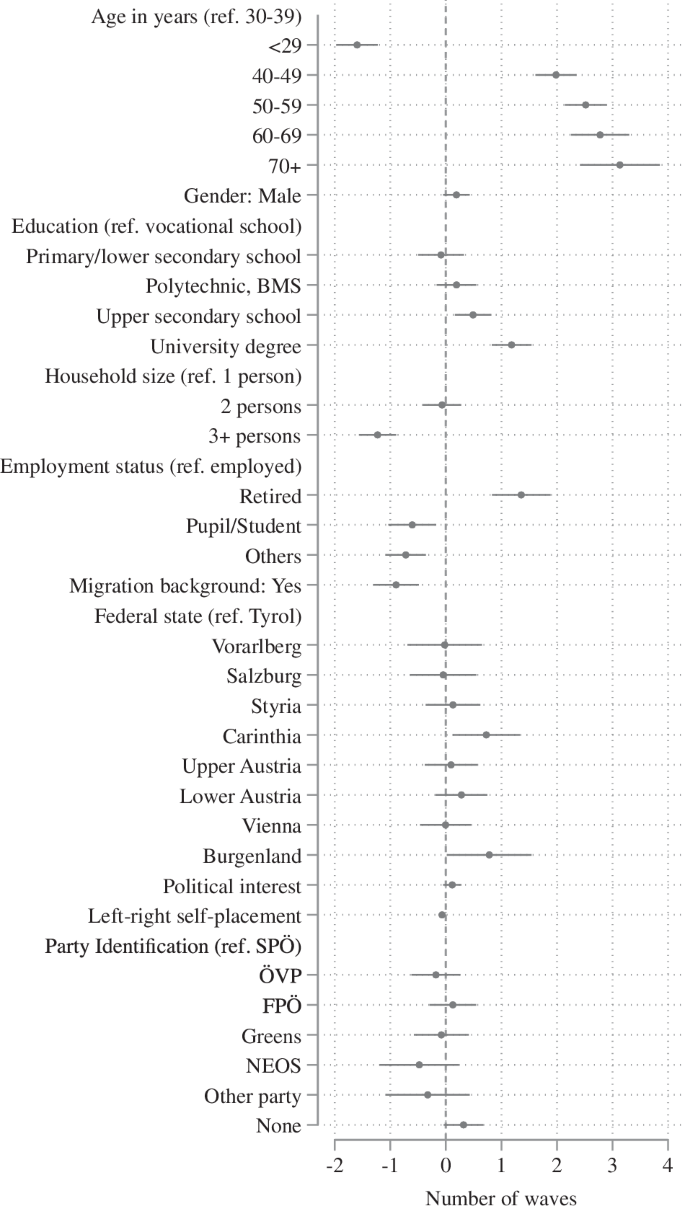
Predictors of Panel Participation.
Political variables, such as political interest and left-right self-placement, did not significantly influence participation in panel waves. Similarly, no statistically significant effects were found for party identification. Overall, these findings underscore that panel engagement is predominantly influenced by life stage and the associated mobility/stability, rather than by survey-specific or political factors. These patterns closely mirror those reported in other studies on panel attrition, which have also shown that adjustments for attrition in such cases typically have only a minimal impact on the substantive results25,26,27. Considering this, and in light of the continuous recruitment of fresh respondents, we conclude that no major additional adjustments with regard to panel attrition are required in most standard longitudinal analyses.
Effects of panel participation on response behavior
In addition to panel attrition, a further methodological concern in longitudinal survey research is panel conditioning, i.e., the potential impact of repeated survey participation on respondents’ behavior. While such conditioning may produce positive effects, such as increased familiarity with question formats, it may also lead to reduced diligence, increased satisficing, or heightened attitude extremity over time. As the AUTNES online panel did not include independent cross-sectional samples, we adopted an alternative approach sometimes used in the literature by assessing the association between the number of waves completed and multiple indicators of response quality28. This analysis focused on the 2024 post-election wave (Wave 23), at which point some respondents had participated in up to 23 waves, while others had joined the panel more recently, providing substantial variation in survey exposure. To evaluate potential conditioning effects, we regressed several measures of response quality on the number of completed waves. The outcome variables included: (1) an instructed response item (attention check: failed vs. passed); (2) item nonresponse, measured by the number of “don’t know” responses in a matrix battery; (3) straightlining, operationalized as providing identical responses across all items in a grid; (4) attitude extremity, calculated as the average absolute deviation from the scale midpoint; (5) speeding, defined as responding in under two seconds per matrix item29; (6) total interview duration (in minutes); and (7) a self-reported measure of diligence, based on agreement with the statement “I completed the questionnaire diligently” on a 5-point Likert scale. The matrix battery from which several of the grid-based indicators were derived focused on immigration attitudes and had been administered in 18 of the 23 waves, making it particularly susceptible to potential panel conditioning effects. To control for confounding influences, all models included the same set of socio-demographic and political variables used in the analysis of panel attrition.
Table 1 shows the results of the analysis. The number of completed panel waves was significantly associated only with a somewhat lower likelihood of failing the attention check, suggesting that more experienced respondents may be more familiar with such instructed response items. For all other indicators—item nonresponse, straightlining, attitude extremity, speeding, interview duration, and self-reported diligence—no significant relationships with panel participation were observed. This indicates that panel conditioning effects are limited in scope and size, with potential positive and negative effects possibly offsetting one another. These findings are consistent with evidence from a recent methodological comparison of the 2024 AUTNES post-election wave with the probability-based Digitize! CSES Post-Election survey, which also found rather minor differences in response quality between the samples18. To the extent that conditioning effects may be of concern in specific applications, researchers may consider including the number of completed waves as an additional control variable. Overall, however, the observed effects appear modest.
Table 1 Effects of Panel Participation on Response Behavior.