
This study utilizes an online monitoring system installed on wind turbine blades, aiming to continuously measure and record various operational parameters of the wind turbine blades, including wind speed, power, angle of variable propeller and more. After the incident, the blade monitoring data was extracted, with particular focus on the period before the incident, during which the blade load exceeded the limit and exhibited abnormal fluctuations. Through further trace-back analysis of the blade monitoring data, wind speed, power, pitch angle, and turbine operation were recorded at different time intervals. Specifically, attention was given to several critical time periods when abnormal blade load and strain were observed. During these abnormal periods, mismatches between wind speed, pitch angle, and power, as well as abnormal blade load data, were observed. These anomalies may indicate potential damage to the blade structure. Such monitoring data can serve as a valuable foundation for machine learning-based fault diagnosis and intelligent operation and maintenance strategies.
In order to ensure the safe and stable operation of the wind turbine and to detect potential fault risks in a timely manner, multiple advanced sensors were installed on the wind turbine before the incident to conduct comprehensive monitoring. Real-time acquisition of key operational parameters, precise tracking of various components of the turbine can be achieved, allowing for early warning of potential faults. The main methods employed are as follows:
1.
Strain Sensor Monitoring. Strain sensors monitor the bending moment at different sections of the blades in real-time. By converting strain data into load data, the loads on different parts of the blades are continuously monitored, enabling the detection of any abnormal loads at various locations.
2.
Vibration Sensor Monitoring. Vibration sensors are employed to capture the actual operating acceleration values, accumulating the normal operating acceleration levels. By obtaining vibration signals during operation, high-order blade mode information can be acquired. Combined with the design model analysis, this allows for high-order feature recognition. Additionally, under the same operating conditions, by analyzing the load and low-order natural frequency differences, it is possible to assess whether there is significant stiffness damage to the blades.
Sensors
Three sections of the selected blade were chosen for load and vibration monitoring purposes. At the root of the blade, strain sensors were installed to monitor the strain in both the spanwise and chordwise directions. At the 1/3 and 2/3 positions along the blade length, strain sensors and accelerometers were deployed to monitor strain and vibration in the spanwise and chordwise directions, respectively. The monitoring locations are shown in Fig. 1. The specifications of the related sensors are provided in Table 2.
Fig. 1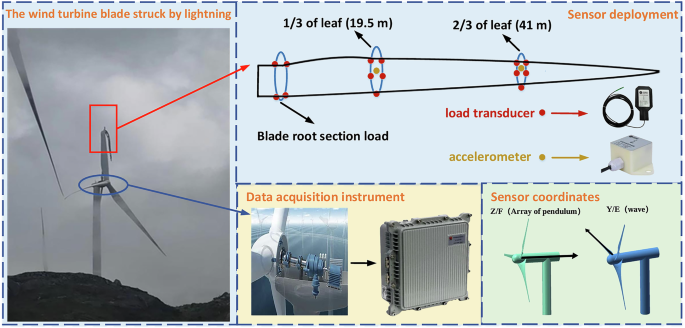
Deployment locations of sensors and division of coordinate systems.
Table 2 Parameters and Indicators of Sensor Section.
Take the installation process of the load sensor as an example. Before installing the load sensor, the performance of the sensor and the data acquisition channel should be verified to ensure that the sensor and the system are in good condition, thereby guaranteeing the accuracy of the lightning strike response data. The installation process followed a standardized protocol, as illustrated in Fig. 2. Firstly, by determining the positioning line and grinding the target area to remove surface impurities, ensuring that the attachment surface of the sensor is flat. Secondly, draw contour lines of the position to ensure consistent installation height and reduce measurement errors caused by local undulations. After completing the position processing, use high-strength adhesive materials to bond the sensor, ensuring its close contact with the blade surface. Finally, after the bonding is completed, perform installation and thermal curing treatment to enhance the bonding strength and installation stability. This process can effectively improve the durability and data reliability of the sensor in complex environments. The installation methods for other types of sensors are similar, and adjustments are made according to specific working conditions.
Fig. 2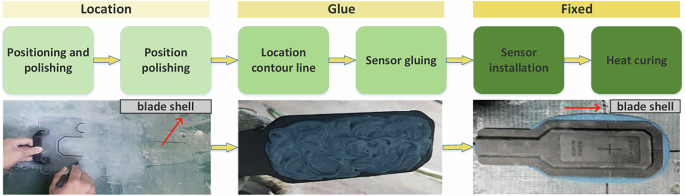
Load sensor installation process.
Transfer system
The blade condition monitoring system, based on fiber-optic MEMS sensing technology, primarily consists of fiber optic load sensors, MEMS fiber optic accelerometers, a fiber optic sensor analyzer, a diagnostic host, a back-end server, and other components. Data is transmitted and communicated via a bus. Through data fusion and integration, the diagnostic system generates standardized, application-specific data. After multilayer processing, which includes the data layer, application layer, and presentation layer, the server ultimately provides production management and operational guidance and displays the equipment’s health status. The data transmission flow of the monitoring system is illustrated in Fig. 3.
Fig. 3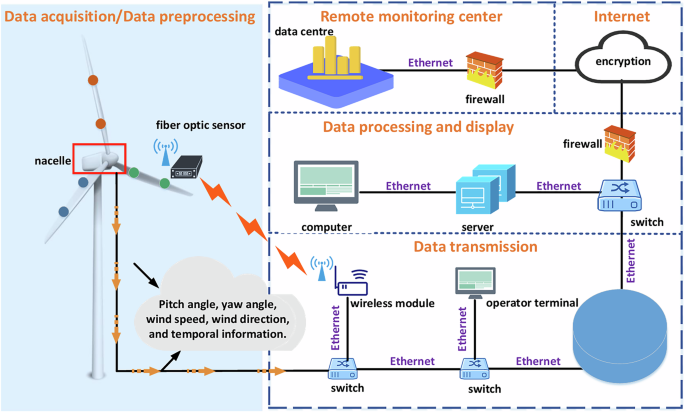
Flowchart of Data Transmission in the Monitoring System.
Data analysis and preprocessing
After the incident, a retrospective analysis of the wind turbine’s failure process was conducted. By extracting key operational parameters before and after the event and integrating the time-series characteristics of the monitoring data presented in Table 3, the dynamic evolution from normal operation to gradual failure becomes clearly discernible.
Table 3 Comprehensive state analysis of wind turbine blades.
The blade’s last recorded change took place between 11:13 and 11:19 on August 16, during which the load exceeded its limit and showed abnormal fluctuations. From the blade monitoring data, it can be observed that the turbine underwent multiple start-stop cycles in different time periods, with wind speed, power, and angle of variable propeller all exhibiting irregular variations. Specifically, the turbine transitioned from normal operation to a fault state, going through repeated self-start attempts until a complete shutdown. Notably, in the critical time window, load and strain displayed anomalies, indicating that the turbine had entered a fault condition.
Failure time period analysis
Reviewing the data from 3:20 to 4:20, the blade’s operating parameters showed no significant changes under normal conditions, and the relationships among power, rotational speed and angle of variable propeller appeared normal. At this point, the blade was likely in a stable state, with no evident damage to the main structure or the airfoil. Comparison with data prior to 4:20 indicates no marked anomalies. Although the possibility of minor inaccuracies in the monitoring system cannot be ruled out, the likelihood of severe blade damage before that time was relatively low.
At 4:20, the blade load data, acceleration data, and vibration data all exhibited pronounced irregularities, suggesting that the blade was subjected to an abnormal external force. An emergency shutdown of the blade ensued. Following this abnormal shutdown, the turbine experienced multiple start-stop cycles at 4:30, 4:49, 7:42, and 8:54, which further exacerbated the blade’s damage and progressively reduced the correlation between power, rotational speed and angle of variable propeller. By 10:10, large-scale damage had begun to manifest, as evidenced by noticeably abnormal load measurements. At 11:13, the blade suffered a complete fracture. Combined with on-site inspection, it was confirmed that the blade was struck by lightning at 4:20. The subsequent frequent start-stop cycles caused the lightning damage to continue spreading, ultimately culminating in total blade failure at 11:13. Fig. 4 presents the sensor readings for mechanical characteristic parameters of the monitored blade throughout its entire operational lifecycle from 3:20 to 11:19.
Fig. 4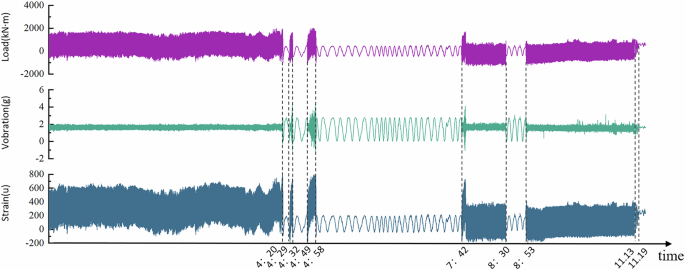
Flowchart of data transmission in the monitoring system.
Fig. 5(a–c) show variations in vibration, load, and strain data measured at different blade positions between 3:20 and 4:20. The vibration data exhibit relatively steady oscillations during this interval, with consistent trends across heights. At 19.5 m, the vibration fluctuations are subtler than at 41 m. In contrast, the load data at 19.5 m show greater variability, while the load at 41 m remains comparatively stable. The strain data follow a more consistent trajectory, but increases in strain are correlated with load fluctuations, suggesting that the blades may have experienced more pronounced tensile or compressive stresses during certain periods. These stresses could arise from sudden changes in wind speed, turbine control responses, or shifts in the turbine’s operational state.
Fig. 5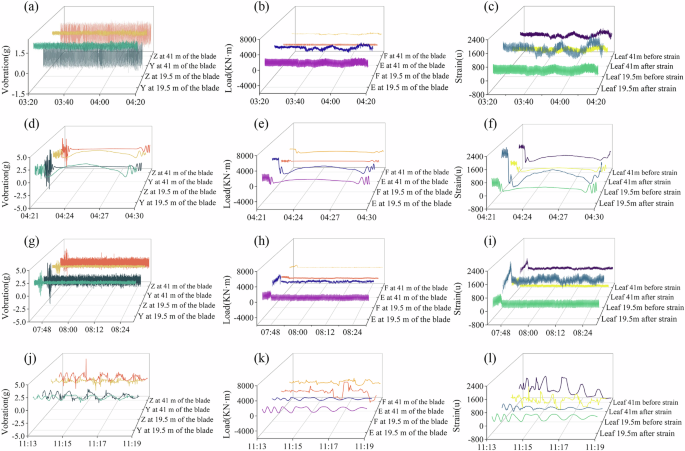
Vibration, load, and strain sensor data at different time intervals. (a–c) represent data from 3:20 to 4:20; (d–f) represent data from 4:21 to 4:30; (g–i) show data further damaged after the lightning strike; (j–l) represent data after blade fracture.
Overall, there is a strong correlation among vibration, load, and strain, underscoring the tightly interlinked mechanical characteristics of the turbine during operation. Blade vibrations can trigger variations in load, while load fluctuations, in turn, affect strain. The overarching trend suggests that the turbine maintained stable operation for most of this period, with its mechanical performance remaining within normal thresholds.
Fig. 5(d–f) show the variations in blade vibration, load, and strain data for the wind turbine between 4:21 and 4:30. These measurements display pronounced fluctuations during this interval, particularly between 4:23 and 4:27, when significant changes are observed in all three parameters. During this period, the blade load surges abruptly and is accompanied by a rapid increase in vibration acceleration. The blade load exhibits unstable oscillations, swiftly reaching extreme values which indicative of an external shock, such as lightning strike, that damages the blade structure and triggers an emergency shutdown.
Around 4:21, load levels oscillate violently, with amplitudes quickly exceeding normal operational limits. These anomalous readings strongly suggest that the turbine encountered severe interference caused by the lightning strike, resulting in abnormal load data. Continued monitoring and analysis reveal that neither the anomalous load nor the strain fluctuations subside over a short timeframe, implying that the turbine did not revert to normal operating conditions following the impact. This persistence of irregular behavior raises the possibility of serious structural damage.
Fig. 5(g–i) present the vibration, load, and strain data recorded from 7:42 to 8:30, capturing further structural damage sustained by the wind turbine blades following a lightning strike. During this period, all three parameters display substantial fluctuations. Vibration measurements at both 19.5 m and 41 m show pronounced oscillations, indicating severe structural harm and vigorous vibration responses. In particular, the 19.5 m position shows larger amplitudes, possibly due to a stronger localized impact from the lightning strike, leading to uneven oscillations across the blade.
Load data also reveal significant volatility, indicating abnormal mechanical stress likely linked to sudden wind speed variations and blade damage induced by the lightning. The synchronized fluctuations in load and vibration imply that the compromised blade structure hampers the turbine’s ability to adapt to changes in wind speed and load, thereby heightening operational instability. Moreover, strain readings at 19.5 m and 41 m undergo marked and rapid changes, especially in the minutes immediately following the lightning event, when strain values spike sharply. This abrupt escalation indicates pronounced blade deformation driven by the transient high temperatures and electrical discharge characteristic of the lightning strike, highlighting the extent of structural damage incurred.
Fig. 5(j–l) present data collected between 11:13 and 11:19, during which the turbine blade’s vibration, load, and strain readings show intense fluctuations. The interval from 11:15 to 11:17, in particular, features abrupt changes in all three parameters, highlighting the severe operational consequences of blade fracture. Vibration signals at 19.5 m and 41 m spike dramatically, showing brief yet pronounced surges. In parallel, load measurements become increasingly erratic, with sudden jumps indicating that the blade fracture caused an unstable load distribution. The turbine’s control system could not adjust swiftly to these abrupt load changes, as evidenced by the close synchronization of load and vibration fluctuations.
Strain data likewise escalate rapidly from 11:13 to 11:15, highlighting marked blade deformation. The 19.5 m sensor records especially pronounced strain oscillations, suggestive of higher external stress at this position. Collectively, these findings reveal how blade fracture compromises overall turbine operation. The sharp shifts in vibration, load, and strain indicate a loss of structural stability post-fracture, preventing uniform load redistribution and triggering further mechanical damage that ultimately leading to complete blade failure.