
There is a housing shortage in Canada. The Canada Mortgage and Housing Corporation (Canada Mortgage and Housing Corporation, 2023) estimates that approximately 3.5 million additional housing units are required by 2030 to restore affordability to 2004 levels.
Building conversions from non-residential to residential use is a potential strategy for increasing housing supply at lower cost than new builds. For example, the City of Calgary has 11 approved projects for office conversions to create more than 1,400 new residential units (City of Calgary, 2024). The City of Hamilton is also implementing a new grant pilot program that could be used to help convert buildings and cover some conversion costs (CBC, 2025).
Conversions are potentially attractive because they often make use of existing infrastructure. They may also help alleviate the problem of underutilized office space observed in recent years. At the end of 2024, the national office vacancy rate was approximately 18.7% (CBRE, 2025), suggesting there is a lot of underutilized space available for conversions. However, several feasibility studies find that only about 25% to 34% of office buildings in North American markets have real conversion potential (Avison Young, 2023; Paynter, 2023).
Work from home (WFH) and hybrid working arrangements that have persisted since the onset of the COVID-19 pandemic likely contribute to the office vacancy rates now observed across Canadian cities.Note A better understanding of where teleworkable jobs—jobs that could in principle be done from home—are located informs whether WFH is potentially a viable mechanism for increasing the supply of convertible buildings in areas where housing shortages are most prevalent.
The goal of this report is to present findings from a new approach developed for analyzing the geography of teleworkable jobs in Canadian cities. For illustration, the first set of results obtained for Canada’s largest city, Toronto, are presented. The report offers a compelling way to identify and visualize where teleworkable jobs are located, which informs discussions on how WFH might create office vacancies for viable building conversions in areas most susceptible to housing shortages and gentrification.
Data and methodology
The 2021 Census of Population is used throughout this report. Determining whether a job can be done from home based on occupation follows the approach developed by Dingel and Neiman (2020). Specifically, an occupation cannot be done from home if the employee needs to perform for or work directly with the public; work outdoors; operate or repair machinery and equipment; inspect equipment, structures or materials; wear common or specialized protective or safety equipment; handle or move objects; or perform general physical activities. Otherwise, the occupation can be performed from home.
One limitation of using the 2021 Census of Population is that it was conducted at a time when telework was more prevalent than it is now, since some employers have mandated a return to the office. However, this concern is mitigated by focusing on whether a job can be done from home, rather than whether the employee actually works from home.Note Changes in the number of teleworkable jobs within city areas are likely slower, since they require firm entry, exit and relocation.
For the purpose of this report, a geographic “region” (or city area) refers to a 0.5 square kilometre parcel of land obtained by creating a city-wide grid. Using a grid to define region boundaries is ideal because it is independent of the distribution of individuals or firms within the city. The density of teleworkable jobs in a region is simply the number of employees whose jobs could be performed from home based on their occupational tasks. Individuals were assigned to grids based on their location of employment.
Results
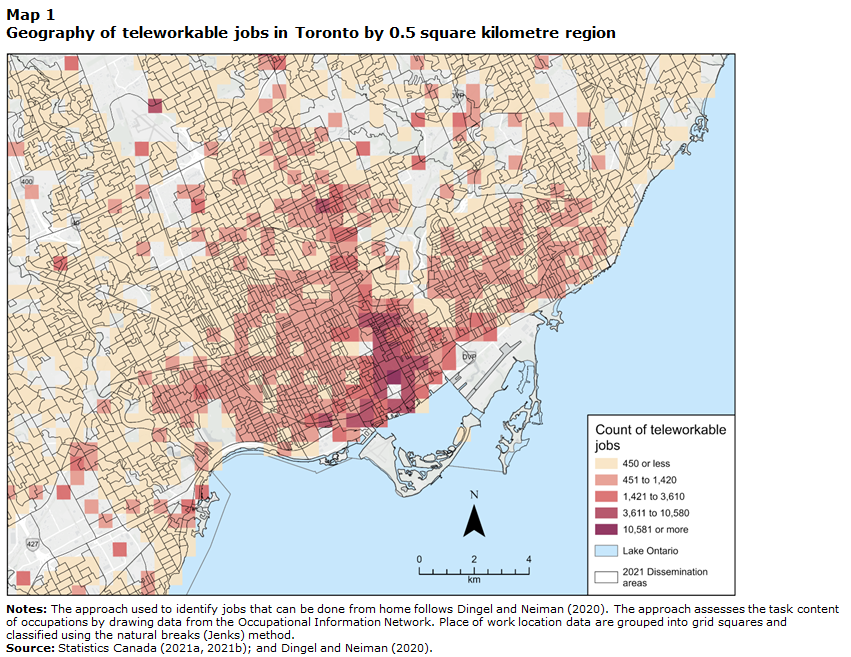
Map 1 shows the geography of teleworkable jobs in Toronto by region. Notably, there is a very large concentration of teleworkable jobs in the financial district and downtown core, illustrated by the darker red grids in the centre of the map. It is estimated that each of these 0.5 square kilometre regions contain 3,600 or more jobs that could be performed from home.
Map description
Map 1 is a map showing the number of estimated teleworkable jobs in Toronto, focusing on the downtown area. Here, the word “teleworkable” refers to jobs that can be done from home. In this map, the number of teleworkable job locations are grouped into 0.5-kilometre-by-0.5-kilometre grid square shapes, which are coloured using sequentially darkening shades of red, where the lowest values are a warm beige colour, and the highest values are a deep magenta or wine colour. Mapped categories in the data were defined using the natural breaks (Jenks) classification scheme. The map itself indicates that the highest number of teleworkable jobs exist in the financial district and downtown core of Toronto. In addition, many teleworkable jobs are within moderate proximity of the city centre, from High Park in the west to East Danforth and south of Eglinton Avenue. High numbers of teleworkable jobs extend from the downtown core northward along Yonge Street into North York. Conversely, many suburban regions of the city appear to have many fewer teleworkable jobs—less than 450 per grid area in most cases. To provide a reference and to contrast with the grid layer, the boundaries of the 2021 Census dissemination area geography are overlaid on top of the map. Furthermore, the map includes Lake Ontario in blue, which fills in the bottom right portion of the layout. The map features a legend key in the bottom right, with a north arrow and a scale bar located just to its left.
Further, the regions immediately neighbouring this core and, notably, some regions along Yonge Street contain an additional 1,400 to 3,600 jobs that could be performed from home.
In addition, there is a fairly uniform distribution of teleworkable jobs outside of but within moderate proximity to the city centre, from about High Park in the west to East Danforth and south of Eglinton Avenue. It is estimated that there are between approximately 450 and 1,400 jobs per 0.5 square kilometre in this part of the city. There is also a similar density of teleworkable jobs around Yonge Street extending into North York.
Looking further outside of these regions, Map 1 shows there is greater dispersion, where many suburb regions of the city are estimated to contain fewer than 450 teleworkable jobs per 0.5 square kilometre.
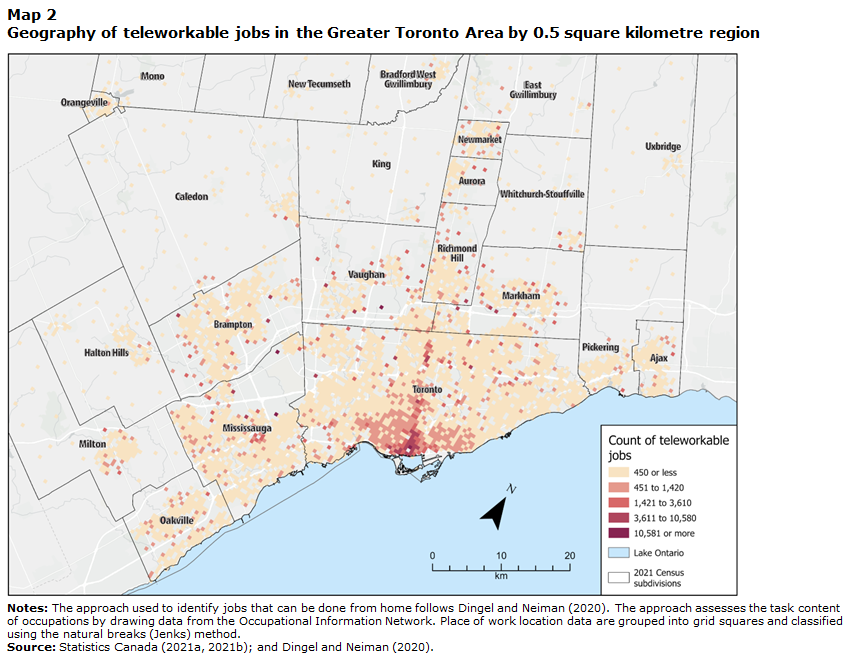
To see how teleworkable jobs are distributed more widely across the Greater Toronto Area (GTA), Map 2 carries out the same analysis from Oakville in the west to Ajax in the east and extending just north of Newmarket. This analysis shows there are many “pockets” within cities adjacent to Toronto that contain moderate amounts of teleworkable jobs, and in some cases—in particular, the city centre in Mississauga—contain up to approximately 3,600 teleworkable jobs per 0.5 square kilometre.
Map description
Map 2 is a map showing the number of estimated teleworkable jobs in Toronto and surrounding towns and cities. Here, the word “teleworkable” refers to jobs that can be done from home. This map displays the same data as Map 1, but instead of focusing on downtown Toronto, it zooms out, extending outwards to Oakville in the west, Ajax in the east, and Newmarket in the north. In this map, the number of teleworkable job locations are grouped into 0.5-kilometre-by-0.5-kilometre grid square shapes, which are coloured using sequentially darkening shades of red, where the lowest values are a warm beige colour, and the highest values are a deep magenta or wine colour. Mapped categories in the data were defined using the natural breaks (Jenks) classification scheme. In addition to highlighting again that the highest number of teleworkable jobs exist within moderate proximity to the downtown core, the map also shows that there are many “pockets,” or clusters, of teleworkable job locations in cities adjacent to Toronto. Notably, the city centre of Mississauga is one such area with high numbers of teleworkable jobs. The labelled boundaries of the 2021 census subdivision geography are overlaid on top of the map to serve as a reference for the reader. Furthermore, the map includes Lake Ontario in blue, which fills in the bottom right portion of the layout. The map also features a legend key in the bottom right, with a north arrow and a scale bar located just to its left.
Conclusion
This report shows the geography of teleworkable jobs in Toronto and across the GTA. Results indicate that there are a substantial number of jobs that could, in principle, be done at home within Toronto’s financial district and city centre, based on the occupational tasks of jobs and the inferred telework capacity of those jobs.
Amid rising costs of living in cities and displacement of lower-income families from city centres, WFH and building conversions might be a potential avenue for increasing housing supply. In addition, a Bank of Canada study by Morel (2022) shows the house price boom during the pandemic was the largest in Toronto’s suburban areas as the shift to remote work made living near the office less advantageous. This report shows there are many areas throughout the GTA where building conversions might help alleviate pressure on suburban housing prices.
A limitation of this report is that it does not estimate how the number of teleworkable jobs map into the number of convertible buildings or residential units that might be constructed. The findings may be interpreted as an accounting exercise that takes stock of how many jobs are teleworkable and where they are located, which is an important first step in assessing whether WFH has the potential to alleviate housing shortages.
Authors
Mark Brown, Matthew Brown, Tahsin Mehdi, Derek Messacar and René Morissette (retired) are with Economic and Social Analysis and Modelling Division, Statistics Canada.
References
Avison Young. (2023). Up to One Third of Office Buildings Across 14 Major North American Markets Could Provide Housing Potential, Through Adaptive Reuse. Accessed March 2, 2025.
Canada Mortgage and Housing Corporation. (2023). Update on Canada’s Housing Supply Shortages. Accessed March 2, 2025.
CBC. (2025). Hamilton Hopes New Incentives Will Spur Transformation of Empty Offices Into Homes. Toronto: Canadian Broadcasting Corporation.. Toronto: Canadian Broadcasting Corporation.
CBRE. (2025). Canada Office Figures Q4 2024. Accessed March 2, 2025.
City of Calgary. (2024). Downtown Calgary Office Conversions – Approved Projects. Accessed March 2, 2025.
Dingel, J. I., and B. Neiman. 2020. How many jobs can be done at home? NBER Working Paper, no. 26948. Cambridge: National Bureau of Economic Research.
Morel, L. (2022). “Analyzing the house price boom in the suburbs of Canada’s major cities during the pandemic.” Staff Analytical Note 2022-7. Ottawa: Bank of Canada. Accessed March 2, 2025.
Paynter, S. (2023). What We’ve Learned by Assessing More Than 1,300 Potential Office-to-Residential Conversions. Accessed March 2, 2025.
Statistics Canada. (2021a). Boundary Files.
Statistics Canada. (2021b). 2021 Census of Population
Urbanation. (2024). Slowest First Half for GTHA New Condo Sales in 27 Years. Accessed March 2, 2025.