
Reagents
RPMI-1640 medium and fetal bovine serum (FBS) were from Gibco (USA). Sigma-Aldrich (USA) supplied trypan blue, MTT, LPS (E. coli 0111:B4), and DMSO. L-glutamine, penicillin, and streptomycin were from Biorsera (USA). L-NAME was from Life Sciences (UK), the total RNA extraction kit from Pars Tous (Iran), the Real Q Plus 2x Master Mix Green from Amplicon (Denmark), and the high-capacity cDNA reverse transcription kit from Applied Biosystems (USA).
Cell line culture
The J774.1 murine macrophage cell line (Pasteur Institute, Tehran) was cultured in complete RPMI-1640 medium supplemented with 10% FBS, 2 mM L-glutamine, and 100 U/ml penicillin/100 µg/ml streptomycin at 37 °C and 5% CO₂. Cells with ≥ 90% viability, as determined by trypan blue exclusion, were used for experiments.
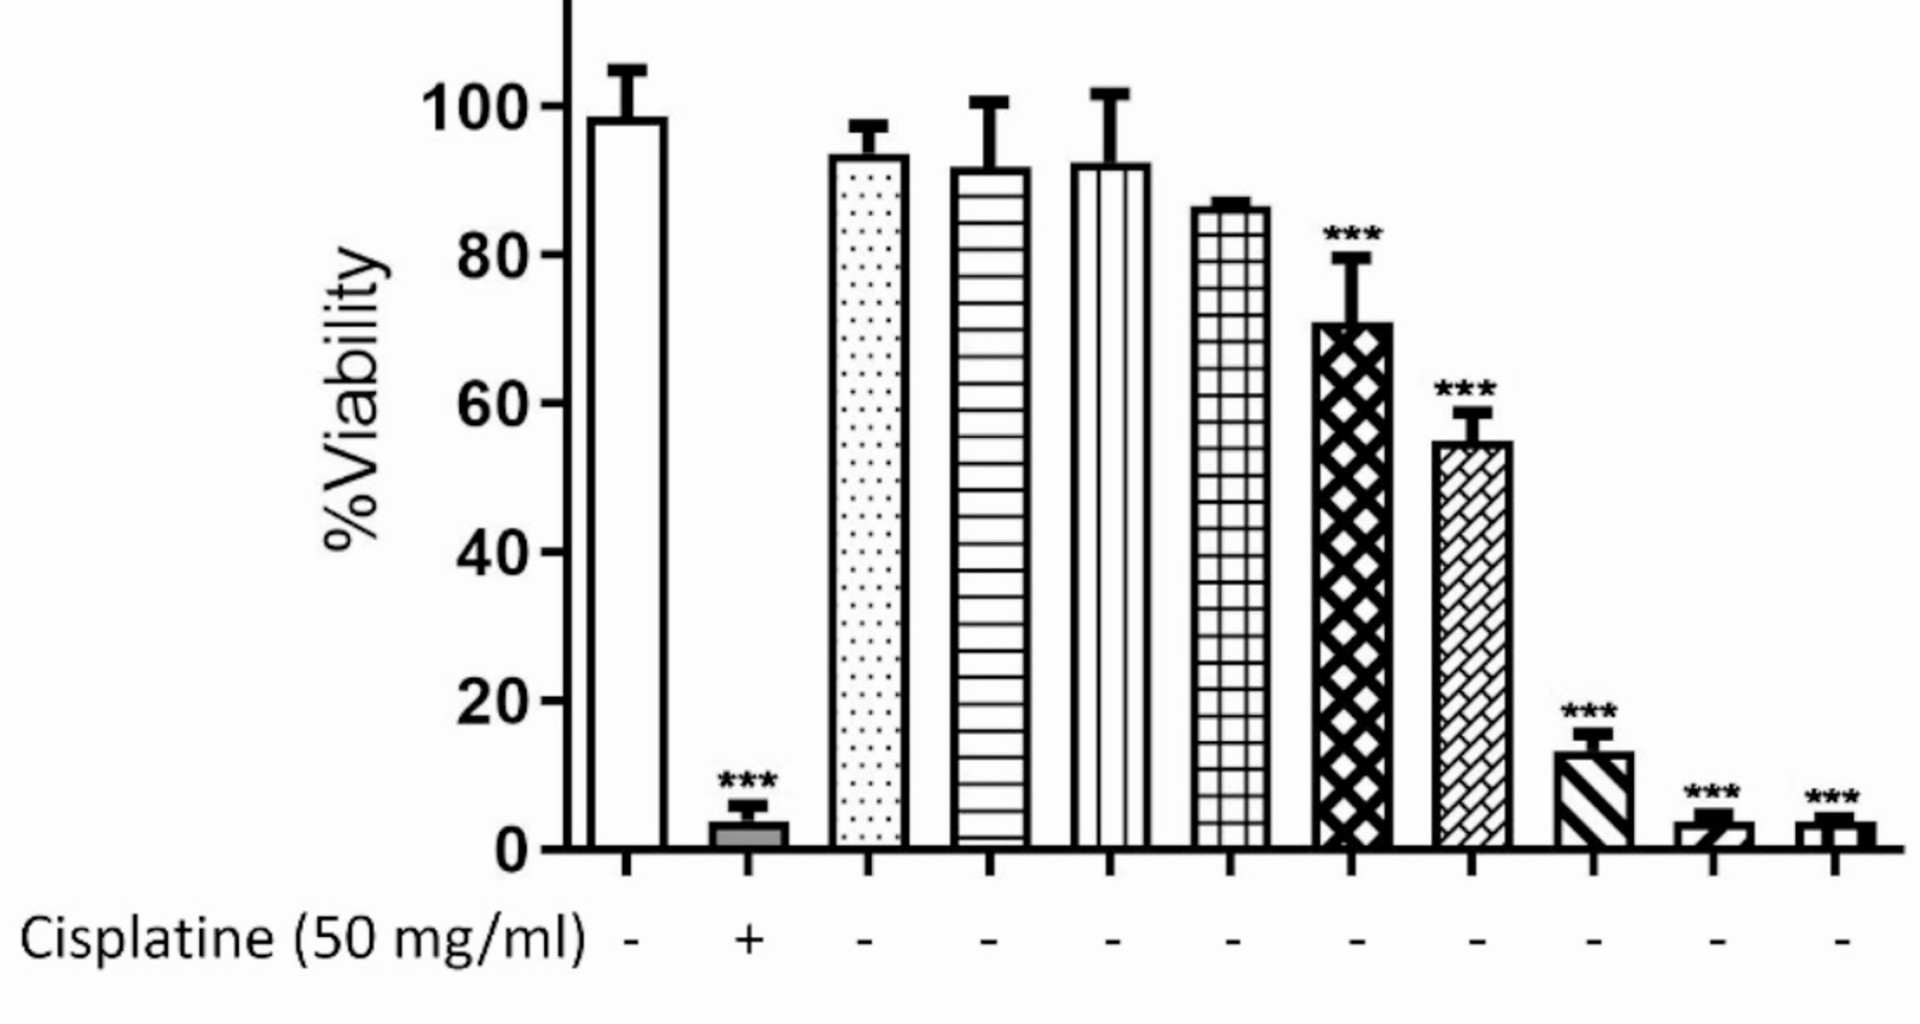
Determining the cytotoxic effects of piperine
The MTT assay was used to determine the possible cytotoxic effect of piperine on J774.1 cells [12]. J774.1 cells were seeded in a 96-well plate (7.5 × 10³ cells/well) and treated for 24 h with piperine (0.1–100 µg/ml) or cisplatin (50 µg/ml; positive control), with untreated cells as a negative control. After treatment, 10 µl of MTT (5 mg/ml) was added and incubated for 4 h at 37 °C. The formazan crystals were then dissolved in 150 µl DMSO, and absorbance was measured at 570 nm (reference 630 nm) using a microplate reader (BioTek). Cell viability was calculated as a percentage of the untreated control.
Culture conditions
J774.1 cells were cultured in complete RPMI medium at a density of 106 cells/well in a 24-well plate and stimulated with LPS (1 µg/ml) to induce inflammatory responses. The stimulated cells were immediately treated with piperine (1, 10, 20 µg/ml), L-NAME (1 mM/ml), and dexamethasone (a steroid/glucocorticoid, anti-inflammatory drug, 0.1 µg/ml) and maintained at 37 °C, 5% CO2, and 95% humidity for 24 h. Untreated cells and LPS-treated cells served as the negative and positive controls, respectively. After treatment, supernatants were collected and stored at −80 °C until analysis for NO and cytokine measurements, while the cells were used for gene expression analysis via real-time polymerase chain reaction (PCR).
Nitrite assay
Nitrite, a stable by-product of nitric oxide (NO), was measured in cell supernatants using the Griess colorimetric method [20]. Briefly, 80 µl of the supernatant was mixed with an equal volume of Griess reagent and incubated for 10 min at room temperature in the dark. Afterward, the optical density (OD) of the reaction product was measured at 570 nm. The OD values of test samples were compared to a sodium nitrite standard curve to calculate nitrite concentration.
Enzyme-linked immunosorbent assay (ELISA)
According to the manufacturer’s instructions, the levels of TNF-ɑ, IFN-γ, and IL-1β cytokines in cell supernatants were measured using mouse ELISA kits (Invitrogen, Carlsbad, California, USA) with a sensitivity of 8 pg/ml.
RNA extraction, cDNA synthesis, and real-time polymerase chain reaction
RNA was extracted from J774.1 cells using a total RNA extraction kit (Pars Tous, Iran) following the manufacturer’s protocol. RNA concentration and purity were determined using a UV spectrophotometer (Picodrop, Hinxton, United Kingdom), while its integrity was evaluated by electrophoresis of RNA samples on a 1.2% agarose gel. cDNA synthesis was performed using a high-capacity cDNA reverse transcription kit (Applied Biosystems, ABI, USA) according to the manufacturer’s protocol. Gene expression analysis was conducted using the 7500 Real-Time PCR System (ABI) in a total reaction volume of 20 µl. Each reaction consisted of 2 µl cDNA, 10 picomoles of forward (0.8 µl) and reverse (0.8 µl) primers, 10 µl of Real Q Plus 2x Master Mix Green, and 6.4 µl nuclease-free H2O. Primer sequences and their characteristics are shown in Table 1. The PCR was performed as follows: a cycle of 95 °C for 15 min to activate the hot-start DNA polymerase enzyme, followed by 40 cycles of denaturation (5 s at 95 °C), annealing (15 s at temperatures mentioned in Table 1), and extension (30 s at 72 °C). Melt curves were analyzed to verify amplification specificity. Relative gene expression of the target genes (relative fold change or RFC) was determined using the 2−ΔΔCT method. Samples were normalized to the expression levels of β-actin and were compared to the results of unstimulated J774.1 cells.
Table 1 Forward and reverse primer sequences for real-time PCRStatistical analysis
Statistical analyses were performed using SPSS (version 26.0) and GraphPad Prism (version 8.3.0) software for Windows. Results are presented as mean ± standard error of the mean (SEM) from at least three independent experiments, each performed in triplicate. A comparison between groups was done using the one-way analysis of variance (ANOVA), and if the results were significant, a Tukey post-test was used. A p-value < 0.05 was considered significant.