
Adult sand dollar collection and spawning
Adults of Dendraster excentricus were collected from San Pedro, CA, USA (33°42′ 30.2″ N, 118°16′ 39.1″ W). They were injected through the peristomial membrane with 1–2 mL of 0.5-M potassium chloride (KCl) to induce gamete release [19, 63]. Each culture was initiated using the sperm of three males and the eggs of three females to create a genetically diverse population. Concentrated sperm were diluted (1:1000) and added to the suspension of eggs until fertilization success (as determined by the presence of a fertilization envelope) was ≥ 90%. After fertilization, zygotes were initially stocked at five per milliliter in 0.2-µm pore-size filtered seawater (FSW) and kept at 16 °C (± 1 °C). This temperature was chosen as it represents temperatures characteristic of their spring spawning season [17] and is the same temperature used in previous studies of plasticity in these larvae [19, 25, 26]. At the feeding stage, 2-day post-fertilization (DPF), larvae were split into six 20-L vessels at a concentration of one individual per milliliter.
Larval culturing and sampling
All feeding treatments were kept in 20-L vessels with FSW at 16 °C (± 1 °C). Cultures were mixed using acrylic paddles rotated at 5 rpm by DC gear motors (Buehler Products, Kinston, NC, USA). Water changes were completed three times weekly by gently collecting larvae on a submerged 50-µm-pore mesh. Larvae were then resuspended in a small volume of FSW where their concentration was estimated by counting larvae in multiple samples of 100 µL. These values were used to estimate larval survivorship as well as the necessary volume to acquire a specific number of larvae for respiration or protein biomass measurements (described below).
Larvae were fed Rhodomonas sp., a unicellular alga commonly used for rearing echinoid larvae (e.g., [12, 25]). Algae were cultured in f/2 medium in Erlenmeyer flasks with sponge stoppers on a light cycle of 16 light-8 dark. Algae were harvested for feeding at the end of their logarithmic growth phase. Algal concentrations were determined using a BD Accuri C6 flow cytometer (BD Biosciences San Jose, CA, USA) [25, 64]. Algal concentrations in each culture vessel were checked by flow cytometry and restocked daily to the respective feeding treatment concentrations.
Inducible plasticity response (switching larvae from low to high food conditions)
Three independent cultures were used to assess the morphological and physiological consequences of switching larvae from low to high food conditions. Each independent culture consisted of five different feeding treatments: constant high-fed (10,000 cells of Rhodomonas sp. per mL), constant low-fed (1000 cells per mL), and three low to high food switched treatments. The switched treatments received a low food diet (1000 cells mL−1) before switching to a high food diet (10,000 cells mL−1) at 10, 20, or 30 DPF (hereafter referred to as SW-10, SW-20, and SW-30, respectively) (Additional file 1: Fig. S5A). The low- and high-fed treatment levels were used as they represent food availability levels that result in the typical plasticity response where low-fed have long arms and high-fed have short arms, and the low-fed treatment still results in positive biomass growth [25, 26]. Prior to switching food levels, larvae in switch treatments were pooled with constant low-fed treatments. All treatments were reared in 20-L vessels. For all cultures, both morphology and physiology were monitored (described below). Cultures were terminated either at 50 DPF or when the majority of the culture reached metamorphic competence (as determined by competency assays, described below). Our objective was to find a standard developmental benchmark that reflected, for the population of each treatment, the near completion of larval development, thereby allowing for appropriate comparisons of morphological and physiological traits.
Larval morphometrics and development
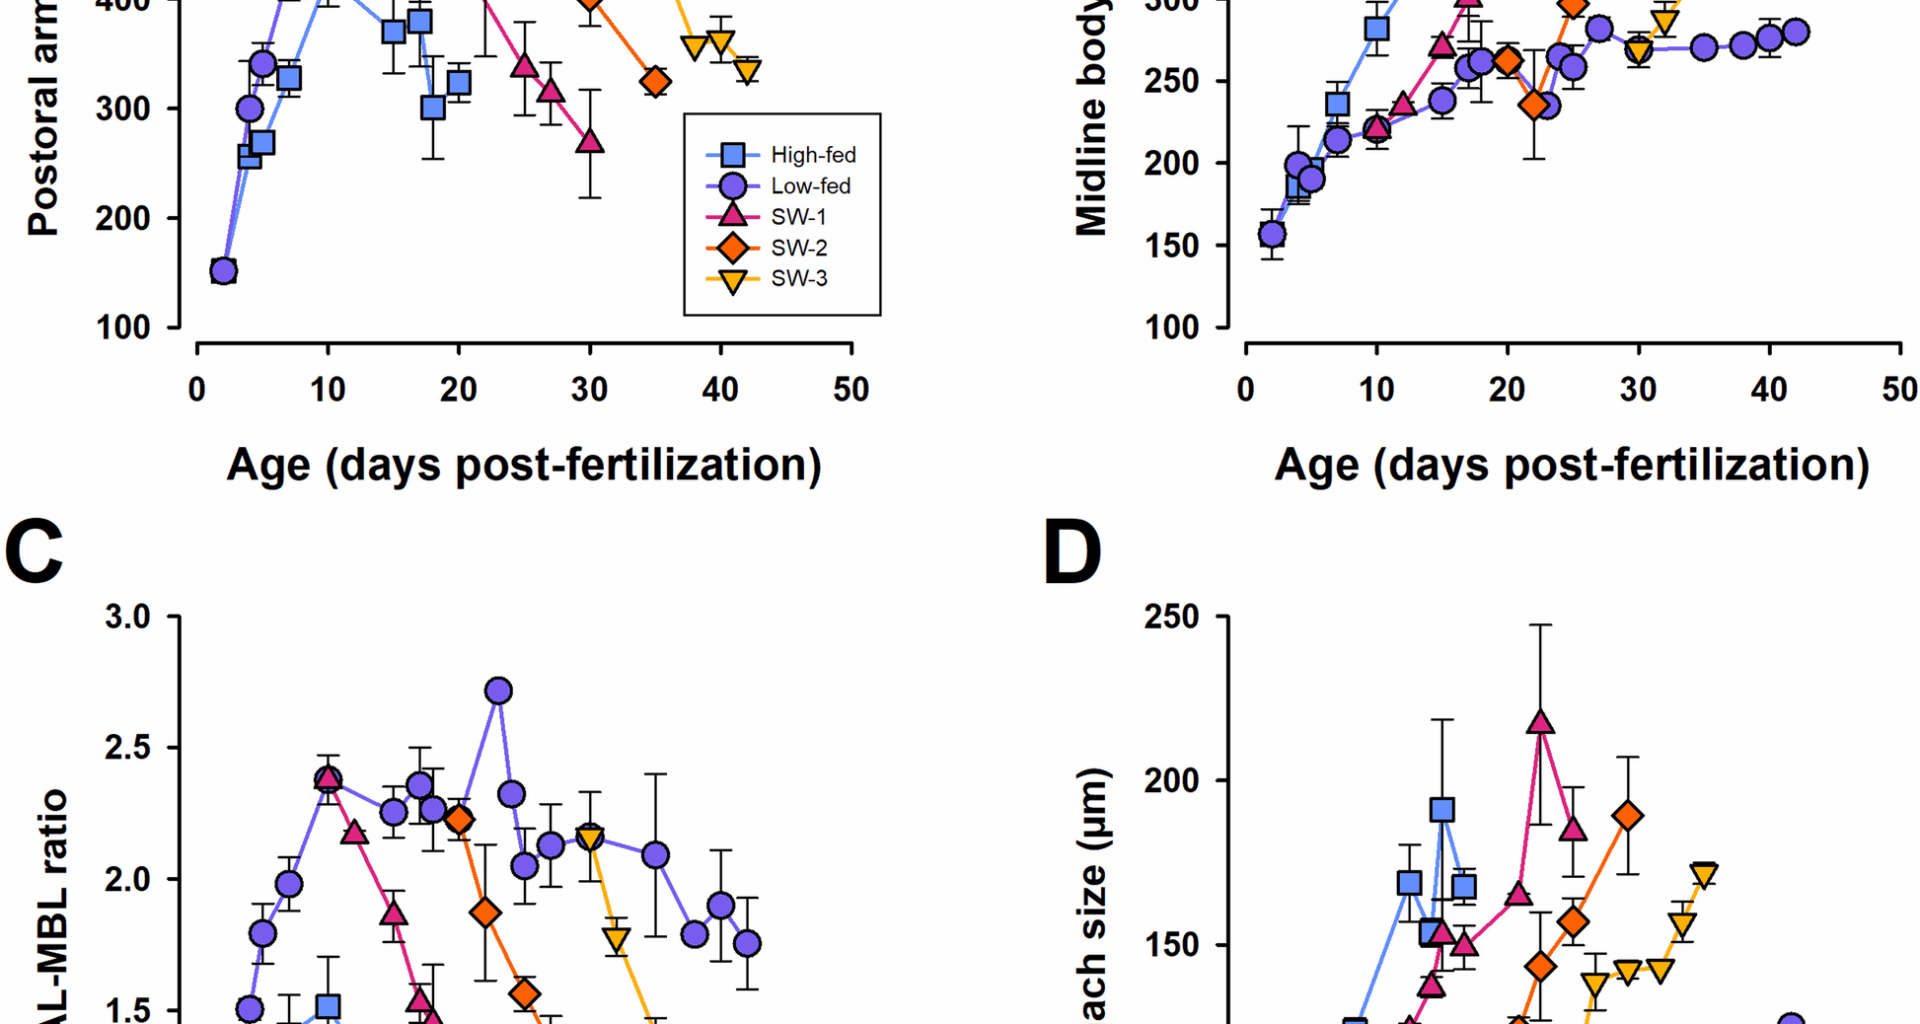
To assess larval growth and morphological plasticity in response to feeding conditions, photos of at least 10 larvae were taken for each treatment every 3–5 days with additional photos taken 2-day post-switch. The larvae were relaxed with an equal volume of 7.5% MgCl2 and fixed with 10–15 µL of 16% paraformaldehyde before being placed on glass slides with a raised cover slip. Larvae were immediately photographed using an Olympus EP50 camera mounted on a Nikon Eclipse 80i microscope. Postoral arm length (POAL) and midline body length (MBL) were measured as previously described [13, 25] (Additional file 1: Fig. S6). POAL length was defined as the length from the intersection of the postoral arm rod with the transverse rod to the end of the arm (i.e., where tissue stopped, which was always longer than the end of the arm rod) [30]. POAL was used as a proxy for ciliated band length [12, 25]. POAL-MBL ratios were calculated so that changes in POAL could be standardized to larval body size [25, 31]. Stomach size (SS) was determined by measuring the stomach length (SL) and stomach width (SW) (including the epithelial lining surrounding the stomach cavity) (Additional file 1: Fig. S6). Stomach size was then determined by taking the square root of the stomach area (assuming the shape of an ellipsoid where the stomach length and width are the ellipsoid axes) [30]. Rudiment size was measured for SW-20 and SW-30 treatments when they were switched from low to high food conditions (20 and 30 DPF, respectively). Rudiment size was not considered for SW-10 because at 10 DPF, this treatment had no rudiment. Rudiment size was calculated as the square root of the cross-sectional area using the rudiment length and width as the main axes values [30]. Larval dimensions were measured using FIJI [65] calibrated using an image of a stage micrometer taken under identical conditions as the larval images. To ensure no artifacts were introduced by way of fixing larval tissue, in a separate experiment, we compared all morphometric characters (POAL, MLB, POAL-MBL, SL, SW) in live larvae and in fixed larvae. No significant differences were observed for all measurements (P > > 0.05; data not shown). To further reduce the introduction of artifacts, all images were taken within 5 min of fixation.
T-tests were used to compare POAL-MBL ratios 5 days after switching from low to high food concentrations for each switched treatment (SW-10, SW-20, and SW-30). Each treatment was compared with the same-aged larvae from the constantly low-fed treatment (e.g., SW-10 was compared at 15 DPF with low-fed larvae at 15 DPF). A t-test was also used to compare rudiment size in SW-20 and SW-30 larvae when switched from low to high food conditions on the day each treatment was switched to high food conditions. Prior to these comparisons, assumptions of normality and equality of variances were confirmed (P > 0.05) using an Anderson–Darling test [66] and Levene’s test for homogeneity of variance [67], respectively. T-tests were conducted using Minitab Statistical Software (v20.3).
Protein biomass
Triplicate aliquots of 300–500 larvae were collected from each treatment every 3–5 days for protein biomass analysis. Larvae were placed into 1.5-mL tubes and spun down at 1000 g at 4 °C for 2 min; excess seawater was then aspirated from the sample before storing the pelleted larvae at − 80 °C. Protein biomass was determined using a BCA Protein Assay Kit (Thermo Fisher Scientific) [68]. Frozen samples were resuspended in nanopure water and sonicated at 30% amplitude for three pulses of 3 s each while on ice (Fisher, Sonic Dismembrator). Assays were conducted per manufacturer’s instructions and absorbance quantified at 562 nm using a BioTek Synergy H1 Hybrid Plate reader. A standard curve using bovine serum albumin was used to relate absorbance with protein amount. Data were log10-transformed for statistical analyses to correct for non-linearity, non-normality, or unequal variances. Protein biomass at 63% metamorphic competence was compared among all treatments using a one-way ANOVA in which culture was a random factor and treatment was a fixed factor (Minitab Statistical Software v20.3). Assumptions of normality were confirmed (P > 0.05) using an Anderson–Darling test.
Ingestion rates
Daily ingestion rates (IR) were measured for all three cultures as previously described [25, 26]. Algal concentrations were measured daily by flow cytometry and used to record the number of algae eaten and to estimate the number of algal cells required to bring cultures back to treatment conditions. Algal concentration was determined by taking two samples from each culture and determining the average. Samples were acquired through a 50-μm-pore Nitex mesh to ensure no larvae were removed. Ingestion rate (IR; algal cells larva−1 day−1) was calculated with the equation as follows:
$$\text{IR }=\frac{{(C}_{i} – {C}_{f}) \times V}{\text{t}\times n}$$
“Ci” and “Cf” represent the initial and final algal concentration (algal cells mL−1) for each treatment. Initial algal concentration was measured after restocking to ensure algal concentrations were within 10% of the target. “t” is time between the initial and final algal measurements, “V” is the total volume in the culture vessels (20,000 mL), and n is the number of larvae in the experimental vessel. The number of larvae in each vessel was determined during every water change using volumetric sampling. For IR calculations on non-water change days, larval numbers were estimated by interpolating between sampling days using linear regression.
Respiration rates
Larval respiration rates were measured for all three low to high switch experiments using the µBOD method of Marsh and Manahan [69]. Larvae were enumerated and resuspended in oxygen-saturated FSW equilibrated to 16 °C. They were immediately loaded into seven µBOD vials (~ 500 µL), capped, and placed in a water bath at 16 °C. An additional three µBOD vials contained only seawater to account for non-larval oxygen consumption. Samples were incubated for 2–4 h depending on developmental stage. Oxygen was then measured using a polarographic oxygen sensor (Strathkelvin Instruments) calibrated by injecting oxygen-saturated FSW (16 °C) to set the maximum O2 concentration (249.8 µmol L−1). After incubation in the µBOD vials, larvae were centrifuged to the bottom of the µBOD vial and a water sample acquired using a 500-µL gas-tight Hamilton syringe. Approximately, 400 µL of sample was immediately injected into a Strathkelvin oxygen electrode chamber which held a volume of ~ 70 µL (injected volume was more than five times the sample port volume, ensuring adequate displacement of seawater already in the sample port). After injection, the electrode was given 1 min to stabilize before recording oxygen concentration (pmol O2 L−1). After oxygen measurements, the number of larvae in each vial was counted. Total oxygen consumed for each treatment (larval rates — control rates) was linearly regressed against the number of larvae in each vial; the resulting slope represented respiration rate in units of pmol O2 h−1 larva−1 [69].
Energetics analyses
Estimates of total cost of growth, assimilation efficiency (AE), and net growth efficiency (NGE) for all three cultures were made following the protocols of previous studies examining physiological energetic efficiencies in larvae of D. excentricus [25, 26]. AE and NGE were calculated using the following equations:
$$\text{AE }= \left[\frac{\text{M}+\text{G}}{\text{I}}\right] \times 100$$
$$NGE = [\frac{G}{M+G}] \times 100$$
“I” represents exogenous energy acquired by the larvae, “M” represents the energy used to fuel growth and development, and “G” represents the energy invested into larval growth. Budgets were constructed using the following assumptions: (1) Energetic intake (I) was only through algal consumption, (2) rates of oxygen consumption represent total larval energy expenditure through metabolism (M), and (3) changes in total protein content throughout development represent energy allocated to growth (G). Daily rates of algal ingestion were converted to units of energy acquired (“I”) using a value of 2.25 µJ (algal cell)−1 based on the specific energetic content of Rhodomonas sp. [70]. Respiration rates were converted to energic units (“M”) using an oxyenthalpic conversion of 484 kJ mol O2−1 [71]. Protein growth rates were converted to energetic units using a conversion factor of 24 kJ g−1 of protein [71]. Growth in larvae of D. excentricus is predominantly through increasing protein biomass; carbohydrates represent less than 1% of biomass in marine invertebrate larvae [52, 53]. Lipid growth in larvae of D. excentricus is significantly slower relative to protein and only represents 5–7% of total larval biomass in low- and high-fed larvae [25]. From an energetic perspective, proteins are one of the most expensive types of macromolecules to synthesize and deposit, regardless of environmental conditions [48, 49]. Therefore, only protein biomass was considered for energetic efficiency calculations.
The primary physiological data of algal ingestion, respiration, and protein growth were used to create best-fit models for I, M, and G, respectively. For each replicate culture (N = 3) and treatment, primary physiological data were log10-transformed to correct for nonlinearity, non-normality, or unequal variances. These linear regression values (slope and y-intercept) were then used to model the change in each energetic variable (I, M, and R) throughout larval development. Time of development considered in these models ranged from the start of feeding (2 DPF) until the larval age when the treatment reached 63% metamorphic competence (this age varied by treatment). For constant high-fed and low-fed treatments, single continuous models were created. For switched larval treatments, two models were generated. The first model described the changes in the respective energetic parameter while being fed a low food ration (1000 cells mL−1). The endpoint of this model was the DPF when food was switched from low to high conditions (e.g., for SW-10, the pre-switch model ended at 10 DPF). The second model described changes when switched to a high food ration (10,000 cells mL−1). The endpoint for each model was when a metamorphic competence of 63% was achieved (determined through an induction assay, see below) or, in the case of low-fed larvae, when it was estimated to occur based on a linear extrapolation. For example, the first part of the SW-10 model ranged from 2 to 10 DPF (when they were receiving a low algal ration of 1000 cells mL−1) and the second part of the model from 10 to 25 DPF (when they were receiving a high algal ration of 10,000 cells mL−1). The individual models (I, M, and G) created from these estimates are shown in Additional file 1: Fig. S3. The final model for each variable was created by using the average of each of the three independent models.
The total cost of development was calculated by using the cumulative amount of energy consumed through metabolism throughout larval development (M). Efficiency values were calculated by summing the daily amounts of energy apportioned to each process (I, M, and R). These cumulative energetic values were then used to calculate AE and NGE. For constant low- and high-fed larvae, this required only one calculation (for each replicate culture) as the feeding treatments were constant throughout development. For the switched treatments (SW-10, SW-20, and SW-30) these energetic values were calculated twice throughout development: once while they were receiving the low algal ration of 1000 cell mL−1 (“pre-switch efficiency”) and once for the remaining period of development when they were receiving the high algal ration of 10,000 cells mL−1 (“post-switch efficiency”). For example, for SW-10, pre-switched estimate of M was the total amount of energy used at from 2 to 10 DPF; the post-switch estimate of M was from 10 to 25 DPF (the larval age when 63% metamorphic competence was achieved). To ensure that any pre- and post-switch differences were not driven by developmental changes independent of changes in food level, efficiency calculations were made in the constant low-fed treatment as well, using the same switch time points as the SW-10, SW-20, and SW-30 treatments. Similar approaches to modeling the cost of growth and growth efficiency have been used in numerous studies in a wide range of organisms (e.g., [68, 72,73,74,75,76]).
Comparison of the total energetic cost of development was conducted using a one-way ANOVA in which algal feeding treatment (constant low- or high-fed and larvae switched from low to high food conditions at 10, 20, or 30 DPF) was a fixed factor and culture was a random factor. The ranking of differences in cost of development was conducted using post hoc Tukey simultaneous tests for differences in means. AE and NGE were compared among larval treatments in which food was switched from low to high rations at different larval ages (SW-10, SW-20, and SW-30) using an ANOVA where feeding level (pre-switch = low algal ration and post-switch = high algal ration) and age at switch (10, 20, or 30 DPF) were fixed factors and culture was a random factor. Prior to analysis, assumptions of normality were confirmed (P > 0.05) using an Anderson–Darling test. Statistical analyses were conducted using Minitab Statistical Software v20.3.
Larval metamorphic competence
Metamorphic competence was evaluated starting at 16 DPF (when high-fed larvae showed significant rudiment development and a decrease in algal feeding rates) every 2–5 days for all treatments until a minimum of 80% of larvae sampled achieved metamorphic competence or after 50 days had elapsed (for the constant low-fed treatment). Metamorphic competence was based on the previously published definition as the stage where larvae exhibit obvious retraction of tissue surrounding the skeletal rods of the arms when exposed to settlement cues [77,78,79]. We used excess KCl as a settlement cue, which has been used previously in echinoid larvae [29, 79, 80] and in the case of competent larvae of D. excentricus results in a settlement response within 1 h, resulting in 95% of larvae completing metamorphosis with no mortality [77]. We therefore considered the arm tissue retraction response to excess KCl as indicative of larvae being metamorphically competent. Larvae (50–100) were placed in a 6-well plate with 2 mL of 40-mM excess KCl in FSW. Larvae were then incubated for 1 h at 16 °C and then inspected for arm tissue retraction using a stereomicroscope. Logistic regressions were carried out in R 1.4.1717 (R Core [81]) to estimate the age (DPF) when each treatment reached 63% competence. A metamorphic competence of 63% (meaning 63% of the population responded to the induction assay by showing obvious tissue retraction) was used as a standard developmental benchmark for physiological measurements. The reason for this was that (1) physiological analyses required measurements on populations of larvae; therefore, a common population end-point was required for reasonable comparisons between feeding treatments, and (2) as larval populations approach advanced stages where settlement is imminent, physiological parameters change and become more representative of juvenile physiology (e.g., rates of unicellular algal ingestion decrease, thereby confounding estimates of growth and assimilation efficiencies during larval development).
Individual larval morphometric analysis
Morphological plasticity in individually tracked larvae that were switched from low to high food concentrations was assessed in an independent culture. The same spawning, culturing, and morphological measurement methods described above were used except that larvae were kept alive during photography. Larvae were initially grown in population (1 larva mL−1) and given a low food diet (1000 cells mL−1) that was replenished daily. For this assessment, we choose to examine phenotypic induction at two different points, both approximately halfway through their larval development (based on the results of the population level analyses described above). In the first experiment, 10 individual larvae were randomly chosen at 13 DPF. These larvae were photographed alive for measurement of POAL and MBL. Each larva was then placed in a separate 500-mL beaker containing FSW and a high food diet (10,000 cells mL−1). Each beaker was stirred using a swinging paddle system operating at a frequency of 4 strokes per min−1 [82]. After 6 days of development (19 DPF) in high food conditions, each larva was removed from its 500-mL beaker and photographed again. This experiment was repeated using larvae from the same initial low-fed culture. This time, 10 larvae were randomly selected at 20 DPF, photographed alive for morphological measurements, and moved to high-fed conditions in individual 500-mL beakers. These larvae were then measured again after 6 days of feeding at 26 DPF. A paired t-test was used to compare pre- and post-switch larval morphology, with each larva representing an independent replicate. Prior to analysis, assumptions of normality were confirmed (P > 0.05) using an Anderson–Darling test. Statistical analysis was conducted using Minitab Statistical Software v20.3.
Reversible plasticity response (switching larvae from high to low food conditions)
Two experiments were conducted to examine the morphological consequences of switching from high to low food conditions (hereafter called a reversible plasticity response) (Additional file 1: Fig. S5B). Both experiments were independent cultures initiated as described above with gametes from three males and three females. The two experiments differed in the volume of the culture and the method of mixing of the cultures (so as to keep larvae and algal food evenly distributed in the respective culture vessels). The first experiment, high to low Exp-1, was conducted in 20-L vessels (the same culturing methods used for the low- to high-switched population experiments described above). The second experiment, high to low Exp-2, was conducted in 1.8-L beakers where mixing was achieved using a swinging paddle system operating at a frequency of 4 strokes min−1 [82] (same as the culture system for tracking individual larval responses described above). For both experiments, constant low- and high-fed larvae were fed 1000 and 10,000 algal cells mL−1, respectively. Switched larvae were fed 10,000 algal cells mL−1 until 7 DPF when the algal concentration was reduced to 1000 algal cells mL−1. This earlier age for switching was chosen because high-fed larvae developed faster than the low-fed larvae in the inducible plasticity experiments (above), and we wished to test the phenomenon of reversible plasticity in larvae with little to no rudiment development. For both experiments, morphology was measured throughout development (as described above) to 20 DPF (high to low Exp-1) and 15 DPF (high to low Exp-2). To test for a reverse plasticity response in POAL (i.e., an increase), a repeated measures ANOVA was conducted comparing all three treatments (constant low- and high-fed larvae and high- to low-switched larvae) starting from 10 DPF (first measurement after switching from high to low food conditions) to end of period of observation. Prior to analysis, normality of data was confirmed using an Anderson–Darling test.