
Study approval
All experimental animal procedures were performed in compliance with the Chinese. The study was conducted in accordance with the Laboratory Animal Guidelines for Ethical Review of Animal Welfare and was approved by the Zhejiang Chinese Medical University Experimental Animal Management and Ethics Committee (ZSLL-2018-19).
Healthy human PBMCs were obtained from recruited donors with the approval of the regional ethics committee of the Second Affiliated Hospital of Zhejiang University, School of Medicine (G2018-200).
Cell culture and patient samples
Human hematological malignancy cell lines THP-1, Kasumi-1, Molm-13, and H9; human solid tumor cell lines AGS, HGC-27, HeLa, HEK293T, A549, HCT-29, and HT-116 were purchased from the American Type Culture Collection (ATCC) and cultured in accordance with the ATCC’s recommendations. THP-1, Kasumi-1, H9, AGS, HGC-27, HCT-116, and HT-29 cells were grown in RMPI-1640 medium (Gibco) containing 10% fetal bovine serum (FBS; BI), 100 IU/ml streptomycin, and 100 IU/ml penicillin (TBD Science). 293T, A549, and HeLa cells were cultured in DMEM medium (Gibco) with 10% FBS, 100 IU/ml streptomycin, and 100 IU/ml penicillin. Molm-13 and primary leukemia blasts were cultured in IMDM medium (GSEE-TECH) with 10% FBS, 100 IU/ml streptomycin, and 100 IU/ml penicillin. All cells were kept within a humidified incubator at 37 degrees Celsius with 5% CO₂. PMA (200 nM) was used to induce differentiation of THP-1 cells for 16–24 h before initiating drug treatment.
Primary AML samples were obtained from the Second Affiliated Hospital of Zhejiang University, School of Medicine and were approved by the local ethics committee (G2018-200).
Monocyte purification and differentiation
Healthy peripheral blood mononuclear cells were isolated from enrolled donors, and all experimental protocols were approved by the regional ethics committee of the Second Affiliated Hospital of Zhejiang University, School of Medicine (G2018-200). The cells were isolated using a Ficoll-Hypaque density gradient (TBD Sciences) and cultured in RMPI-1640 medium under the same conditions as the AML cell lines. Monocytes were separated and enriched by CD14+ magnetic microbeads (MCS), then differentiated into macrophages by culturing for 7 days in RMPI 1640 supplemented with 10% FBS, 100 IU/ml penicillin, 100 IU/ml streptomycin, and 10 ng/ml human granulocyte macrophage colony stimulating factor (GM-CSF) (R&D Systems) after washing to remove the non-adherent cells.
Plasmids, reagents, and antibodies
SAMHD1 and HSP90 wild-type (WT), point mutants, and truncation constructs were cloned into VR1012 as previously described.2,56 IPI-504 (Retaspimycin), STA-9090 (Ganetespib), PU-H71, nelarabine, clofarabine, vidarabine, decitabine, trifluridine, fludarabine, and cycloheximide were commercially obtained from Medchemexpress (MCE) and dissolved in dimethyl sulfoxide (DMSO); cytarabine (Ara-C) was obtained from Selleckchem Ltd. and dissolved in phosphate buffer saline (PBS). The following antibodies were used in this study: anti-SAMHD1 (Origene), anti-phospho-SAMHD1 (Thr592) (Prosci), Anti-phospho-Histone H2A.X (Ser139) (20E3) Rabbit mAb #9718 (CST). Anti-HA (Invitrogen), anti-HSP90 (ET1605-56), anti-GAPDH, and goat anti-rabbit/mouse horseradish peroxidase (HRP)-conjugated and FITC/rhodamine-conjugated secondary antibodies (Huabio).
Drug screening
To identify small-molecule drugs capable of effectively downregulating the SAMHD1 protein expression, we conducted functional screening of 122 small-molecule drugs (MCE; Supplementary Table 1) covering multiple cellular signaling pathways. The effects of drugs on SAMHD1 expression were assessed through western blot analysis and their levels were quantified via ImageJ.
Cytotoxicity assays
AML cells were seeded in triplicate into 96-well plates at a final density of 8000 cells/well and treated with various drug concentrations. Following a 72 h incubation at 37 °C, cellular viability was measured with a 3-(4,5-dimethylthiazol-2-yl)-2,5-diphenyltetrazolium bromide (MTT) kit (Sangon Biotech) as per the supplier’s instructions. Absorbance was measured at a wavelength of 570 nm (with a 630 nm reference wavelength) using a Molecular Devices SpectraMax Absorbance Reader. IC50 values were calculated using Prism 6 (GraphPad software).
Drug synergy was evaluated using the Chou-Talalay method and CompuSyn software.71 We calculated the CI values based on data from non-constant ratio drug combination experiments. CI < 1 denotes synergism, CI = 1 signifies an additive effect, and CI > 1 indicates antagonism.
Extraction of proteins and Western blot assay
Cell pellets were lysed in Radioimmunoprecipitation assay (RIPA) buffer (Beyotime Biotechnology) on ice with the addition of 0.1% (100 mM) of phenylmethylsulfonyl fluoride (PMSF) protease inhibitor (FDbio Sciences). For tumor tissue samples, approximately 100 mm3 tumor mass was dissected out and homogenized in RIPA buffer on ice.
The concentration of total protein was assayed by means of the Bradford assay (Bio-Rad). Equal amount of protein extracts were loaded onto denaturing 10% SDS-polyacrylamide electrophoresis (PAGE) gels and separated electrophoretically, before being transferred to nitrocellulose membranes (GE Whatman). Following this, the membranes were blocked with 5% skim milk (BD Biosciences), incubated with primary antibodies at 4 °C overnight, then with matching secondary antibodies at room temperature for 1 h. Protein bands were detected using enhanced chemiluminescence (ECL) reagents (Yeasen) on a Tanon 5200 imaging system; their intensities were quantified with ImageJ software (v1.53).
Co-immunoprecipitation
Cell populations were lysed using low-strength RIPA buffer (EMD Millipore) with the addition of protease inhibitor cocktail (Roche) for 2 h at 4 °C, then centrifuged at 13,000 × g for 20 min to clarify the proteins.
Protein A/G magnetic beads (Bimake) were incubated with either a specific antibody or an equivalent concentration of control IgG for 20 min at room temperature to create antibody-coated beads. These beads were then added to the cell lysate and incubated at 4 °C overnight. The magnetic beads were undergoing three washes with wash buffer (PBS with 0.2% Triton X-100). Bound proteins were then eluted by boiling the beads with 1x loading buffer (FDBio Sciences), and the immunoprecipitants were detected by immunoblotting.
HEK293T cells were subjected to transfection with the HA-tagged plasmid via Lipofectamine 2000 (Invitrogen) and were harvested 48 h later. Total proteins were extracted using the method described above and incubated together with HA-conjugated agarose beads (Roche) overnight. The agarose beads were then washed 4–5 times with wash buffer and eluted using glycine buffer (0.2 M glycine) for mass spectroscopy (MS) analysis or boiled with loading buffer for Western blot assay.
Mass spectrometry
Samples underwent sonication-mediated lysis (three cycles on ice) using a high-intensity ultrasonic processor (Scientz) in lysis buffer (8 M urea, 1% protease inhibitor cocktail). Following this, insoluble debris was sedimented by means of centrifugation at 12,000 × g for 10 min at 4 °C. After collecting the supernatant, protein concentration was assayed via a BCA kit (Bicinchoninic Acid; Beyotime) following the manufacturer’s recommended procedures.
For subsequent digestion, protein samples were subjected to reduction with 5 mM dithiothreitol at 56 °C for 30 min, and then to alkylation using 11 mM iodoacetamide at room temperature for 15 min in the dark. The samples were then diluted by adding 100 mM triethylammonium bicarbonate (TEAB) to a final urea concentration of less than 2 M. Trypsin was added at a 1:50 trypsin-to-protein mass ratio for overnight primary digestion, and at a 1:100 ratio for a 4-hour secondary digestion. The resulting peptides were then desalted with a C18 SPE column.
For liquid chromatography (LC) separation, tryptic peptides were dissolved in solvent A (0.1% formic acid in water) and directly loaded onto an in-house packed reversed-phase analytical column (15-cm length, 100 μm i.d.). The separation process was implemented on a Vanquish Neo UPLC system (ThermoFisher Scientific) at a constant flow rate of 400 nL/min. Mobile phases included solvent A and solvent B (0.1% formic acid, 80% acetonitrile in water), with the gradient program as follows: 4% B (0–0.5 min); 4%–8% B (0.5–0.6 min); 8%–22.5% B (0.6–13.6 min); 22.5%–35% B (13.6–20.5 min); 35%–55% B (20.5–20.9 min); 55%–99% B (20.9–21.4 min); 99% B (21.4–22.6 min).
For mass spectrometric analysis, separated peptides were analyzed on an Orbitrap Astral MS (ThermoFisher Scientific) equipped with a nano-electrospray ion source (1900 V operating voltage). The Orbitrap detector was used for precursor analysis, while the Astral detector handled fragment assessment. Full MS scans were set to a resolution of 240,000 over a 380–980 m/z range. MS/MS scans were acquired at 80,000 resolution, with a fixed initial mass of 150.0 m/z. HCD fragmentation employed a normalized collision energy (NCE) of 25%, and the automatic gain control (AGC) target was adjusted to 500%, with a 3 ms maximum injection time.
DIA-NN search engine (v1.8) was utilized for processing the generated DIA data. Tandem mass spectra were searched against the Homo sapiens database (FASTA file: Homo_sapiens_9606_SP_20241202.fasta, 20,422 entries) concatenated with reverse decoy database. Trypsin/P served as the specified cleavage enzyme (allowing up to one missed cleavage) for database queries. Fixed modifications included N-terminal methionine excision and Cys carbamidomethylation, while the FDR was adjusted to <1%. Protein-protein interactions of differentially expressed protein accessions were analyzed using the STRING database, and Cytoscape was employed to visualize the interaction network.
Immunofluorescent staining
AML cells (THP-1 and Molm-13) were cultured on cover glasses, fixed with 4% paraformaldehyde, and then permeabilized with 0.1% Triton X-100 for 20 min at room temperature. After blocking with 3% bovine serum albumin (BSA) for 30 min, the cells were incubated with primary antibodies (anti-SAMHD1 or anti-HSP90), followed by their corresponding FITC- or rhodamine-conjugated secondary antibody. Finally, coverslips were mounted using fluoromount-G containing DAPI (SouthernBiotech) for nuclear staining and visualization with a fluorescent microscope (ZEISS Axio). Images were acquired with a ZEISS Confocal Laser Scanning Microscope 710 (LSM710).
Tissue staining
For histological sample preparation, tissues were fixed in 4% paraformaldehyde over 24 h, prior to undergoing standard dehydration and paraffin embedding. The embedded blocks were cut into 4-μm sections and mounted on glass slides. Subsequent to deparaffinization and rehydration, the tissue slices were stained with H&E (hematoxylin and eosin) for histological assessment, following standard procedures. For immunohistochemistry (IHC), sections first underwent endogenous peroxidase-blocking and antigen retrieval. The tissue slices were then incubated with anti-SAMHD1 antibody for 1 h at room temperature. Immunodetection was performed using a diaminobenzidine (DAB) substrate per the manufacturer’s recommendations. Images were acquired by a NIKON DS-U3 vision system equipped with an mshot TV0.63XC-M0.
RT-qPCR
For gene expression quantification, total RNA was extracted from cells using the RNeasy mini Kit (Qiagen), and then reverse-transcribed into cDNA via the PrimeScript RT Master Mix (Takara). Next, quantitative real-time PCR was performed utilizing SYBR Green Master Mix (Takara) on a 7500 Fast Real-Time PCR system.
Primers used are as follows: SAMHD1-F: 5’-TCCATCCCGACTACAAGACA-3’, SAMHD1-R: 5’-TCTCGGATGTTCTTCAGCAG-3’, GAPDH-F: 5’-TCGACAGTCAGCCGCATCT-3’, GAPDH-R: 5’-CTTGACGGTGCCATGGAATT-3’, IFIT1-F: 5’-TTGATGACGATGAAATGCCTGA-3’, IFIT1-R: 5’-CAGGTCACCAGACTCCTCAC-3’, IFNB1-F: 5’-CGCCGCATTGACCATCTA-3’, IFNB1-R: 5’-GACATTAGCCAGGAGGTTCT-3’, IL1B-F: 5’-ATGATGGCTTATTACAGTGGCAA-3’, IL1B-R: 5’-GTCGGAGATTCGTAGCTGGA-3’.
RNA silencing
To knock down HSP90/SAMHD1 expression, pLKO.1 (Addgene, #8453)46 based lentivirus transduction system was used. Stable shHSP90 and shSAMHD1 HEK293T, and shHSP90 and shSAMHD1 Molm-13 cell lines were subsequently established under puromycin (1 μg/ml) selection for 2 weeks. The sequences of shRNA oligos are provided in the Supplementary Materials.
Flow cytometry
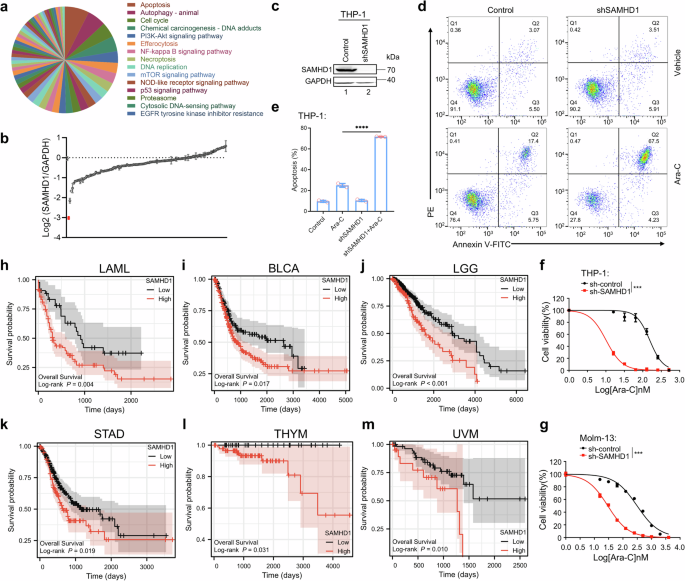
For apoptosis evaluation, AML cells were harvested, followed by staining with the Annexin V-APC/7-AAD apoptosis detection kit (MultiSciences) following the supplier’s recommended protocols. Data acquisition was performed on a Beckman Coulter flow cytometer, and the results were analyzed with FlowJo (Version X.07).
Orthotopic AML animal model
AML cells (Molm-13, 1 × 10⁶ cells/mouse) were transplanted into 7-week-old female NOD-Prkdcscid IL2rgtm1/Bcgen (B-NDG) mice (Biocytogen, Beijing, China)47 by tail vein injection. Following a 10-day engraftment period, mice were randomly assigned to distinct treatment groups in preparation for subsequent therapeutic interventions. Mice were treated daily with 15 mg/kg cytarabine via subcutaneous injection or 40 mg/kg STA-9090 formulated in 10/18 DRD (10% DMSO, 3.6% D-glucose and 18% Cremophor RH 40 in water) via intravenous injection. Clinical signs of disease (onset of limb paralysis) were monitored and recorded by our veterinarian. Treatment continued until mice succumbed or the disease progression reached at least one of four defined endpoints: rapid body weight loss of >20%, multiple (or single large) tumor masses, anorexia, or failure to drink. Overall survival was analyzed by the Kaplan-Meier method.
Heterotopic AML animal model
For establishing the xenograft animal model, 6 × 10⁶ Molm-13 cells were subcutaneously injected into the flank region of 7-week-old female B-NDG mice (NOD-Prkdcscid IL2rgtm1/Bcgen; Biocytogen, Beijing, China), with one dose per mouse.
Tumor volumes (V) were calculated by caliper measurement of the length (L) and width (W) of the tumors using the formula: Tumor volume = 0.5 × L × W2. When the tumor volume reached 400 mm3, the mice were randomly assigned to four treatment groups.
Mice received either 15 mg/kg cytarabine daily by intratumorally injection or 40 mg/kg STA-9090 by tail vein injection on days 1, 4, 6 of every 7 days, or both drugs. At 2-day intervals, tumor volumes and mouse body weights were assessed and recorded to monitor tumor growth and animal health status. When the tumor length reached 20 mm, the mice were humanely sacrificed, and tumors were dissected out for further H&E and IHC staining analysis.
Cell co-culture system
Spleens were harvested from humanely sacrificed c57 mice and rinsed with 75% reagent alcohol. The tissue was mechanically dissociated by mincing and pressing it through a cell strainer using a syringe plunger. The strainer was rinsed with PBS, and the cell suspension was collected into a 15 mL conical tube. Cells were sedimented via centrifugation (1500 rpm, 5 min), then resuspended in 3–5 mL of RBC Lysis Buffer and incubated for 5–10 min at room temperature. Subsequently, the resulting murine splenocytes were washed with PBS to remove lysis buffer and cellular debris.
HeLa cells were plated in 12-well plates at a density of 2 × 10⁵ cells per well, followed by overnight incubation to allow cell adherence, then add with resuspended murine splenocytes (3 × 10⁸ cells/well). Cell co-culture with drug treatment for 48 h, murine splenocytes were separated from the culture system, and HeLa cells were rinsed with PBS to prepare them for subsequent experimental analyses.
Kaplan–Meier survival analysis
Survival analysis was conducted using survminer package in R (Version 3.6.1). Level 3 FPKM RNAseq data and associated clinical information of BRCA, LGG and THYM were downloaded from UCSC Xnea. For each of the above tumor types, the samples were sorted in descending order according to the expression level of SAMHD1, and overall survival analysis was performed for the first (High expression group) and last quartile (Low expression group) of the samples.
Ex vivo natural killer cell cytotoxicity assay
Natural killer (NK) cells were purified from umbilical cord blood obtained from Zhejiang Province Umbilical Cord Blood Hematopoietic Stem Cell Bank. Isolation began with the dilution of the umbilical cord blood, followed by Ficoll density gradient centrifugation to isolate the PBMCs. Subsequently, magnetic-activated cell sorting (MACS) using a specific NK cell isolation kit (Miltenyi, catalog number: 130-092-657) was employed to selectively enrich for NK cells based on CD56 expression. The enriched NK cell population was further purified through fluorescence-activated cell sorting (FACS) with targeted antibodies. Finally, the purity and functionality of the isolated NK cells were validated via flow cytometry and functional assays.
To determine the ability of NK cells to kill tumor cells in vitro, an equal number of HeLa cells were seeded into 12-well plates one day prior to the experiment. The following day, the cells were transfected with either a SAMHD1 expression vector or an empty plasmid control. Twelve hours post-transfection, HSP90 inhibitor was added at a specific concentration. After an 18 h drug treatment, co-cultivation was initiated at an effector-to-target (E:T) ratio of 10:1 (NK cells to Hela cells). Cell death was monitored continuously, and unbiased photomicrographs were captured under a light microscope. Viable cell counting was performed on cells from parallel wells to evaluate cytotoxicity.
Statistical analysis
All statistical analyses were conducted using GraphPad Prism 6 software. Data are expressed as the mean ± standard deviation (s.d.). Group comparisons were analyzed via an unpaired two-tailed Student’s t-test, where p-values < 0.05 were defined as statistically significant. Significance levels are indicated as follows: ns (not significant); *p < 0.05; **p < 0.01; ***p < 0.001; ****p < 0.0001.