
There are two statistical oddities I’m monitoring as the National Hockey League regular season comes to a close.
The first is a personal favourite, and admittedly a bit quirky: The Utah Mammoth have yet to participate in a single shootout this year, something that hasn’t been done since the inception of the shootout in 2005-06.
The second concerns the league-average save percentage. With a week left to go, it’s still under 90 per cent (89.6), intrinsically tied to the explosion of offence around the NHL over the past few years. Should average league save percentage close under 90 per cent at season’s end, it will be the first time we have seen that happen since 1993-94.
More notably, it’s a continuance of a decade-long downward trend:
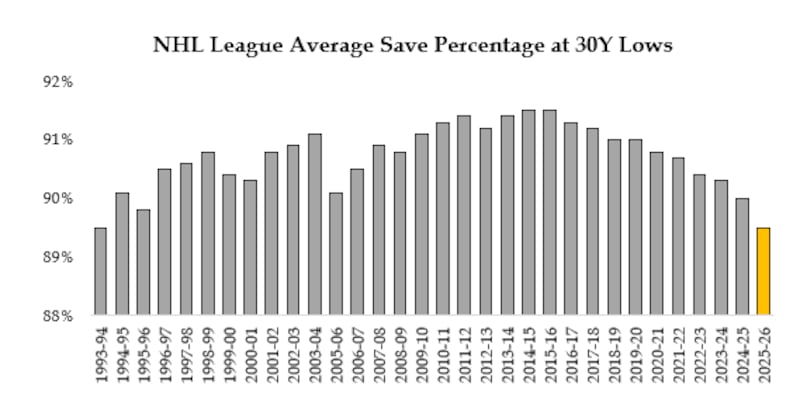 Yost1
Yost1
This is no small accomplishment, and apportioning the many reasons for the offensive explosion the league has realized over the years is not an easy exercise.
It’s never been easier for front offices to find skilled attackers, especially as the sport has grown globally. Others may highlight the modernization of the defensive position, the reduction of goaltender equipment sizes, or, as part of a counter-trend, the elimination of the workhorse goalie.
Ironically, teams have grown more comfortable balancing the workload in their goalie room as more talent has been piped into the NHL over the past two decades. It’s why you see so few goalies starting 60 or 70 games in the modern era. A half-dozen more games for your backup goaltender provides meaningful rest for your No. 1, even if it may mean an extra few goals against.
But such a meaningful shift in a legacy statistical measure like save percentage is notable. Save percentage, for my money, has been misapplied for many years; it’s not solely a measure of goaltender performance, but rather goaltender performance given the defensive structure and play in front. It’s intentionally combinatorial and, when used correctly, can be insightful.
Ten years ago, we were on the opposite end of the spectrum. Goals were difficult to come by and great teams established themselves by suppressing everything in the defensive third.
By way of example, consider every goalie from the 2015-16 season – the NHL’s save percentage peak – versus what we are seeing this year. Neither the talent at the position nor the talent in front of the goalies has deteriorated, and yet the results are remarkably different:
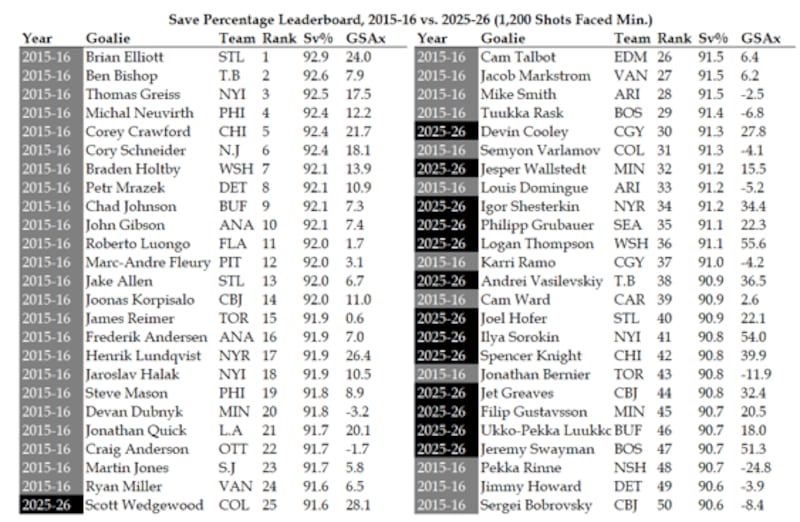 Yost2
Yost2
The only goalie from this season with a save percentage in the vicinity of what typical leaders looked like a decade ago is Colorado’s Scott Wedgewood, who has stopped 91.6 per cent of shots faced this year.
But perhaps the most remarkable juxtaposition might be the likes of 2015-16 Jonathan Bernier in Toronto versus the 2025-26 version of Ilya Sorokin on Long Island. Both stopped 90.8 per cent of shots in their respective seasons, but Sorokin has stopped 54 goals better than a replacement-level goaltender in the process; Bernier was worse than a replacement-level goaltender (-11.9 goals saved vs expected).
These goaltenders are stratospheres apart when it comes to measuring performance, but that’s only obvious if you can capture the significant shift in average save percentages.
To that end, save percentage remains an important barometer for analysis, but fans and analysts alike need to understand the baselines have materially changed
Data via Natural Stat Trick, NHL.com, Evolving Hockey, Hockey Reference
Related Stories