Time bisection task
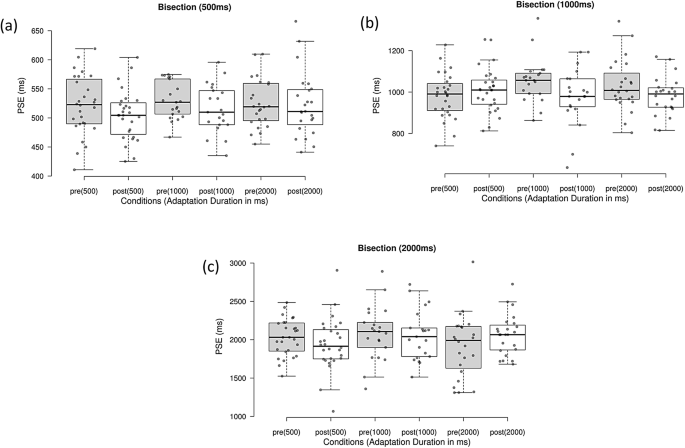
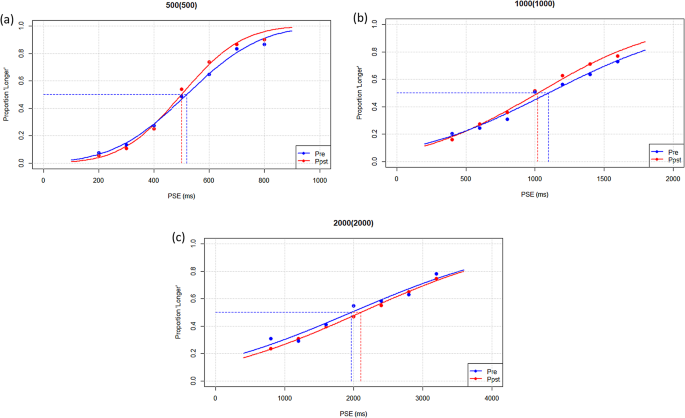
The valid n for the time bisection task analysis was 73 across the three adaptation conditions (500 ms: n = 28, 1000 ms: n = 21, 2000 ms: n = 24). A 3 × 3 Mixed ANOVA was conducted to ensure the baseline of the three groups of participants did not differ significantly (F(2, 70) = 1.94, p =.15, η2 < 0.01). Figure 2 presents the PSEs under different experimental conditions. Figure 3 presents samples of mixed-level psychometric curves of the three adaptation conditions.
A mixed 2 (pre-post adaptation) x 3 (adapted duration) ANOVA conducted on the PSEs of the 500 ms time bisection task showed no significant main effects (pre-post: F1,70=2.37, p =.13, η2 = 0.02; adapted duration: F2,70=0.83, p =.44, η2 = 0.01) or interaction effects (F2,70=0.41, p =.66, η2 = 0.01). The results of the 2000 ms time bisection task were similar (pre-post: F1,70=0.03, p =.86, η2 < 0.01; adapted duration: F2,70=1.08, p =.35, η2 = 0.01; interaction: F2,70=1.72, p =.19, η2 = 0.03). The main pre-post effects of the 1000 ms time bisection task were marginally significant (pre-post: F1,70=3.12, p =.08, η2 = 0.02), while the adapted duration was not (F2,70=0.46, p =.63, η2 = 0.01). Its interaction effect was marginally significant (F2,70=2.9, p =.06, η2 = 0.04). PSEs increased after adapting to 500 ms, while the other two durations reduced.
Only adapting to 1000 ms duration showed a significant main effect of adaptation on SEMs (F1,70=4.29, p =.04, η2 = 0.03): that is, the sensitivity was improved. Adapting to 500 and 2000 ms resulted in significant interaction effects: that is, in comparison to other longer durations, adapting to 500 ms appeared to reduce sensitivity (500 ms: F2,70=4.35, p =.02, η2 = 0.5; 2000 ms: F2,70=3.0, p =.05, η2 = 0.04). The analyses of the SEM of the PSEs did not provide sufficient support for the hypothesis that sensitivities increase after adaptation. Table 1 summarizes the PSEs and SEM analyses.
Table 1 Summary of planned analyses of bisection tasks.
Two exploratory 2 × 2 × 2 mixed ANOVAs were conducted to test the repulsion hypothesis. To test whether adapting to a longer duration would lead to a reduction of the PSEs, a mixed 2 (pre-post adaptation) x 2 (adapted duration: 500 and 1000) x 2 (task duration: 1000 and 2000) ANOVA was conducted (Table 2). Another mixed 2 (pre-post adaptation) x 2 (adapted duration: 1000 and 2000) x 2 (task duration: 500 and 1000) was conducted to test whether adapting to a shorter duration would lead to an extension of the PSEs. Adapting to longer duration significantly reduced the PSEs (F(1,43) = 7.12, p =.01, η2 = 0.14), while adapting to short duration did not significantly increase the PSEs (F(1, 47) = 1.19, p =.28, η2 = 0.03).
Table 2 Summary of exploratory analyses of bisection tasks (a) adapting to duration longer than or equal to the tasks and (b) adapting to duration shorter than or equal to the tasks.Fig. 2
Boxplots of PSEs in bisection tasks using the BoxPlotR tool (Spitzer, Wildenhain, Rappsilber & Tyers, 2014 [25]). Center lines indicate the medians, while box limits denote the 25th and 75th percentiles, as determined by the R software. Error bars denote the 5–95% percentiles. The panels indicate the results of the (a) 500, (b) 1000, and (c) 2000 ms time bisection tasks.
Plots of psychometric curves based on average data in conditions where the adaptation and task duration are the same, using RStudio (https://posit.co/download/rstudio-desktop/) and R version 4.5.1 (https://cran.rstudio.com/). The panels display the curves for bisection task conditions: (a) 500 (500) [n = 28], (b) 1000 (1000) [n = 21], and (c) 2000 (2000) [n = 24].
Time production task
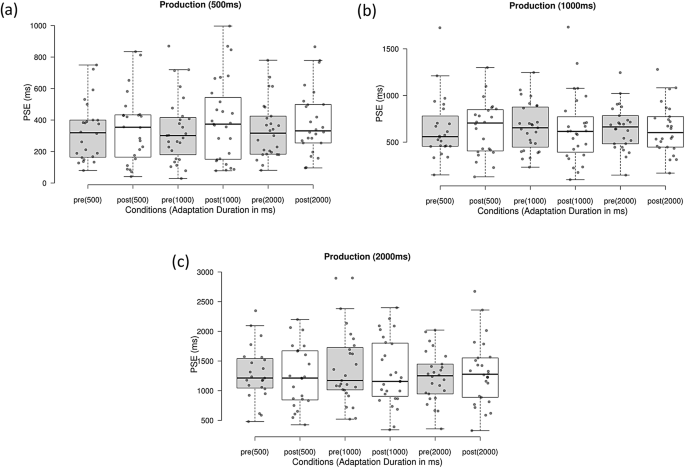
The valid n for this analysis was 77 (0.5s: n = 24, 1s: n = 27, 2s: n = 26). A 3 × 3 Mixed ANOVA was conducted to ensure the baseline of the three groups did not differ significantly (F2, 74 = 0.28, p =.76, η2 < 0.01). Table 3 presents the test statistics. Mixed 2 (pre-post adaptation) x 3 (adapted duration) ANOVAs were conducted separately for the three production durations. Only 500 ms showed a significant main effect on pre-post adaptation (F1,74=7.60, p =.01, η2 = 0.01), while the produced durations of 1000 ms (F1,74=0.11, p =.74, η2 < 0.01) and 2000 ms (F1,74=1.16, p =.28, η2 < 0.01) were not significant. The 500 ms productions were significantly underestimated after adaptation. The adapted durations did not have any statistically significant main effect, indicating that adapting to different durations (i.e. 500, 1000, and 2000 ms) does not produce differentiated adaptation effects (F2,74= 0.01–0.23, p =.80 − 1.0, η2 < 0.01). The interaction effects were also not statistically significant (F2,74=0.04–0.54, p =.58-0.96, η2 < 0.01). Figure 4 illustrates the descriptive data in boxplots.
Table 3 Summary of planned analyses of production tasks.
Mixed 2 × 3 ANOVAs were conducted on the SDs of the respective produced durations. There appeared to be a general adaptation effect: that is, sensitivity increased in producing 500 ms (F2,74=8.09, p =.01, η2 = 0.03) and 1000 ms (F2,74=5.13, p =.03, η2 = 0.02) after adaptation. The time production of 2000 ms showed a similar trend, but this was not statistically significant (F2,74=7.60, p =.14, η2 = 0.01). The main effect of adapted duration and interactions was not significant (F2,74=0.08–0.77, p =.47-0.92, η2 < 0.01).
Boxplots of PSEs in production tasks using the BoxPlotR tool (Spitzer, Wildenhain, Rappsilber & Tyers, 2014 [25]). Center lines indicate the medians, while box limits denote the 25th and 75th percentiles, as determined by R software. Error bars denote the 5–95% percentiles. The panels indicate the results of the (a) 500, (b) 1000, and (c) 2000 ms time bisection tasks..


