
Patient baseline characteristics
One hundred thirty-seven blood samples were collected between January 2021 and December 2022, with a median of 6.5 samples per patient (range: 3–20) from sixteen patients with R/M HNSCC being treated with ICB therapy. The median age was 62 years old (range: 52–91). The oral cavity was the most common anatomic subsite (8/16, 50%), and most patients received pembrolizumab monotherapy (11/16, 69%). Most patients had a CPS ≥20 (11/16, 69%). Among patients with virally-driven tumors, three patients had HPV-associated oropharyngeal carcinoma (OPC), one patient had HPV-associated nasopharyngeal carcinoma (NPC), and one patient had Epstein-Barr Virus (EBV)-associated NPC.
Plasma ctDNA testing results
The overall ctDNA detection rate across all samples was 57% (78/137) (Fig. 1A, B). The median %eVAF was 0.1399 (range: 0.0007–7.0738) (Table S1). Patient baseline characteristics are summarized in Table 1. 88% (14/16) of patients had a pre-ICB plasma sample (considered the baseline sample for this study) available for analysis (Patients 02, 03, 06, 08, 09, 10, 13, 14, 15, 18, 19, 20, 25, 26) with 12/14 (85.7%) being ctDNA positive (Patients 02, 03, 06, 08, 09, 10, 13, 14, 19, 20, 25, 26; median %eVAF: 0.28, range: 0.004–1.8). The two patients with negative baseline ctDNA had regionally or distant metastatic oral cavity SCC: Patient-15 had an enlarging 2.5 × 1.5 cm lung mass, and Patient-18 had a 4.1 × 5.5 × 5.7 cm cystic neck mass.
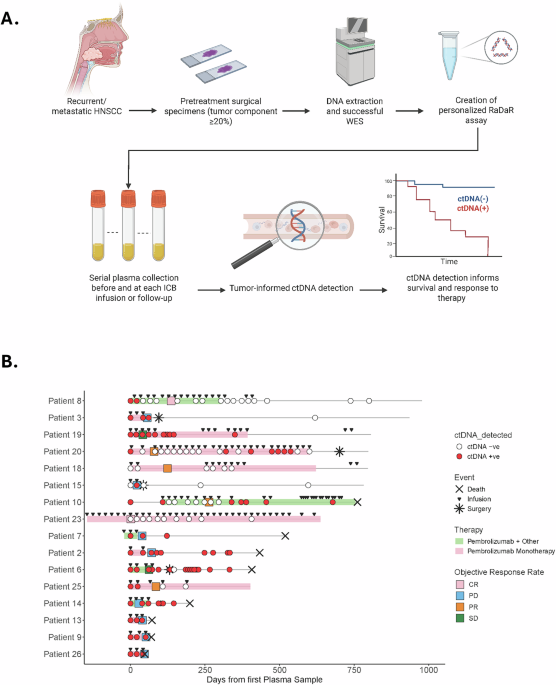
Fig. 1: Tumor-informed ctDNA workflow and swimmer plot for the entire cohort.
A Pretreatment FFPE tumor tissue from patients with HPV-independent HNSCC undergoing ICB therapy was obtained. DNA was extracted specimens with >20% of tumor component, and WES was performed to identify somatic mutations used to create personalized assays (RaDaR) for each patient. Plasma was obtained before and during ICB treatment, and each plasma sample was assessed for ctDNA detection. B Swimmer plot shows longitudinal monitoring of ctDNA, treatment, and response. CR complete response, PD progressive disease, PR partial response, SD stable disease. Patients 6, 8, 10 and 14 received a combination of immunotherapy plus chemotherapy. Patient 7 received Pembrolizumab plus ALX148 (anti-CD47).
Table 1 Clinical characteristics of the cohort
The cohort consisted predominantly of patients belonging to LB-RECIST response Group 1 (detectable ctDNA that remains detectable after therapy; n = 9; Patients 02, 03, 06, 07, 09, 13, 14, 19, 26) or Group 2 (detectable ctDNA that became undetectable after therapy; n = 4; Patients 08, 10, 20, 25). One patient was classified as Group 3 (undetectable ctDNA at baseline that becomes detectable after therapy; Patient-15), and two patients were classified as Group 4 (undetectable ctDNA that remains undetectable after therapy; Patients 18, 23). Additionally, based on the quantitative response criteria categories, most patients showed ctDNA progressive disease (CPD; n = 8; Patients 02, 03, 07, 09, 13, 14, 15, 26), which is defined as an increase of >10% in eVAF or de novo ctDNA detection. The four patients belonging to LB-RECIST Group 2 were defined as having experienced a ctDNA complete response, defined as ctDNA clearance after initial detection25,26 (Table 2). The median follow-up time was 19 months (range: 1.5–42.6). When defining response by RECIST 1.1 or clinical assessment (if RECIST was not evaluable), there were two patients with best ORR of complete response (12%, CR), four patients with partial response (25%, PR), two patients with stable disease (12%, SD), and eight patients with progressive disease (50%, PD) (Table 2). The median time to achieve ctDNA negativity was 2.5 months (range 0.7–20.6), and the median time for ctDNA detection after clearance was 7 months (range 1.3–9.3). Three patients died from progressive disease soon after starting ICB therapy (Patients 09, 13, 26). For the remaining thirteen patients, a median of 1 (range 0 to 5) subsequent line of treatment was received (including systemic therapy and salvage or palliative local therapy) following disease progression on ICB therapy. A median of four ICB infusions were administered (range 2–35), and a median of 13 months (range 1.3–27) elapsed from ICB initiation until death from any cause.
Table 2 LB-RECIST and radiological RECISTv1.1 in the cohort
Eight patients (Patients 02, 03, 06, 07, 08, 10, 14, 15) had samples available after stopping ICB. Seven halted ICB due to PD, whereas one patient stopped ICB due to adverse events but showed no evidence of recurrence (Patient-08). Among those who developed PD, three (Patients 03, 06, 15) proceeded to multimodality therapy and demonstrated a decline in ctDNA to undetectable levels. By contrast, the remaining four patients with disease not amenable to salvage local therapy (Patients 02, 07, 10, 14) exhibited an increase in ctDNA levels immediately after stopping ICB. Notably, in the patient who had achieved a complete response from ICB (Patient-08), ctDNA levels remained undetectable following cessation of ICB. Lead time from ctDNA clearance to corresponding imaging response could not be accurately assessed because blood sample collection for ctDNA analysis and imaging assessment only coincided for a small selection of patients.
ctDNA negativity predicts disease control
Among the four patients who experienced a ctDNA CR (LB-RECIST Group 2; Patients 08, 10, 20, 25), one had a RECIST 1.1 CR (Patient-08), and three had RECIST 1.1 PR (Patients 10, 20, 25) (Fig. S1, Table S2). Importantly, those patients experienced ctDNA clearance due to ICB. Two of those four patients (Patients 08, 20) experienced immune-related adverse events (colitis and pneumonitis) after 1 and 1.5 years on ICB, respectively. In univariable analyses, we found that neither ICB regimen, CPS, nor line of therapy were predictive of ctDNA clearance. Early on ICB therapy, the sensitivity and specificity of ctDNA negativity to predict an overall response (CR or PR) were 75% and 100%, respectively. Patients without pre-ICB sample available (n = 2) and with persistently negative ctDNA levels (n = 1) were also included in the analysis. For this analysis, ctDNA was assessed after a median of two infusions (range 1 to 7) and within a mean of 13 days (range –4 to 142) of radiological (n = 14) or clinical (n = 2) confirmation of RECIST 1.1 assessment. Interestingly, two patients (Patients 06, and 19) were classified as having stable disease (SD) despite a positive ctDNA result (Table 3).
Table 3 Radiographic and ctDNA molecular response
We performed logistic regression analyses to assess undetectable ctDNA as a predictor of treatment response ([1] ORR: CR/PR versus SD/PD; and [2] disease control: CR/PR/SD versus PD). In univariable analysis, undetectable ctDNA at any time during the study period (either pre-treatment or on-treatment) was predictive of a 21-fold increase in odds of achieving disease control (CR, PR, or SD) (95% CI 2.04–558.55, p = 0.0236). This association remained significant in multivariable analyses controlling for PD-L1, ICB regimen, and line of therapy (OR 21.7, 95% CI 1.86–754.88, p = 0.0317). To ensure these results were not driven by the two patients in our cohort belonging to LB-RECIST Group 4 (patients who never had detectable ctDNA), we performed a sensitivity analysis by excluding Patients 18 and 23 and observed that this finding persisted (univariable OR 15, 95% CI 1.37–408.3, p = 0.04; multivariable OR 14.5, 95% CI 1.06–560.5, p = 0.07).
Undetectable ctDNA predicts improved overall and progression-free survival
Across all patients, the median OS was 19.9 months, and the median PFS was 2.7 months (Fig. 2A, B) from ICB initiation. In univariable analyses, we found no difference in OS or PFS when stratified by ICB regimen, CPS, recurrence type (locoregional versus distant versus both), primary anatomical site, or virus (HPV or EBV) status. In our cohort, five patients received combined treatment (Patients 06, 07, 08, 10, 14). Four patients received ICB combined with chemotherapy (Patients 06, 08, 10, 14), and one received a combination of ICB and an experimental anti-CD47 antibody therapy (Patient-07). We analyzed the survival and response outcomes for those subpopulations and found no difference among groups for OS (HR 1.87, 95% CI 0.49–7.13; p = 0.35), or PFS (HR 0.93, 95% CI 0.28–3.04; p = 0.91). However, ctDNA negativity was found to be a significant predictor of improved OS and PFS. In univariable analyses, patients who had undetectable ctDNA at any point during the study period, including patients who were always negative during the study period (Patients 18, and 23; LB-RECIST Group 4), had better OS (HR 0.10, 95% CI 0.02–0.48, p = 0.001) and PFS (HR 0.17, 95% CI 0.04–0.69, p = 0.006). In multivariable analyses controlling for CPS, ICB regimen, viral status, and recurrence type, the association remained significant for both OS (HR 0.04, 95% CI 0.00–0.47, p = 0.0103) and PFS (HR 0.03, 95% CI 0.00–0.37, p = 0.0057) (Fig. 2C, D). We again performed a sensitivity analysis to ensure these results were not driven by patients who were always ctDNA negative during the study period by excluding these two patients (Patients 18 and 23) and found that the findings persisted (univariable HR for OS 0.17, 95% CI 0.03–0.86, p = 0.0321; multivariable HR for OS 0.05, 95% CI 0–0.06, p = 0.0175; univariable HR for PFS 0.23, 95% CI 0.06–0.94, p = 0.0411; multivariable HR for PFS 0.05, 95% CI 0–0.61, p = 0.019). Additionally, when limiting our analysis to patients who achieved ctDNA negativity exclusively through ICB, we observed a consistent association with improved outcomes. Three-year overall survival (OS) was 75% compared to 20% in those who did not clear ctDNA (median OS: 28 versus 22 months; p < 0.02, Log-Rank test). Similarly, three-year PFS was 50% versus 0% (median PFS: 9 versus 3 months; p < 0.003, Log-Rank test) (Fig. S2).
Fig. 2: Three-year overall survival and progression-free survival for the entire cohort.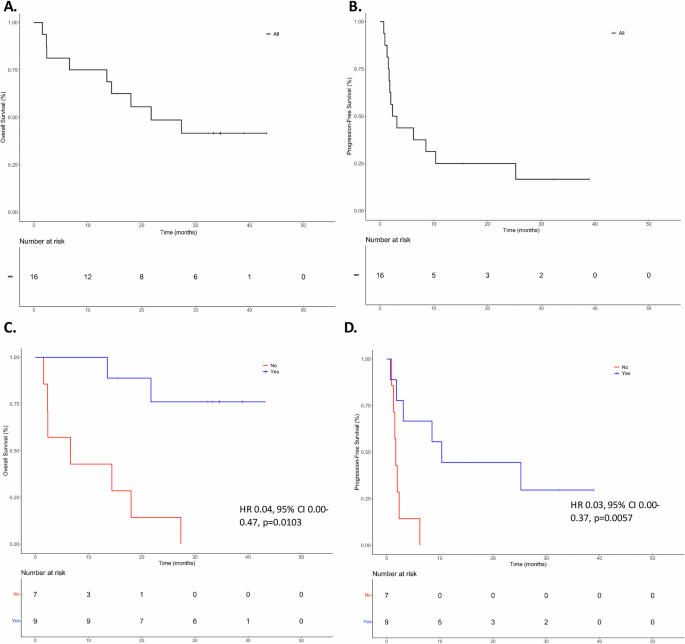
A Overall survival for the entire cohort. B Progression-free survival for the entire cohort. C Overall survival based on ctDNA negativity at any point during the study period based on multivariable analysis. D Progression-free survival based on ctDNA negativity at any point during the study period based on multivariable analysis.
ctDNA yielded comparable prognostic capability obtained with imaging-based prediction of OS. When response was determined by radiographic (RECIST 1.1) or clinical (when imaging was unavailable) assessment, an objective response (CR or PR) was associated with improved OS (HR 0.12, 95% CI 0.01–0.98, p = 0.04) while disease control (CR, PR, or SD) trended toward improved OS (HR 0.28, 95% CI 0.07–1.64, p = 0.08).
Early %eVAF increase is a key marker for disease progression
We evaluated the association between changes in ctDNA levels from P1 to P2 (after a median of 1 dose of ICB) and best ORR using penalized logistic regression to account for the small sample size. We assessed various ctDNA dynamics parameters—(1) absolute change in %eVAF, and thresholds of both (2) >20% and (3) >50% change in ctDNA levels from the pre-treatment to first on-treatment measurement after a median of one cycle (data not shown)—and found a strong association between absolute change in ctDNA (increase in ctDNA from P1 to P2) and disease progression at first treatment response assessment after starting ICB (Fisher’s exact test p = 0.0047; Phi coefficient = 0.85) (Fig. 3A). Among patients with an increase in ctDNA levels from P1 to P2 (Patients 02, 03, 09, 13, 14, 15, 25, 26), 87% (7/8) of patients experienced disease progression at their first treatment response assessment. In contrast, none of the patients with a decrease in ctDNA levels (Patients 06, 08, 10, 19, 20) experienced PD at first treatment response assessment. Of note, three patients (07, 18, and 23) were not included in the analysis because either no pretreatment sample was available for analysis or both P1 and P2 samples were negative.
Fig. 3: Increased ctDNA from P1 to P2 is associated with disease progression.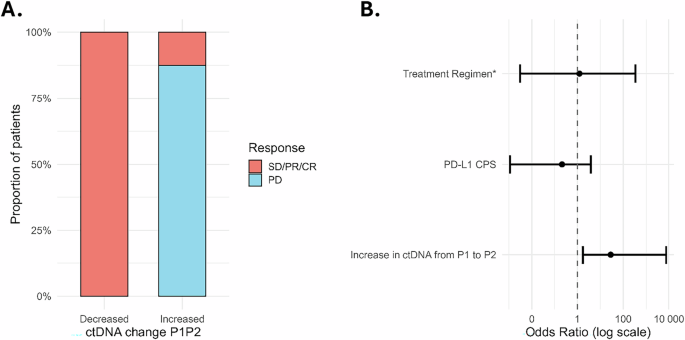
A Distribution of best objective response rate (CR/PR/SD versus PD) stratified by changes in ctDNA levels between P1 and P2. B Forest plot showing that an increase in ctDNA levels from P1 to P2 is independently associated with disease progression, regardless of CPS (0 or <1, 1–19, and ≥20) and treatment regimen (monotherapy versus combination therapy).
To further evaluate the independent association while accounting for potential confounders, we performed multivariable logistic regression using Firth’s penalized likelihood approach. After adjusting for CPS and treatment regimen (ICB vs chemo/ICB), an increase in ctDNA levels from P1 to P2 remained significantly associated with disease progression as best ORR (adjusted OR 28.4; 95% CI 1.74–7613.5; p = 0.016). Neither CPS (adjusted OR 4.65; 95% CI 0.001–3.89; p = 0.37) nor treatment regimen (adjusted OR 1.23; 95% CI 0.003–338.8; p = 0.93) were significantly associated with disease progression (Fig. 3B).