November 8, 2026
Our latest national tracking survey, conducted from October 30 to November 4, 2026, finds the Liberal Party and federal government led by Mark Carney remain in a strong political position, although there are signs of growing dissatisfaction with the government’s handling of some of the economic issues that matter most to Canadians.
This survey was conducted before the federal budget was tabled on November 5.
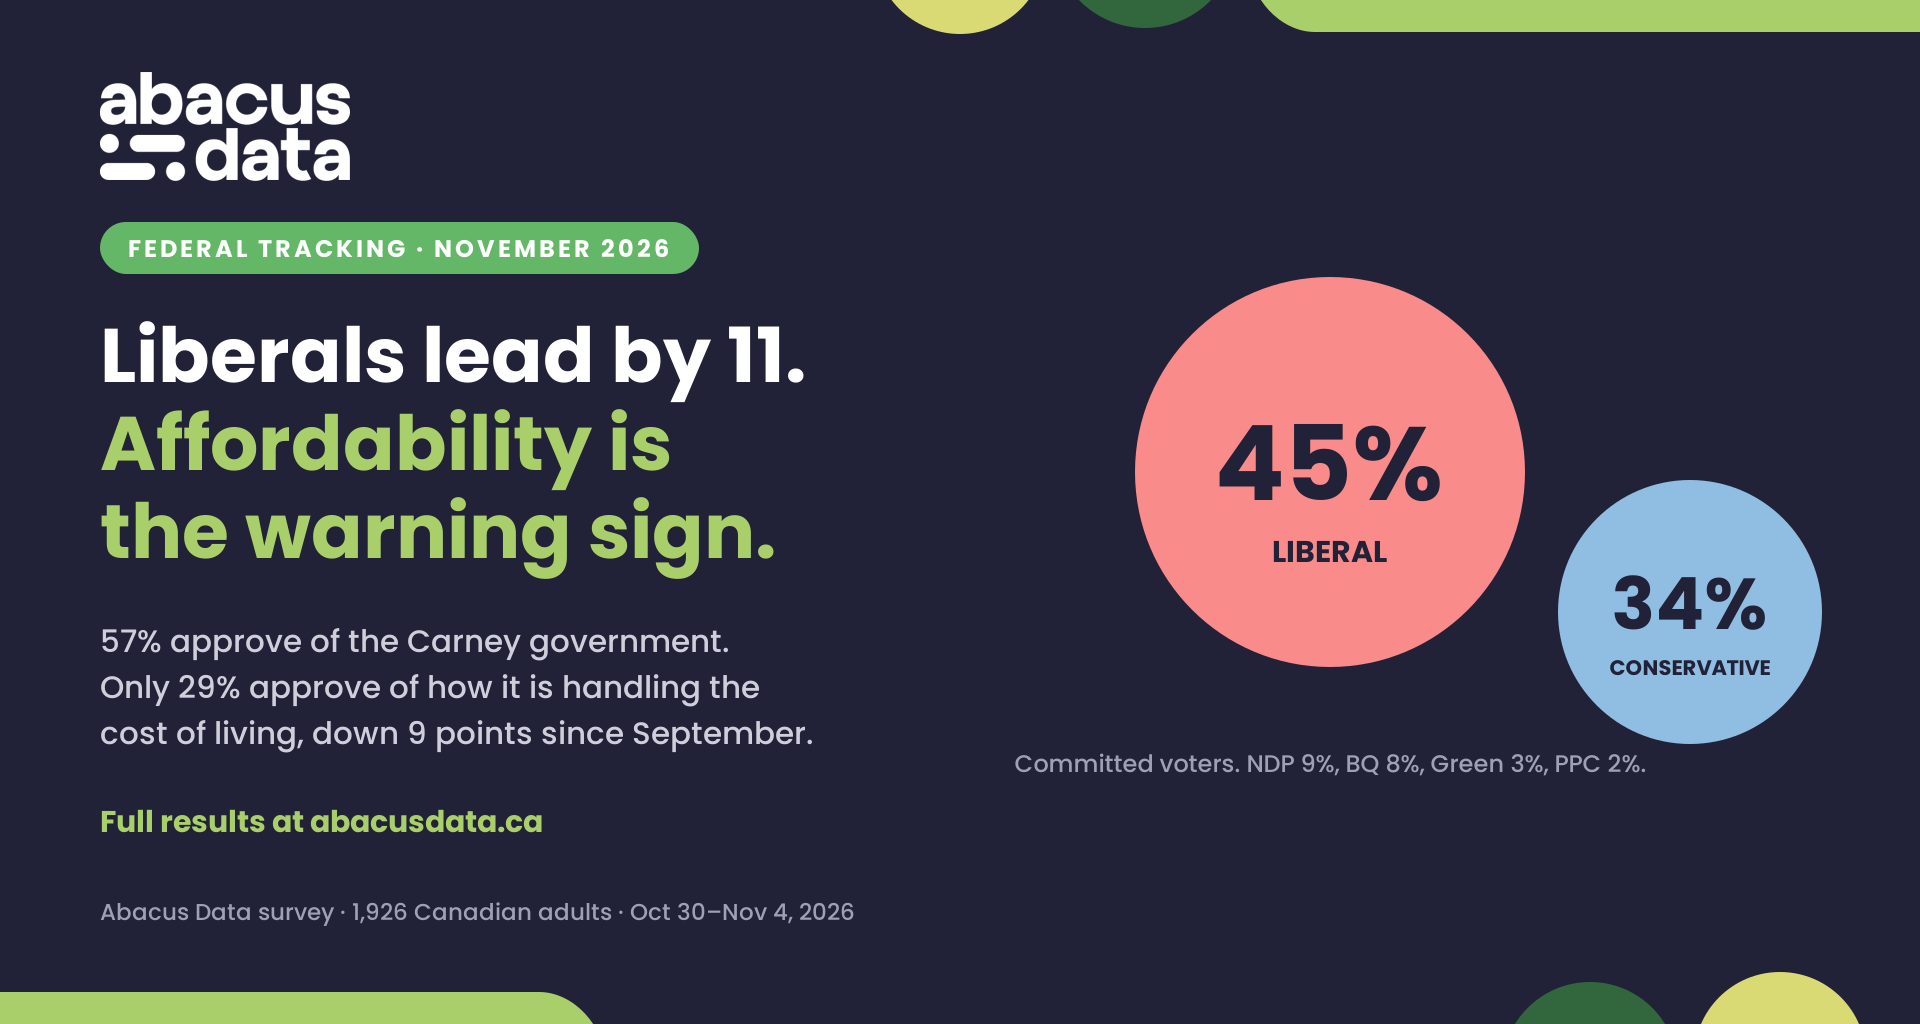
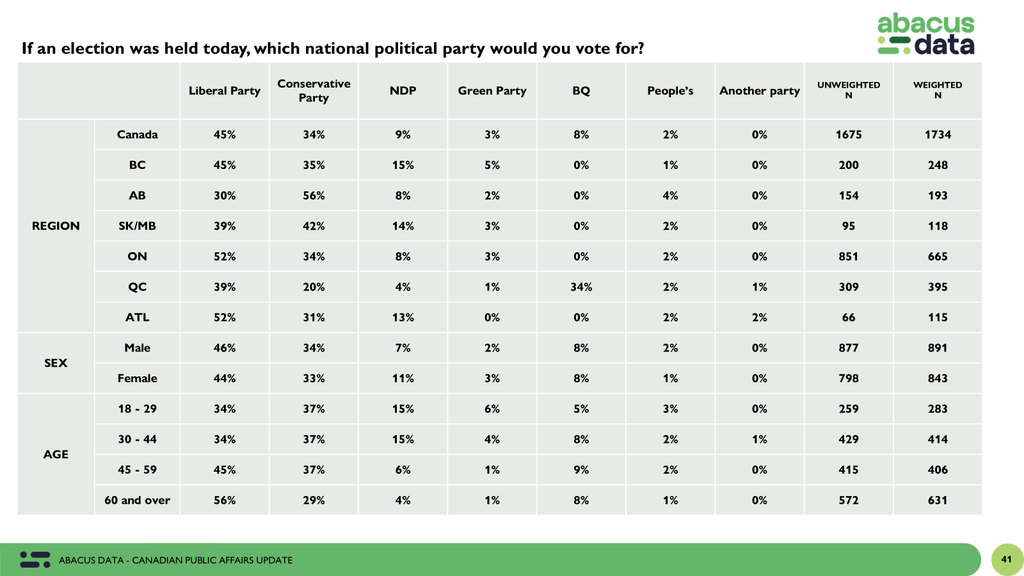
If an election were held today, 45% of committed voters would vote Liberal, compared with 34% Conservative, 9% NDP, 8% Bloc Québécois, 3% Green, and 2% People’s Party.
The Liberal lead is now 11 points, down from 16 points in our October 21 survey.
Despite the narrowing lead, 57% of Canadians approve of the job the federal government is doing, while 27% disapprove.Mark Carney also continues to have a substantially more positive personal impression than Pierre Poilievre.
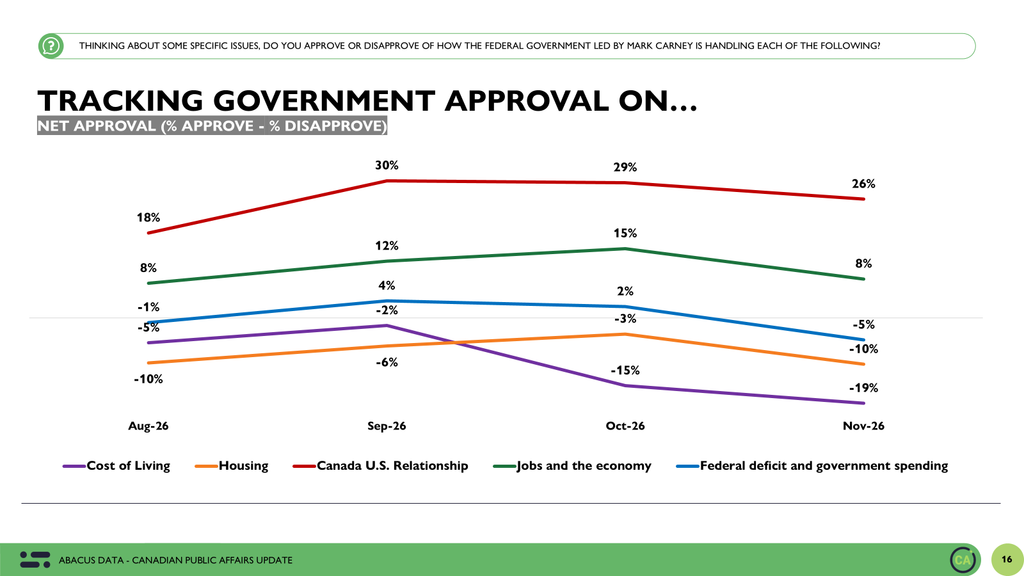
But beneath these relatively strong overall numbers, there is an emerging warning sign for the government. Only 29% of Canadians approve of how the federal government is handling the cost of living and inflation, down from 38% in September and 31% in October.
Meanwhile, 63% continue to identify the rising cost of living as one of the three most important issues facing Canada.
The result is a political environment in which the government retains substantial public support, but its performance ratings on the issue Canadians care about most are moving in the opposite direction.
Liberals Lead Conservatives by 11 Points
The Liberals lead the Conservatives by 11 points nationally, with 45% of committed voters supporting the Liberals compared with 34% for the Conservatives.
Compared with October 21, Liberal support is down three points while Conservative support is up two points.
The NDP remains unchanged at 9%, while the Bloc Québécois has increased two points to 8%.
While the individual movements should be interpreted cautiously, the Liberal lead has narrowed from its recent high.
The Liberals nevertheless retain important regional advantages.
In Ontario, they lead the Conservatives by 18 points, 52% to 34%. They also lead in British Columbia, 45% to 35%, and Atlantic Canada, 52% to 31%.
In Quebec, the Liberals receive 39%, compared with 34% for the Bloc Québécois and 20% for the Conservatives.
The Conservatives lead in Alberta, 56% to 30%, and narrowly in Saskatchewan and Manitoba, 42% to 39%.
Age continues to be an important dividing line.
Among Canadians aged 60 and over, the Liberals lead 56% to 29%. Among those aged 18 to 44, the Conservatives lead 37% to 34%.
The Liberals also retain the largest accessible voter pool, with 59% of Canadians willing to consider voting Liberal compared with 47% who would consider voting Conservative.

Canadian Public Affairs Update · November 2026
Vote Intention: Liberals Lead Conservatives 45% to 34%
n=1,926 Canadian adults · October 30 to November 4, 2026 · MoE ±2.2%
Overall
Trend Line
Subgroups
Likely Voters
Methodology
If an election was held today, which national political party would you vote for? (Undecided removed.)
Overall Federal Vote Intention
Liberals lead Conservatives by 11 points, 45% to 34%. Since October 21, Liberal support is down 3 points and Conservative support is up 2. The NDP is at 9%, the Bloc Québécois at 8%, and the Greens at 3%.
PartyCurrentOct 21, 2026ChangeLiberal45%48%▼ -3Conservative34%32%▲ +2NDP9%9%NCBloc Québécois8%6%▲ +2Green3%3%NCPeople’s Party2%1%▲ +1Other0%1%▼ -1
Changes are percentage-point differences from October 21, 2026. NC means no change. Overall and likely-voter bars use a shared maximum of 46%. Overall shares total 101% due to rounding. Undecided respondents are removed.
If an election was held today, which national political party would you vote for? (Undecided removed.)
Federal Vote Intention Trend
Liberal support is 45% and Conservative support is 34%. The Liberal lead narrows from 16 to 11 points since October 21. NDP support remains 9%, Bloc Québécois support is 8%, and Green support remains 3%.
Liberal 45%Conservative 34%NDP 9%BQ 8%Green 3%
Trend over time0%10%20%30%40%50%Aug 7-24Jan 28-25May 5-25Oct 29-25May 6-26Nov 4-26
The comparison is with October 21, 2026. Figures are percentages of decided voters. Undecided respondents are removed.
If an election was held today, which national political party would you vote for? (Undecided removed.) (By region, gender and age.)
Liberals lead in British Columbia, Ontario, Quebec and Atlantic Canada. Conservatives lead in Alberta at 56% and Saskatchewan and Manitoba at 42%. Liberal support reaches 56% among adults aged 60 and over; the NDP reaches 15% among both those aged 18 to 29 and those aged 30 to 44.
Vote Intention by Region
PartyCanadaBCABSK/MBONQCATLLiberal45%45%30%39%52%39%52%Conservative34%35%56%42%34%20%31%NDP9%15%8%14%8%4%13%Bloc Québécois8%0%0%0%0%34%0%Green3%5%2%3%3%1%0%People’s Party2%1%4%2%2%2%2%Other0%0%0%0%0%1%2%
The top three parties in each column are highlighted in their party colours. Percentages may not sum to 100 due to rounding.
Vote Intention by Gender and Age
PartyCanadaMaleFemale18 to 2930 to 4445 to 5960 and overLiberal45%46%44%34%34%45%56%Conservative34%34%33%37%37%37%29%NDP9%7%11%15%15%6%4%Bloc Québécois8%8%8%5%8%9%8%Green3%2%3%6%4%1%1%People’s Party2%2%1%3%2%2%1%Other0%0%0%0%1%0%0%
The top three parties in each column are highlighted in their party colours. Canada is the national reference. Percentages may not sum to 100 due to rounding. Scroll horizontally to see all columns on narrow screens.
If an election was held today, which national political party would you vote for? (Undecided removed.) (Among those certain to vote.)
Federal Vote Intention Among Those Certain to Vote
Among those certain to vote, Liberals lead 46% to 34%. Liberal and Bloc Québécois support are each 1 point higher than among all decided voters. Green and People’s Party support are each 1 point lower, while Conservative and NDP support are unchanged.
Turnout boost or suppression is the percentage-point difference from overall results, not a forecast. NC means no change. Shares total 101% due to rounding. Undecided respondents are removed; the subgroup sample size was not supplied.
Methodology
This research was conducted via online survey with 1,926 adults (age 18+) living in Canada from October 30 to November 4, 2026.
A random sample of panelists were invited to complete the survey from a set of partner panels. These partners are typically double opt-in survey panels, blended to manage out potential skews in the data from a single source.
The margin of error for a comparable probability-based random sample of the same size is plus or minus 2.2 percentage points, 19 times out of 20.
The data was weighted according to census data to ensure that the sample matched Canada’s population. Totals may not add up to 100 due to rounding.
Abacus Data · Canadian Public Affairs Update · November 4, 2026 · n=1,926 · MoE ±2.2%
abacusdata.ca
Government Approval Remains Strong at 57%
Fifty-seven percent of Canadians approve of the federal government’s performance, down two points from October 21.
Disapproval stands at 27%, up one point, producing a net approval rating of +30.
Canadian Public Affairs Update · November 2026
Government Approval: 57% Approve of the Federal Government
n=1,926 Canadian adults · October 30 to November 4, 2026 · MoE ±2.2%
Overall
Trend Line
Methodology
Overall, do you approve or disapprove of the job the federal government led by Mark Carney is doing?
Overall Government Approval
A majority of Canadians approve of the federal government, at 57%. Approval is down 2 points since October 21, while disapproval is up 1 point to 27%. Fifteen per cent neither approve nor disapprove.
Approve57%
▼ -2 since October 21
Neither15%
Neither approve nor disapprove
Disapprove27%
▲ +1 since October 21
Neither approve nor disapprove
15%
Approve combines strongly and somewhat approve; disapprove combines somewhat and strongly disapprove. Rounded disapproval components of 13% and 15% sum to 28%, compared with 27% total disapproval. Differences are due to rounding. Changes are from October 21, 2026.
Overall approval and disapproval of the federal government over time.
Government Approval Trend
Approval is 57% and disapproval is 27%. Compared with October 21, approval is down 2 points and disapproval is up 1 point.
Approve 57%Disapprove 27%
Trend over time0%10%20%30%40%50%60%70%July 23-24Dec 17-24Jun 19-25Nov 27-25Jun 3-26Nov 4-26
Changes are from October 21, 2026. Percentages may not add up to 100 due to rounding.
Methodology
This research was conducted via online survey with 1,926 adults (age 18+) living in Canada from October 30 to November 4, 2026.
A random sample of panelists were invited to complete the survey from a set of partner panels. These partners are typically double opt-in survey panels, blended to manage out potential skews in the data from a single source.
The margin of error for a comparable probability-based random sample of the same size is plus or minus 2.2 percentage points, 19 times out of 20.
The data was weighted according to census data to ensure that the sample matched Canada’s population. Totals may not add up to 100 due to rounding.
Abacus Data · Canadian Public Affairs Update · November 4, 2026 · n=1,926 · MoE ±2.2%
abacusdata.ca
Carney’s personal impression also remains positive.
Fifty-three percent have a positive impression of the Prime Minister compared with 28% who have a negative impression, producing a net rating of +25. Pierre Poilievre’s net impression is -11, while Avi Lewis is at -8.
Canadian Public Affairs Update · November 2026
Leader Impressions: Carney Records a +25 Net Rating
n=1,926 Canadian adults · October 30 to November 4, 2026 · MoE ±2.2%
Overall Comparison
Trend Line
Subgroups: Carney
Subgroups: Poilievre
Methodology
Do you have a positive or negative impression of the following people?
Overall Leader Comparison
Mark Carney has a net-positive impression of +25. Pierre Poilievre is at -11 and Avi Lewis at -8. Carney is viewed positively by 53%, compared with 35% for Poilievre and 17% for Lewis.
Mark Carney
Liberal leader
Net +25
Positive 53%
Neutral 18%
Negative 28%
Don’t know enough to say 2%
Pierre Poilievre
Conservative leader
Net -11
Positive 35%
Neutral 15%
Negative 46%
Don’t know enough to say 4%
Avi Lewis
NDP leader
Net -8
Positive 17%
Neutral 32%
Negative 25%
Don’t know enough to say 25%
Net impression is positive minus negative, reported in percentage points. Totals may not add up to 100 due to rounding. The stacked bars show each response’s share of the reported total.
Net impression of Mark Carney and Pierre Poilievre over time.
Carney versus Poilievre: Net Impression
Carney has a net impression of +25 and Poilievre is at -11. Since October 21, Carney declines 4 points from +29 while Poilievre declines 3 points from -8.
Mark Carney +25Pierre Poilievre -11
Trend over time-20-100+10+20+30+40Jan 27-25Apr 15-25Aug 20-25Jan 16-26Jun 17-26Nov 4-26
Change comparison is with October 21, 2026. Values are net impressions in percentage points. Observations are equally spaced.
Do you have a positive or negative impression of Mark Carney? (Net impression by subgroup.)
Carney’s net impression reaches +37 in British Columbia and Quebec, compared with -8 in Alberta. His net rating is +41 among adults aged 60 and over. Among 2025 Liberal voters it is +84, compared with -32 among Conservative voters.
Mark Carney Net Impression by Subgroup
Canada
Canada+25
Region
BC+37
AB-8
SK/MB+11
ON+29
QC+37
ATL+13
Gender
Male+30
Female+21
Age
18 to 29+19
30 to 44+11
45 to 59+20
60 and over+41
Household income
Under $35K+19
$35K to $50K+22
$50K to $75K+24
$75K to $100K+28
$100K ++32
Community
Urban+27
Suburban+28
Rural+14
2025 Vote
Liberal+84
Conservative-32
NDP+9
BQ+20
Values are reported net impressions in percentage points. The shared signed scale is -100 to +100, with zero at the centre. Green denotes positive, red negative and muted green zero. The national reference is shown once; 2025 vote is past federal vote choice, not current intention.
Do you have a positive or negative impression of Pierre Poilievre? (Net impression by subgroup.)
Poilievre’s net impression is +18 in Alberta, compared with -33 in Quebec. His net rating is +3 among both adults aged 18 to 29 and those aged 30 to 44, compared with -31 among those aged 60 and over. Among 2025 Conservative voters it is +66.
Pierre Poilievre Net Impression by Subgroup
Canada
Canada-11
Region
BC-10
AB+18
SK/MB0
ON-10
QC-33
ATL-13
Gender
Male-14
Female-10
Age
18 to 29+3
30 to 44+3
45 to 59-8
60 and over-31
Household income
Under $35K-13
$35K to $50K-22
$50K to $75K-12
$75K to $100K-14
$100K +-7
Community
Urban-10
Suburban-18
Rural0
2025 Vote
Liberal-62
Conservative+66
NDP-55
BQ-47
Values are reported net impressions in percentage points. The shared signed scale is -100 to +100, with zero at the centre. Green denotes positive, red negative and muted green zero. The national reference is shown once; 2025 vote is past federal vote choice, not current intention.
Methodology
This research was conducted via online survey with 1,926 adults (age 18+) living in Canada from October 30 to November 4, 2026.
A random sample of panelists were invited to complete the survey from a set of partner panels. These partners are typically double opt-in survey panels, blended to manage out potential skews in the data from a single source.
The margin of error for a comparable probability-based random sample of the same size is plus or minus 2.2 percentage points, 19 times out of 20.
The data was weighted according to census data to ensure that the sample matched Canada’s population. Totals may not add up to 100 due to rounding.
Abacus Data · Canadian Public Affairs Update · November 4, 2026 · n=1,926 · MoE ±2.2%
abacusdata.ca
There is also continued evidence that Canadians’ appetite for political change is very different from two years ago.
Forty-three percent now say they would re-elect the Liberals, compared with 35% who believe it is time for change and that a good alternative is available.
Two years ago, only 14% said they would re-elect the Liberals.
Together, these measures suggest that while Liberal support has softened somewhat, the government’s broader political position remains considerably stronger than it was before Carney became Prime Minister.
Declining Approval on Cost of Living Is a Warning Sign
The most notable finding in this survey may be the growing gap between overall government approval and assessments of its handling of affordability.
Only 29% approve of how the government is handling the cost of living and inflation, while 47% disapprove.
Approval has fallen nine points since September, making it the government’s weakest-rated policy area.
Approval of its handling of housing affordability and supply is 31%, while 41% approve of its approach to jobs and economic growth.
By comparison, 54% approve of how the government is managing Canada’s relationship with the United States, and the same proportion approve of its handling of national defence and security.
These differences are particularly important given the public’s priorities.
Sixty-three percent identify the rising cost of living as a top-three issue, compared with 38% who identify the economy and 38% who select Donald Trump and his administration.
Among those concerned about the cost of living, 35% think the Conservatives would do the best job handling it, compared with 30% who select the Liberals.
For now, dissatisfaction with the government’s handling of affordability has not translated into a loss of its overall approval advantage.
Canadian Public Affairs Update · November 2026
Top Issues: Cost of Living Leads at 63%
n=1,926 Canadian adults · October 30 to November 4, 2026 · MoE ±2.2%
Overall Top Issues
Regional Breakout
Best Party Able to Handle Issue
Methodology
What are the 3 most important issues facing Canada today? Please select 3 issues
Overall Top Issues
The rising cost of living leads at 63%. The economy and Donald Trump and his administration tie for second at 38%, followed by housing affordability and accessibility at 32% and healthcare at 31%.
The rising cost of living
63%
Donald Trump and his administration
38%
Housing affordability and accessibility
32%
Crime and public safety
14%
Job security and unemployment
14%
Climate change and the environment
12%
The rise of artificial intelligence
11%
Inequality and poverty
11%
The threat posed by China and Russia
5%
Indigenous reconciliation
3%
Respondents selected three issues, so totals exceed 100%.
What are the 3 most important issues facing Canada today? Please select 3 issues (By region)
The rising cost of living is the leading issue in every region. It reaches 72% in both Alberta and Atlantic Canada. Healthcare is selected by 45% in Atlantic Canada, while concern about Donald Trump and his administration reaches 51% in Quebec.
Top Issues by Region
IssueBCABSK/MBONQCATLThe rising cost of living66%72%60%63%56%72%The economy40%44%36%37%42%23%Donald Trump and his administration33%27%45%36%51%33%Housing affordability and accessibility33%27%25%34%33%34%Healthcare38%25%35%28%31%45%Immigration18%31%29%24%23%28%Crime and public safety16%11%21%19%6%7%Job security and unemployment11%19%8%18%9%14%Climate change and the environment15%9%7%13%14%8%The rise of artificial intelligence10%13%13%11%11%15%Inequality and poverty11%10%8%9%18%10%The threat posed by China and Russia4%5%9%6%6%4%Indigenous reconciliation5%6%5%3%0%7%
Exactly three issues per column are highlighted. Regional percentages are column percentages. Respondents selected three issues, so column totals exceed 100%. Scroll horizontally to view all six regions.
Which party do you think would do best on… (Among those who rated the issue in their Top 3)
Conservatives lead on 7 issues, Liberals on 4, NDP on 1, and Greens on 1. Liberals lead on the economy at 41% to 40% for Conservatives. Greens lead on climate at 40%, and NDP leads on inequality and poverty at 28% to 27% for Liberals.
Best Party Able to Handle Each Issue
The rising cost of livingConservative 35%Housing affordability and accessibilityConservative 31%Crime and public safetyConservative 58%Climate change and the environmentGreen 40%The threat posed by China and RussiaConservative 41%Inequality and povertyNDP 28%Indigenous reconciliationConservative 31%ImmigrationConservative 60%The rise of artificial intelligenceLiberal 40%Donald Trump and his administrationLiberal 66%Job security and unemploymentConservative 38%IssueLiberalConservativeNDPUnsureLeading partyHealthcare33%27%15%20%Liberal +6The rising cost of living30%35%10%20%Conservative +5Housing affordability and accessibility29%31%16%20%Conservative +2Crime and public safety20%58%5%13%Conservative +38The economy41%40%6%11%Liberal +1Climate change and the environment29%10%10%11%Green +11The threat posed by China and Russia33%41%6%19%Conservative +8Inequality and poverty27%14%28%20%NDP +1Indigenous reconciliation20%31%24%20%Conservative +7Immigration14%60%4%12%Conservative +46The rise of artificial intelligence40%16%11%26%Liberal +24Donald Trump and his administration66%16%3%12%Liberal +50Job security and unemployment35%38%8%14%Conservative +3
The chart shows the leading party’s share. The table compares Liberal, Conservative and NDP shares, plus Unsure. Green leads on climate at 40%, versus Liberal 29%, NDP 10% and Conservative 10%. Margins compare the two highest party shares, not Unsure. Omitted shares and rounding mean displayed rows do not sum to 100%.
Methodology
This research was conducted via online survey with 1,926 adults (age 18+) living in Canada from October 30 to November 4, 2026.
A random sample of panelists were invited to complete the survey from a set of partner panels. These partners are typically double opt-in survey panels, blended to manage out potential skews in the data from a single source.
The margin of error for a comparable probability-based random sample of the same size is plus or minus 2.2 percentage points, 19 times out of 20.
The data was weighted according to census data to ensure that the sample matched Canada’s population. Totals may not add up to 100 due to rounding.
Abacus Data · Canadian Public Affairs Update · November 4, 2026 · n=1,926 · MoE ±2.2%
abacusdata.ca
But the continued decline in its performance rating on this issue suggests a potential vulnerability if economic concerns become more central to how Canadians evaluate the government.
If Approval on Affordability is Declining, why Isn’t the Government’s Approval Rating?
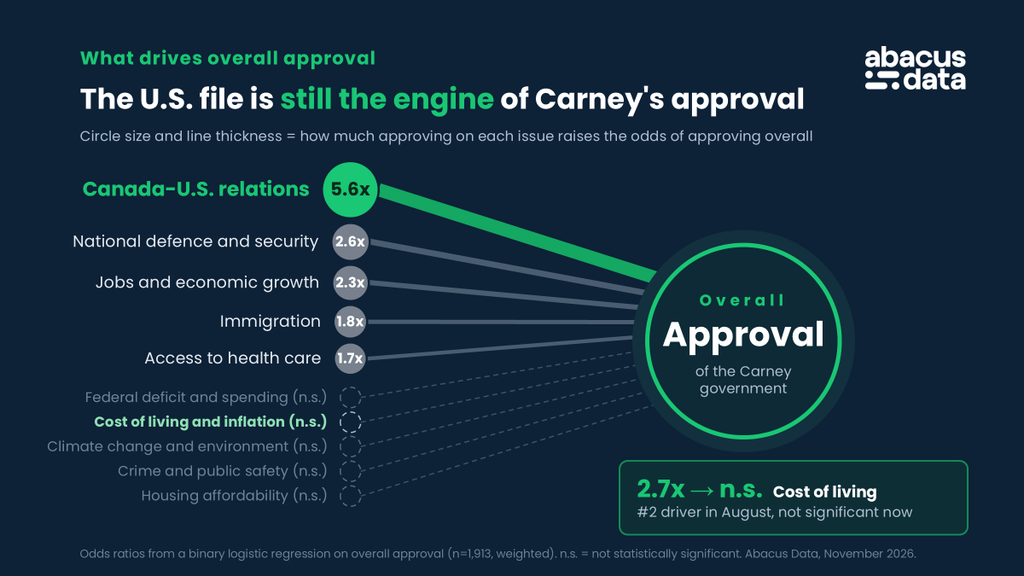
To better understand what is shaping Canadians’ assessments of the federal government, we used a regression model to examine the relationship between approval of the government’s performance on ten specific issues and its overall approval rating.
The results suggest that Canadians are evaluating the Carney government primarily through its handling of Canada’s relationship with the United States, national security, and the economy, rather than its performance on affordability.
Approval of the government’s handling of Canada-U.S. relations is by far the strongest predictor of overall approval, increasing the odds of approving of the government by 5.6 times, even after accounting for assessments of the other issues. National defence and security (2.6 times) and jobs and economic growth (2.3 times) are the next strongest predictors. Perhaps most notably, approval of the government’s handling of the cost of living and housing affordability is not independently associated with overall approval once the other issues are considered.
This does not mean Canadians are unconcerned about affordability.
In fact, the opposite is true. Rather, it suggests that dissatisfaction with affordability has not yet become a defining factor in how Canadians assess the government overall. With approval of its handling of the cost of living declining to just 29%, this represents both an important source of resilience for the government today and a potential warning sign if Canadians increasingly judge its performance through the lens of their household finances.
The Upshot
According to Abacus Data CEO David Coletto:
“The central story of this survey is that the Carney government remains in a strong political position, but there are some signs that Canadians’ patience on affordability may be weakening.
The Liberals lead by 11 points. Government approval is 57%. And Carney continues to have a substantially more positive personal impression than Pierre Poilievre.
Those are strong numbers.
But what stands out to me is the growing disconnect between how Canadians feel about the government overall and how they assess its handling of the cost of living.
Almost six in ten approve of the government, but fewer than three in ten approve of its handling of inflation and the cost of living. And that approval rating has fallen nine points in just two months.
That’s important because affordability isn’t a secondary concern. It’s the issue Canadians identify as their most important challenge by a considerable margin.
For now, the government continues to benefit from positive assessments of its overall leadership and its handling of Canada’s relationship with the United States.
But the political risk is that dissatisfaction with affordability eventually starts to influence those broader judgments.
The government has considerable political support today. The question is how durable that support will be if Canadians don’t start feeling more positive about its handling of their most pressing economic concern.”
Canadian Public Affairs Update · November 2026
Mood of the Country: 44% Say Canada Is Headed in the Right Direction
n=1,926 Canadian adults · October 30 to November 4, 2026 · MoE ±2.2%
Comparison
Regional Breakout
Trend Lines
Methodology
Generally speaking, do you think things are headed in the right direction of are they off on the wrong track?
Direction of Canada, the World, and the USA
44% say Canada is headed in the right direction, compared with 41% who say wrong track. Right-direction sentiment is 13% for the world and 12% for the USA. Canada’s right-direction result is down 3 points from October 21.
Right direction and wrong track are shown separately on a 100% scale. Change is from October 21, 2026. Other responses are not shown; totals may not add up to 100 due to rounding.
Generally speaking, do you think things are headed in the right direction of are they off on the wrong track? (Canada right direction by region.)
British Columbia has the highest right-direction result at 51%, while Alberta has the lowest at 35%. Ontario is at 48%, Saskatchewan and Manitoba at 46%, Atlantic Canada at 43%, and Quebec at 37%.
Canada Right Direction by Region
Canada is shown as a national reference. Regional values report the percentage saying Canada is headed in the right direction.
Right-direction sentiment for Canada and the world over time.
Canada and World Right-Direction Trends
Canada’s right-direction result is 44%, down 3 points from 47% on October 21. The world remains at 13%. The Canada versus world optimism gap is 31 percentage points.
Canada right direction 44%World right direction 13%
Canada and world right-direction trends10%20%30%40%50%November 4, 2026: Canada right direction 44%November 4, 2026: World right direction 13%October 21, 2026: Canada right direction 47%October 21, 2026: World right direction 13%Feb-20Apr 9-22Feb 22-24Apr 15-25Sept 23-26Oct 21-26Nov 4-26
Change is from October 21, 2026. The optimism gap is Canada right direction minus world right direction.
Methodology
This research was conducted via online survey with 1,926 adults (age 18+) living in Canada from October 30 to November 4, 2026.
A random sample of panelists were invited to complete the survey from a set of partner panels. These partners are typically double opt-in survey panels, blended to manage out potential skews in the data from a single source.
The margin of error for a comparable probability-based random sample of the same size is plus or minus 2.2 percentage points, 19 times out of 20.
The data was weighted according to census data to ensure that the sample matched Canada’s population. Totals may not add up to 100 due to rounding.
Abacus Data · Canadian Public Affairs Update · November 4, 2026 · n=1,926 · MoE ±2.2%
abacusdata.ca
Methodology
The survey was conducted with 1,926 Canadian adults from October 30 to November 4, 2026.
A random sample of panelists was invited to complete the survey through a set of partner panels like Cint and PureSpectrum. These partners are typically double opt-in survey panels, blended to help manage potential skews that can arise from relying on a single source.
The data were weighted according to census data to match Canada’s population.
The margin of error for a comparable probability-based random sample is plus or minus 2.2 percentage points, 19 times out of 20.
Totals may not add to 100 because of rounding.
The survey was paid for by Abacus Data.
About Abacus Data
We are Canada’s most sought-after, influential, and impactful polling and market research firm. We are hired by many of North America’s most respected and influential brands and organizations.
We use the latest technology, sound science, and deep experience to generate top-flight research-based advice to our clients. We offer global research capacity with a strong focus on customer service, attention to detail, and exceptional value.
And we are growing throughout all parts of Canada and the United States and have capacity for new clients who want high quality research insights with enlightened hospitality.
With offices in Halifax, Ottawa, Toronto, and now in Winnipeg following our acquisition of Probe Research, we can serve clients across the country.
Our record speaks for itself: we were one of the most accurate pollsters conducting research during the 2025 Canadian election following up on our outstanding record in the 2021, 2019, 2015, and 2011 federal elections.
Contact us with any questions.
Find out more about how we can help your organization by downloading our corporate profile and service offering.