
Here, we elucidate the outcomes of our comprehensive investigations into malignant melanoma CSCs, which encompassed a multifaceted exploration of molecular, structural, and elemental analyses. These findings shed light on the intricate interplay between gene expression, cellular morphology, and elemental distribution within the context of CSC biology.
Profilin gene response to KLF4, SHH, and HIF1α Silencing
The expression levels of PFN1 and PFN2 genes were evaluated according to fold change results (2^(-ΔΔCt)) (SI Fig. 1). The genes exhibited comparable patterns between the CD133 + and CD133- cell groups (p > 0.05). However, in the siRNA-treated groups, the PFN2 gene showed similar expression levels to the CD133 + cell group (p > 0.05), while there was a reduction in the expression levels of the PFN2 gene in CD133+/HIF1α- (p = 0.04).
Dynamic changes in F-actin intensity KLF4, SHH, and HIF1α silencing
For the cytoskeletal examination, F-actin staining was assessed. The CD133 + cell group is statistically distinct from the CD133- cell group (p < 0.001), and the CD133 + cell group exhibits higher F-actin intensity (Fig. 1A-B). The CD133+/KLF4- cell group is statistically different from both the CD133 + and CD133- cell groups (p < 0.05 and p < 0.001). Furthermore, the CD133+/KLF4- cell group demonstrates lower expression levels compared to the CD133 + cell group but higher expression levels compared to the CD133- cell group. The CD133+/SHH- and CD133+/HIF1α cell groups exhibit lower expression levels compared to the CD133 + cell group (p < 0.001 and p < 0.05). No significant difference was observed between the CD133- and CD133+/HIF1α cell groups. Following KLF4, SHH, and HIF1α siRNA treatments, a reduction in F-actin levels was spotted.
Fig. 1
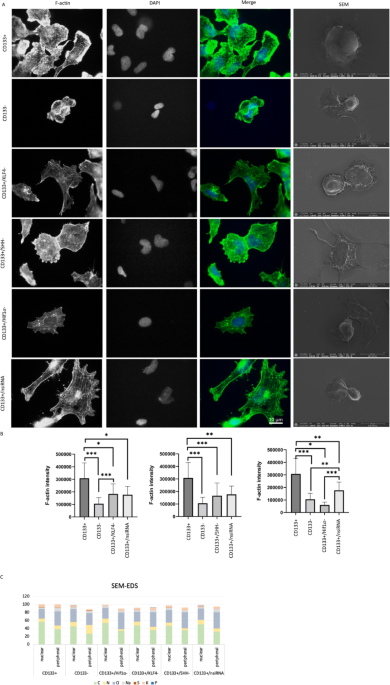
Actin cytoskeletal organization, morphological changes, and elemental composition analysis of cell groups. F-actin levels of cell groups according to CD133 + and CD133- cell groups after siRNA application. Scale bar: 10 μm. Images of the cell groups 100 × (A). The green color represents F-actin and blue for DAPI in merge images. The statistical comparison was shown in (B) for CD133+/KLF4-, CD133+/SHH-, and CD133+/ HIF1α-. *p < 0.05, **p < 0.01, ***p < 0.001. The rightmost column displays scanning electron microscopy (SEM) images showing morphological differences between the groups. Scale bar: 20 μm. SEM-EDS analysis showing elemental composition ratio in central and peripheral regions of CD133 + and CD133 − cells, as well as CD133 + cells subjected to KLF4, SHH, and Hif1α silencing (C).
Scanning electron microscopy coupled with EDS for characterization of gene silencing
While using SEM images for comparing cell morphologies (Fig. 1), signals from cells were compared based on elemental percentages in the peripheral and central data points.
In addition to comparing cell groups, SEM-EDS analysis was conducted separately for the Matrigel due to the culturing of cells on its surface. The Matrigel composition revealed the presence of carbon, nitrogen, oxygen, sodium, sulfur, and potassium. In the cell-based analysis, carbon content was found to be the highest, while in the Matrigel, the highest percentages were attributed to oxygen and sodium elements (SI Table 1).
The cell groups were evaluated both centrally and near the cell periphery (Table 1).
Elemental analysis revealed the presence of carbon, nitrogen, oxygen, sodium, sulfur, and potassium in the CD133 + cell group, with carbon being the most abundant element. Notably, carbon content decreased towards the peripheral region (Fig. 1, SI Table 2). The CD133- cell group exhibited a similar elemental composition, with the addition of phosphorus (Fig. 1, SI Table 3). While carbon remained the dominant element, its percentage was lower in the central region compared to CD133 + cells. Additionally, phosphorus was detected in the central region of CD133- group, distinguishing it from the CD133 + group.
The CD133+/nsiRNA, CD133+/KLF4-, CD133+/SHH-, and CD133+/HIF1α- cell groups all contained carbon, nitrogen, oxygen, sodium, phosphorus, sulfur, and potassium, except for CD133+/HIF1α- and CD133+/SHH-, where phosphorus was absent (Fig. 1, SI Tables 4, 5, 6 and 7). Across all groups, carbon exhibited the highest elemental percentage, with a consistent trend of decreasing content towards the periphery.
Table 1 Summary of SEM-EDS results comparing elemental composition and morphological characteristics across different cell groups.Morphometric evaluation of cell shape alterations response to KLF4, SHH, and HIF1α silencing
Morphological assessments of the cytoskeleton obtained through F-actin staining were further extended. F-actin represents one of the cytoskeletal elements, and evaluations of cellular attributes such as area, perimeter, and more were conducted in the study. Consequently, various parameters including aspect ratio, feret, area, perimeter, roundness, and circularity values of the cell groups were compared (Fig. 2).
Fig. 2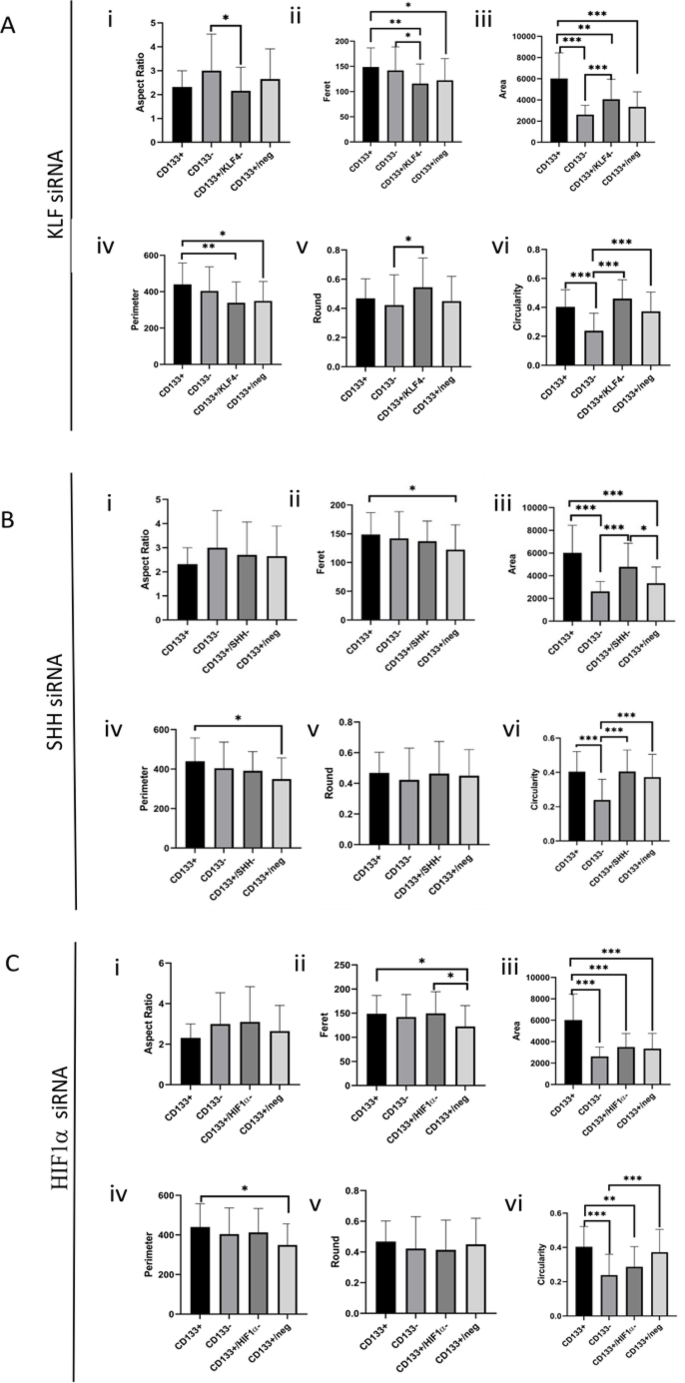
Quantitative morphometric analysis of melanoma CD133 + cells and corresponding gene-silenced derivatives. Morphological parameters were quantified for CD133+, CD133-, CD133+/neg, and CD133 + cells transfected with siRNAs targeting KLF4 (A), SHH (B), or HIF1α (C). Measurements included: (i) aspect ratio, (ii) Feret’s diameter, (iii) cell area, (iv) perimeter, (v) roundness, and (vi) circularity. Data are presented as mean ± standard deviation (SD), and statistical significance was set at p < 0.05, p < 0.01, *p < 0.001.
Aspect ratio of CD133 + and CD133- cell groups were similar. However, the CD133+/KLF4- cell group was statistically different from the CD133- cell group and exhibited a lower aspect ratio (p < 0.05). In contrast, no significant difference was observed in the comparison between CD133+/SHH- and CD133+/HIF1α cell groups when compared to both CD133 + and CD133- cell groups. The highest mean values were observed in the CD133+/HIF1α- group. Following KLF4, SHH, and HIF1α siRNA treatments, the major/minor axis data displayed similar trends.
Feret values did not differ significantly between the CD133 + and CD133- cell groups. However, the CD133+/KLF4- cell group was statistically different from both the CD133 + and CD133- cell groups and exhibited lower Feret values (p < 0.01 and p < 0.05). On the other hand, the CD133+/SHH- and CD133+/HIF1α- cell groups showed similar values to both the CD133 + and CD133- cell groups.
The area of CD133 + cell group is statistically distinct from the other groups (p < 0.001). The highest mean area value was observed in the CD133 + cell group. In contrast, the CD133+/KLF4- cell group has a smaller area compared to the CD133 + group but a larger area compared to the CD133- group (p < 0.01 and p < 0.001). The CD133+/SHH- cell group has a larger area than the CD133- cell group (p < 0.001). In the CD133+/HIF1α- cell group, a decrease in area values was observed.
The highest perimeter mean value among the groups is the CD133 + cell group. However, there is a statistical difference between the CD133 + and CD133+/nsiRNA cell groups (p < 0.05). Additionally, the CD133+/KLF4- cell group has a higher perimeter value compared to the CD133 + cell group (p < 0.01).
There was no statistically significant difference between the CD133 + and CD133- cell groups in round values. However, the CD133+/KLF4- cell group was found to be higher compared to the CD133- cell group (p < 0.05).
There is a statistical difference between the CD133 + and CD133- cell groups, with the CD133 + cell group exhibiting higher values in circularity (p < 0.001). The CD133+/KLF4- and CD133+/SHH- cell groups are also different from the CD133- cell group, with the CD133+/KLF4- cell group having higher values. The CD133+/HIF1α- cell group is statistically distinct from the CD133 + cell group, and after HIF1α siRNA treatment, cellular circularity data decreased, suggesting a reduction in cell protrusions in this group.
Biochemical alterations identified by ATR-FTIR after gene silencing
The FTIR spectrum of cells exhibits signals originating from cellular components such as lipids, proteins, carbohydrates, nucleic acids etc., providing abundant information about the composition, structure, and dynamics of cellular macromolecules28,29. Figures 3, 4 and 5 display the spectral alterations in cell groups upon siRNA-mediated silencing of KLF4, SHH and HIF1α gene expressions, respectively. Assignments of the major IR bands for were listed in Table 2 for clarity.
The mean (average) FTIR absorbance spectra of each cellular group (Figs. 3A, 4A and 5A) represents characteristics IR signals arise mainly from functional groups of cellular macromolecules (lipids, proteins, nucleic acids, carbohydrates etc.). Accordingly, the spectral range of 3000 –2800 cm− 1 is contributed from the asymmetric and symmetric stretching vibrations of the CH3 and CH2 groups mainly in lipids. Besides, the bending vibrations of the CH groups give rise to weak signals (1500 –1350 cm− 1) and may overlap with the amino acid side chains. Absorption signals of proteins are observed in the amide I (1700 –1600 cm− 1), amide II (1600 –1500 cm− 1) and amide III (∼1350 –1250 cm− 1) bands. The strong amide I band is often used to obtain detailed information about protein secondary structures (α-helix, β-sheet, turn, random coils), conformation as well as total protein amount. The spectral range of 1240 –1190 cm− 1 is contributed by the IR peaks of phosphate groups, such as involved in phospholipids and nucleic acids (peaks at 1240 –1190 cm− 1 and around 1087 cm− 1 due to the antisymmetric and symmetric stretching vibrations of phosphate groups, respectively). The spectral range of 1160 –900 cm− 1 is mainly dominated by the IR peaks of carbohydrate derivatives due to the COH coupling, C-O and C-C vibrations (for band assignments see refs29,30,31,32,33,34,35.
Fig. 3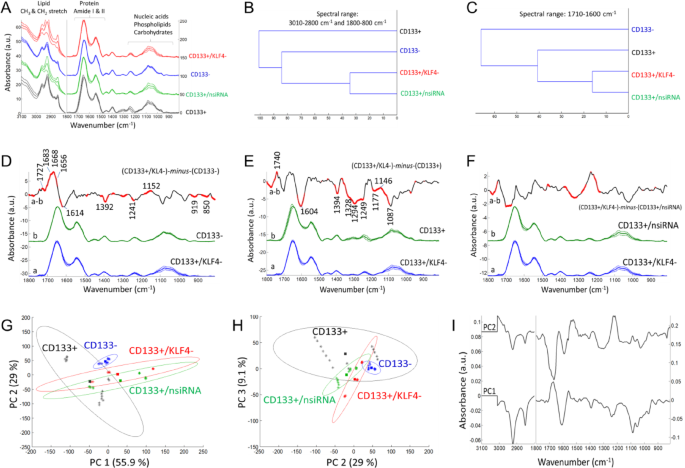
The ATR-FTIR data after the silencing of KLF4 gene. (A) Mean absorbance spectrum of each cell group (black color: CD133 + cells; blue color: CD133- cells; green color: the CD133 + group treated with negative siRNA; red color: the CD133 + group treated with KLF4 siRNA). (B, C) Hierarchical classification of cell groups, performed based on the Euclidean distances between the spectra. The FT-IR difference spectrum of (D) ΔA=(CD133+/KLF4-)-minus-(CD133-), (E) ΔA=(CD133+/KLF4-)-minus-(CD133+) and (F) ΔA=(CD133+/KLF4-)-minus-(CD133+/nsiRNA) and Student’s t-test computed at every wavenumber with a significance level of α = 0.1%. Red thicker lines indicate statistically significant differences between the mean spectra. (G, H) Principal component analysis (mean-centered) for PC1, PC2 and PC3 plots with the percentage of total variance in each PC. (I) The PC1 and PC2 loading spectra.
Table 2 Major FTIR band positions from Figs. 3, 4 and 5 and band assignments based on the refs29,31,32,33,34,35.
The FTIR mean spectra (Figs. 3A, 4A and 5A) were used for hierarchical clustering analysis (HCA). In HCA, the groups are compared in Figs. 3B and 4B, and 5B, where the similarities between cell characteristics (proteins, lipids, carbohydrates, nucleic acids etc.) are indicated in the whole spectrum. According to the HCA results, the group treated with negative siRNA and the groups treated with target siRNA were found to be similar, while the group treated with KLF4 siRNA was more similar to the CD133- cell group (Fig. 3B). After the silencing of the SHH genes (Fig. 4B) and HIF1α genes (Fig. 5B), the CD133 + and CD133- cell groups were found to be similar and distinct from the gene silencing groups. In the comparison of cell groups, particular emphasis was also placed on the protein-based comparisons. The spectral range of 1700 –1600 cm− 1 (amide I) was also examined for protein-specific analysis in HCA. Accordingly, the group treated with negative siRNA and the groups treated with target siRNA were found to be similar, while the CD133 + cell group was more similar to the siRNA-treated groups (Figs. 3C and 4C, and 5C).
Fig. 4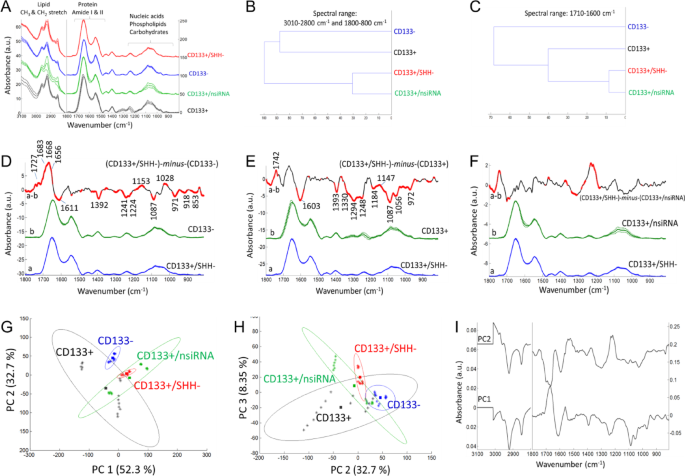
The ATR-FTIR data after the silencing of SHH gene. (A) Mean absorbance spectrum of each cell group (black color: CD133 + cells; blue color: CD133- cells; green color: the CD133 + group treated with negative siRNA; red color: the CD133 + group treated with SHH siRNA). (B, C) Hierarchical classification of cell groups, performed based on the Euclidean distances between the spectra. The FT-IR difference spectrum of (D) ΔA=(CD133+/SHH-)-minus-(CD133-), (E) ΔA=(CD133+/SHH-)-minus-(CD133+) and (F) ΔA=(CD133+/SHH-)-minus-(CD133+/nsiRNA) and Student’s t-test computed at every wavenumber with a significance level of α = 0.1%. Red thicker lines indicate statistically significant differences between the mean spectra. (G, H) Principal component analysis (mean-centered) for PC1, PC2 and PC3 plots with the percentage of total variance in each PC. (I) The PC1 and PC2 loading spectra.
In order to determine the small absorbance changes in the IR spectrum, the differences between groups are illustrated in the FTIR difference spectra with Student’s t-test obtained from the subtraction of means (KLF4, Fig. 3D, E, F; SHH, Fig. 4D, E, F; HIF1α, Fig. 5D, E, F). To obtain the FTIR difference spectrum ΔA=(condition1)-minus-(condiiton2), the mean absorbance spectrum of CD133- cells, CD133 + cells and the group treated with negative siRNA (denoted as CD133+/nsiRNA) was separately subtracted from the mean absorbance spectrum of siRNA treated CD133 + cells. For instance, the mean absorbance spectrum of CD133- cells was subtracted from the mean absorbance spectrum of CD133 + group treated with KLF4 siRNA (denoted as CD133+/KLF4-), and the resultant difference spectrum is so-called (CD133+/KLF4-)-minus-(CD133-) (Fig. 3D); in that difference spectrum, the positive IR peaks correspond to the increased part of the cellular components of the group treated with KLF4 siRNA while negative peaks reflect its reduced cellular components. Accordingly, when compared to the CD133- cells, the KLF4 silencing CD133 + group (Fig. 3D) exhibits the high protein content (positive IR signals absorbed at 1683, 1668 and 1656 cm− 1 consistent with protein-related amide I vibrations) and lipid esters (positive peak at 1727 cm− 1 due to C = O vibrations) while it has less amount of negatively charged amino acids (broad negative peaks at 1614 and 1392 cm− 1 due to carboxyl group COO− vibrations). Similarly, the SHH silencing (Fig. 4D) and HIF1α silencing (Fig. 5D) CD133 + groups also exhibit the high protein content and lipid esters but they have the low amount of negatively charged COO− groups and nucleic acids (negative peaks at 1241, 1224, 1087 and 971 cm− 1 due to the vibrations of phosphate groups). The content of the carbohydrate groups (~ 1153, 1053, 1028 cm− 1) are also altered in both SHH silencing (Fig. 4D) and HIF1α silencing (Fig. 5D) CD133 + groups. Interestingly, when compared to the CD133 + cells, each spectral profile of target genes silencing CD133 + cells (Figs. 3E, 4E and 5E) displays the broad negative amide III band (1350 –1250 cm− 1) due to coupling of C-N stretching and NH bending vibrations in proteins in the form of fibre/filament30,36. This most likely suggests the low amount of some filamentous protein structures, such as F-actin protein (representing the cell cytoskeleton) upon silencing of the target genes in CD133 + cells. This data is harmonious with the F-actin staining results in Fig. 2. Target genes silencing CD133 + groups also have the high content of lipid esters (positive peak around 1742 cm− 1), the low amount of negatively charged COO− groups (broad negative peaks around 1603 and 1394 cm− 1), and low nucleic acids content (negative peaks at 1248, 1087 and 972 cm− 1). Furthermore, the amount of the carbohydrate derivatives (multiple positive and negative peaks at 1150 –1000 cm− 1) is largely altered in both SHH silencing (Fig. 4E) and HIF1α silencing CD133 + groups (Fig. 5E) (but not significant in KLF4 silencing group, Fig. 3E). However, when compared to the group treated with negative siRNA, both KLF4 silencing (Fig. 3F) and SHH silencing (Fig. 4F) CD133 + cells have the high amount of nucleic acids (broad positive peak at 1250 –1190 cm− 1) (not significant in HIF1α silencing group, Fig. 5F).
Fig. 5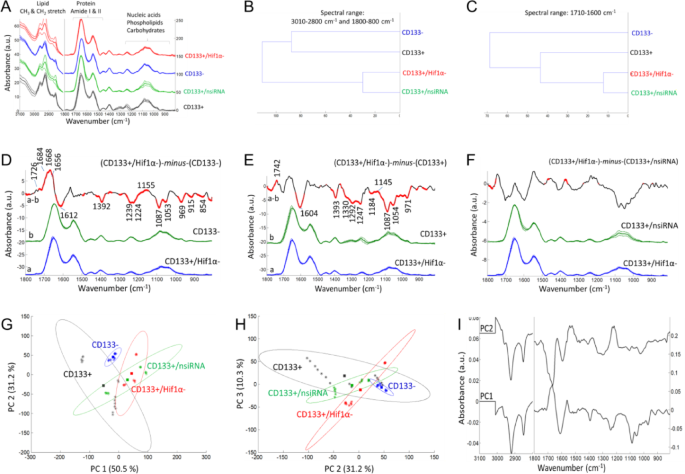
The ATR-FTIR data after the silencing of HIF1α gene. (A) Mean absorbance spectrum of each cell group (black color: CD133 + cells; blue color: CD133- cells; green color: the CD133 + group treated with negative siRNA; red color: the CD133 + group treated with HIF1α siRNA). (B, C) Hierarchical classification of cell groups, performed based on the Euclidean distances between the spectra. The FT-IR difference spectrum of (D) ΔA=(CD133+/HIF1α-)-minus-(CD133-), (E) ΔA=(CD133+/HIF1α-)-minus-(CD133+) and (F) ΔA=(CD133+/HIF1α-)-minus-(CD133+/nsiRNA) and Student’s t-test computed at every wavenumber with a significance level of α = 0.1%. Red thicker lines indicate statistically significant differences between the mean spectra. (G, H) Principal component analysis (mean-centered) for PC1, PC2 and PC3 plots with the percentage of total variance in each PC. (I) The PC1 and PC2 loading spectra.
Mean centred principal component analysis (PCA) was conducted to assess the similarities and differences among the cell groups (Fig. 3G, H for KLF4; Fig. 4G, H for SHH; Fig. 5G, H for HIF1α). According to the PCA results, the siRNA-treated groups are well separated from the CD133 + cell group, all with positive PC1 scores (55.9% for KLF4; 52.3% for SHH; 50.5% for HIF1α). Their PC1 loading spectra generally exhibit the negative peaks at 3000 –2800 cm− 1 (lipids), the positive peak at 1700 –1650 cm− 1 in the protein amide I band, and have multiple positive and negative peaks in the 1250 –1000 cm− 1 range (nucleic acids and carbohydrate derivatives). This indicates that the siRNA-treated cells are discriminated from other groups based on variations in cellular constituents, including lipids, proteins (amide I band region), nucleic acids and carbohydrate derivatives. Based on PC2 plot, the siRNA-treated groups and CD133- groups are separated both from the CD133 + group and CD133+/nsiRNA group with positive PC2 scores (29% for KLF4; 32.7% for SHH; 31.2% for HIF1α). Their PC2 loading spectra generally exhibit the broad positive peaks at 1560 –1490 cm− 1, 1250 –1190 cm− 1, 1086 cm− 1, 966 cm− 1 (due to nitrogenous bases and phosphate groups of nucleic acids) and represent the negative peaks at 3000 –2800 cm− 1 (lipids) and at 1700 –1650 cm− 1 in the protein amide I band. This strongly indicates that the siRNA-treated groups and CD133- groups are discriminated from other groups based on variations in nucleic acids, lipids and proteins. The PCA results are in line with the spectral profile of FTIR difference spectra and HCA analysis for each group. However, the groups are discriminated to the lesser extent in the PC3 plots (9.1% for KLF4; 8.35% for SHH; 10.3% for HIF1α) (For band assignments see Refs29,31,32,33,34,35.
X-Ray photoelectron spectroscopy reveals surface chemical alterations after gene Silencing
XPS is a semi-quantitative method used to obtain the percentage data of selected elements in a region with a surface penetration capability of approximately 10 nm. This method provided approximate data from at least three different samples for the region defined as the cell membrane and the immediately underlying region of the membrane. For each cell group, the first XPS measurement was a survey scan with a binding energy range of 1350 to -10 eV (the spectra are shown in the SI Figs. 2 and 3). For these measurements, the analyzer pass energy was set to 200 eV. In the survey spectra, oxygen, nitrogen, carbon and sulfur were the prominent elements for every cell group. In addition to these, a small amount of phosphorus was observed for the CD133 + cell group, and a small amount of silicon was observed for the CD133+/HIF1α, CD133+/SHH and CD133+/nsiRNA cell groups. High resolution measurements were performed for O 1s, N 1s, C 1s and S 2p energy levels for which the analyzer pass energy was set to 50 eV.
The fitting results for the C 1s spectra are shown in the Fig. 6A. In line with the literature37,38,39,40,41,42,43,44,45,46,47the C 1s spectra were fitted with four components. The C1 component is assigned to aliphatic hydrocarbons (CxHy). The C2 component is assigned to carbon that forms a single bond with either oxygen (C-O) in alcohol and ester functional groups, nitrogen (C-N) in amide and amine functional groups or sulfur (C-S). The C3 component is assigned to the carbon in the carbonyl bond (C = O) in the amide functional group, the carbon in the carboxylate functional group, and the carbon that forms two single bonds with two oxygen atoms (O-C-O) in the acetal functional group. The C4 component is assigned to the carbon in the carbonyl bond in carboxyl and ester functional groups.
Fig. 6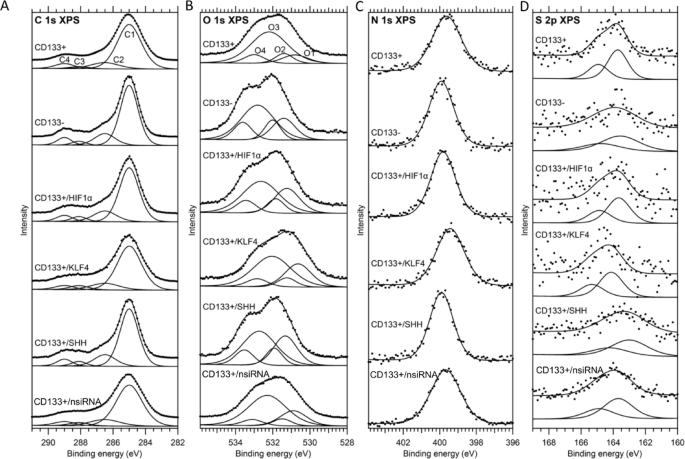
(A) The C 1s X-ray photoelectron spectra and the results of peak fitting for all cell groups. The spectra are normalized to the area of the highest-intensity peak (C1). (B) The O 1s x-ray photoelectron spectra and the results of peak fitting for all cell groups. The spectra are normalized to the area of the highest-intensity peak (O3). For each spectrum, the measurements (dots) and the resulting fit (solid line) are shifted upward to improve visibility. (C). The N 1s and (D) S 2p x-ray photoelectron spectra and the results of peak fitting for all cell groups. The spectra are normalized to the area of the highest-intensity peak. For each spectrum, the measurements (dots) and the resulting fit (solid line) are shifted upward to improve visibility.
The signature of these four components was most distinctly observed in the C 1s spectrum of the CD133- cell group. Therefore, the C 1s spectrum of the CD133- cell group was fitted first and used as a reference for the other cell groups. In the fitting procedure for the CD133- cell group, the FWHM values for all components and the binding energy value for the C1 component were set free and the binding energy values for the C2, C3 and C4 components were fixed at 1.5, 3.1 and 4 eV higher binding energies compared with the C1 component45. Although the contributions of instrumental and lifetime broadening to the FWHM values must be equal for all C 1s components, the FWHM values for the C2, C3, and C4 components were fixed to the FWHM value of the C1 component, scaled by a constant factor, to account for inhomogeneity in the structure and possible charging effects across different cell groups. Therefore, in the fitting procedure for the other cell groups, the only free parameters were the binding energy and FWHM values for the C1 component.
The fitting results for the O 1s spectra are shown in the Fig. 6B. Four components were also used for fitting O 1s spectra45. The O1 component is assigned to the oxygen in the carbonyl bond of amide and equivalent oxygen atoms in the carboxylate functional groups. The O2 component is assigned to the oxygen in the carbonyl bond of ester and carboxyl functional groups. The O3 component is assigned to the oxygen that forms a single bond with the C atom (C-O) in alcohol and acetal functional groups. The O4 component is assigned to the oxygen that forms a single bond with the carbon in carboxyl and ester functional groups.
O 1s spectrum of the CD133- cell group was chosen as a reference for fitting the O 1s spectra to be consistent with the procedure used for C 1s spectra. Similar to the fitting procedure used for the C1 spectrum of the CD133- cell group, the binding energy for the O1 component and FWHM values for all components were set free while the binding energy values for the O2, O3 and O4 components were fixed at 0.6, 1.4 and 2.2 eV higher binding energies compared with the O1 component45. In addition, because O2 and O4 components result from different oxygen atoms of the same functional groups (ester and carboxyl), their areas were set equal. Accordingly, in the fitting procedure for the other cell groups, the only free parameters were the binding energy and FWHM values for the O1 component. Similar to the case for fitting C 1s spectra the FWHM values for the O2, O3, and O4 components were fixed to the FWHM value of the O1 component up to a constant factor.
The fitting results for the N 1s and S 2p spectra are shown in the Fig. 6C and D. In the N 1s region, only one peak is observed and this peak is assigned to nitrogen in amide or amine functional groups38,3941–43,45,47,48. In the S 2p region, only one doublet is observed and this doublet is assigned to sulfur in thiol (-SH) or disulfide (-S-S-) species49,50,51,52,53,54. For the S 2p spectra, the binding energy difference (1.2 eV) and area ratio (1:2) for the 1/2 and 3/2 components were fixed to common literature values55. In the Table 3 fitting results for the C 1s and in the Table 4 fitting results for O 1s, N 1s and S 2p spectra are presented.
Table 3 The binding energy, FWHM, and total carbon-normalized peak area for different carbon species for all cell groups.Table 4 The binding energy, FWHM, and total carbon-normalized peak area for different oxygen species and nitrogen and sulfur for all cell groups.