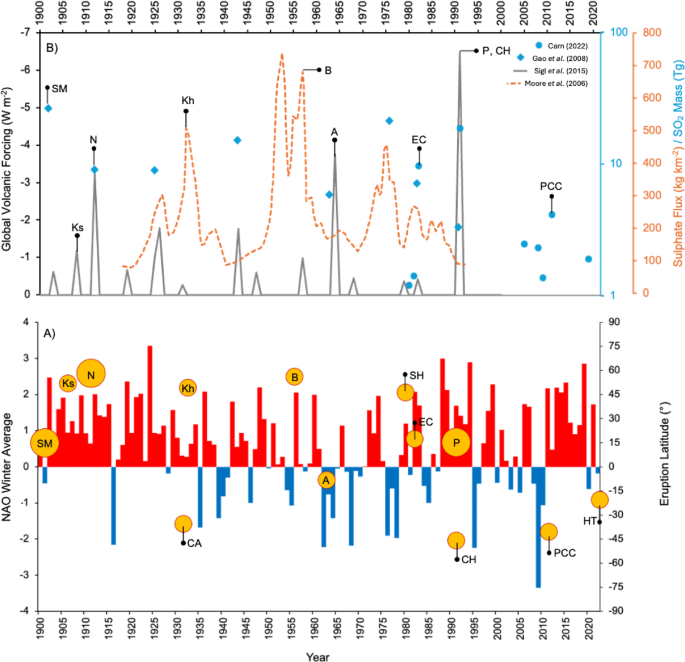
Initial Monte Carlo analysesNAO positives
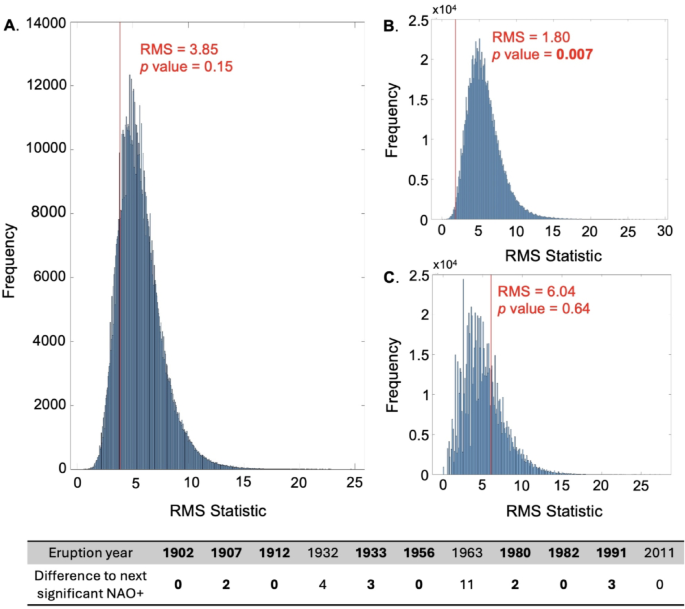
An initial Monte Carlo simulation integrating all VEI 5 and 6 eruption years since 1900 CE, regardless of their latitude, against NAO+ events (Fig. 2A) reveals no significant relationship between the datasets (p > 0.05). However, upon distinguishing between hemispheres, significant results emerge, showing a pronounced association between VEI 5 and 6 NH eruptions and NAO+ events (p < 0.01) (Fig. 2B). Specifically, a significantly positive NAO+ event has occurred within three years of every major NH eruption since 1900. This timeframe is consistent with the persistence of volcanic aerosols in the stratosphere, which can extend up to three years post-eruption16,18 but depends on the eruption latitude6. Excluding Mt. St Helens (1980) from NH analyses had no discernible impact on results, despite the eruptions’ notably low sulphur content, and results remained significant at the 1% significance level (p = 0.009).
Monte Carlo simulations of global (A), northern hemisphere (B) and southern hemisphere (C) VEI 5 and 6 eruptions against all significantly positive NAO winters (>1.88). The RMS probability distribution generated from randomly simulated surrogate NAO datasets is shown in blue. The relative position of the true RMS value is denoted by the red line and labelled with the associated p value. The underlying table contains the calculated differences between each eruption and the NAO+ event (RMS calculation inputs). NH values are shown in bold. Note that 1991 CE is included in both NH and SH simulations due to the aerosols affecting both hemispheres.
We then tested the relationship using the 15 highest points-determined years of NH volcanism (Table 3), which reinforces this correlation (p = 0.002), suggesting that the NAO is sensitive to not only large VEI 5 and 6 eruptions but also to more frequent VEI 4 NH eruptions. Conversely, SH VEI 5 and 6 eruptions show no discernible relationship with NAO+ events (p = 0.64), though the low eruption number limits the analysis’ robustness (Fig. 2C). Even when analysing the highest 15 points-determined years of SH volcanic activity, no significant relationship is found (p = 0.43).
NAO negatives
Identical analyses to those described above were conducted for NAO- events, but no significant relationship was found for either global or major NH eruptions, yielding p values of 0.31 and 0.43, respectively. The analysis for major SH eruptions could not proceed due to the limited number of suitable dates, exacerbated by the absence of significant NAO- events since 2010, resulting in the exclusion of both the Hunga Tonga 2021 and Puyehue-Cordón Caulle 2011 eruptions from the analyses. When the highest 15 points-determined years of SH volcanic activity were considered instead, a slightly more significant correlation was observed (p = 0.17) compared to NH eruptions, although it did not reach the minimum significance threshold (p = 0.05).
These results align broadly with existing research, including other statistics-based studies [e.g.,8], which generally do not identify a link between negative phases of the NAO and volcanic activity. However, the weak correlation with NH eruptions observed here contrasts with findings from the modelling results of Gudlaugsdóttir et al.33, Zambri et al.32 and Sjolte et al.34, who found that large extratropical eruptions were associated with a negative NAO response. Isolating extratropical NH eruptions (>30° N) from the simulation did not notably affect the observed significance (p = 0.32), which is consistent with the robust relationship already identified for NAO+ events.
Monthly-resolved NAO responses following NH eruptions
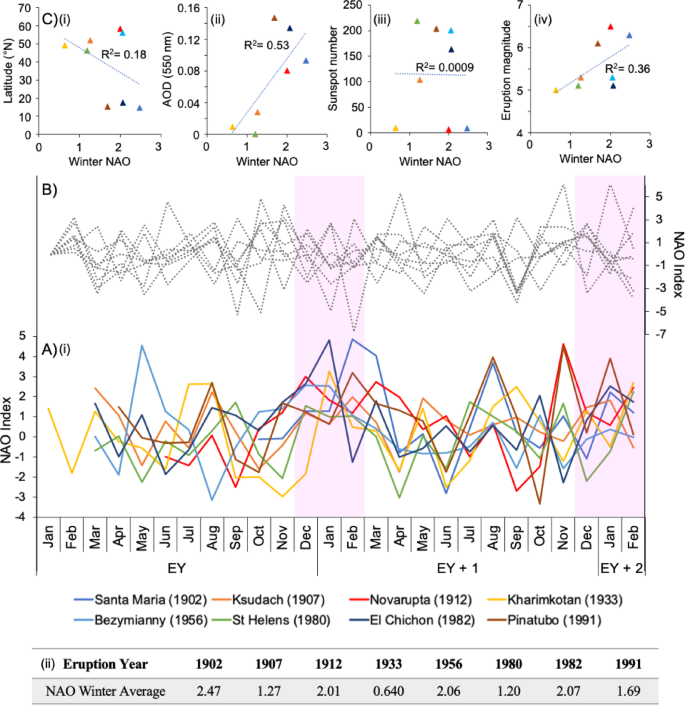
Following the identification of a significant relationship between major NH volcanism and NAO+ events, monthly NAO index values were plotted up to the end of the second winter following each eruption (Fig. 3). These plots revealed a noticeable upward anomaly in index values during the first winter, highlighting a consistent positive NAO signal post-eruption. In contrast, a comparison with eight randomly selected years not associated with major NH volcanism (Fig. 3) showed no similar trend, again consistent with a non-random NAO response after eruptions. Given the higher frequency of positive NAO winters compared to negative ones, the probability of randomly selecting eight positive years is relatively high (~6%). However, the probability that half of these winters exhibit statistically significant NAO+ events (>1.88) is less than 1% (p = 0.0025), strongly suggesting that NH volcanism pushes the NAO into a stronger positive state relative to background conditions. Conversely, the NAO response in the second winter appears more random, consistent with findings from other studies8.
(A) Monthly NAO timeseries following all VEI 5 and 6 eruptions, which begin the month of the eruption and continue to the end of the second winter after the eruption year (EY). Shaded regions highlight DJF trends corresponding the averages presented in A(ii). (B) NAO timeseries of 8 randomly simulated non-volcanic years (1926, 1931, 1935, 1940, 1954, 1971, 1998, 2009). (C) Scatter correlations comparing the amplitude of the NAO response to the eruption latitude (i), stratospheric aerosol optical depth (AOD) (ii;41), sunspot number (iii; sourced from the Sunspot Index and Long-term Solar Observations database) and eruption magnitude (iv). Marker colours correspond to the legend in Part A. The coefficient of determination (R2) is also presented, however, note that the distributions are not normally distributed given the small number of datapoints and the R2 provided will not be statistically significant. The Sato et al.41 AOD record analysed in Fig. 6C(ii) does not record a peak for the 1956 Bezymianny eruption, contrary to estimates from other studies (e.g.,42), and therefore this data point is not included in the plot.
Additionally, a moderate correlation (R2 = 0.53) exists between the NAO response amplitude and stratospheric aerosol optical depth. Interestingly, the mechanism proposed by Graf et al.43, which relies on the creation of an enhanced stratospheric temperature gradient, does not apply to high-latitude NH eruptions. This suggests that extratropical eruptions induce a different aerosol-mediated NAO response, which current models have not fully captured, potentially due to uncertainties in aerosol behaviour14 or limited observational constraints on large high-latitude eruption impacts in the satellite era6.
Furthermore, a moderate correlation exists between eruption magnitude and the NAO amplitude: the NAO response sensitivity to eruption magnitude supports the use of VEI as an appropriate measure of eruption size for this study (given a generally linear relationship between VEI and magnitude), despite potential limitations40. The impact of eruption season on the NAO was also considered, given its known influence on climate response to volcanic events44. However, due to the clustering of considered eruptions between March and June, conclusive inferences regarding seasonality effects could not be drawn from this dataset.
Inferences from SLP reanalysis data
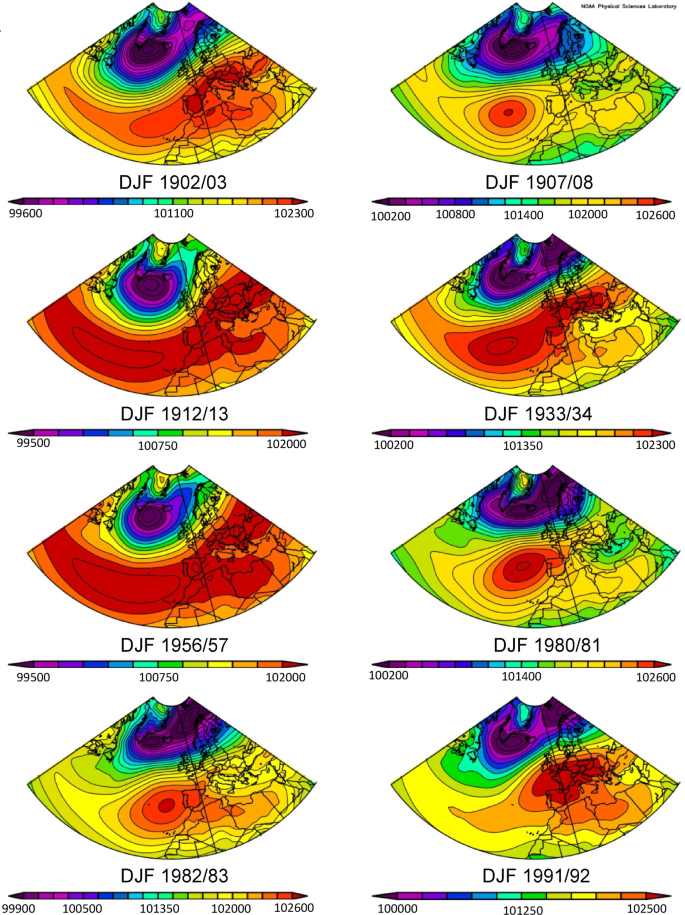
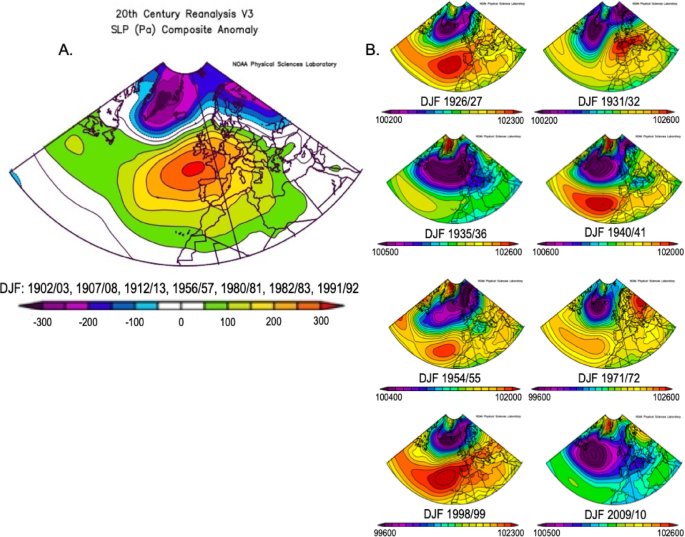
The analysis of mean sea level pressure (SLP) plots across Europe and the North Atlantic provides valuable insights into the behaviour of the Azores High (AH) and Icelandic Low (IL) pressure centres, shedding light on the NAO response following NH eruptions (Fig. 4). Using the NOAA tool, each plot’s unique scale initially portrays varying AH extents. However, when considering absolute SLP values, a consistent pattern emerges across the North Atlantic and western Europe during the winter following all eruptions, characterised by SLP values of at least 102,000 Pa. This threshold, identified in previous research by Davis et al.45, signifies an extensive AH presence typical of a positive NAO phase. Although some variability exists in the size and exact location of AH pressure maxima, indicated by the red zones on the map, the post-eruption pressure centre is often found over the Azores. A notable exception is observed following the Pinatubo eruption in 1991 CE, where the AH appears eastwardly displaced—a feature more commonly associated with a SH response and discussed further below.
Mean sea level pressure (SLP) over the North Atlantic Region in winters following all major NH eruptions plots generated using NOAA Physical Sciences Laboratory twentieth century reanalysis data.
The strength of the IL shows more variability between eruption years, with pressure minima over Iceland ranging from 995 to 1002 hPa. No clear relationship exists between the response and eruption latitude, with both the strongest and weakest IL occurrences corresponding to high-latitude eruptions, and with low latitude NH eruptions linked to intermediate IL strengths. However, winters with the weakest IL coincide with eruptions characterised by substantially lower stratospheric aerosol optical depth (AOD) (e.g., Ksudach 1907, Kharimkotan 1933, St Helens 1980) (Fig. 3), suggesting that polar vortex strength changes and dependence on stratospheric aerosol concentrations may influence the post-eruptive response at the northern node of the NAO.
Plots of eight randomly simulated years (Fig. 5) illustrate the significant variability in the extent and intensity of both pressure centres independent of volcanic activity. In contrast, post-eruption responses appear to exhibit a consistently uniform AH and IL configuration. The low-pressure region around the IL remains confined to high latitudes relative to random datasets, indicating a relatively strong jet stream and polar vortex inferred for all post-eruption winters, despite variations in SLP minima.
(A) North Atlantic SLP anomalies in post-eruptive winters, calculated across the period 1836–2015. (B) Mean SLP plots of eight randomly simulated non-volcanic years (1826, 1931, 1935, 1940, 1954, 1971, 1998, 2009).
An anomaly plot of post-eruptive winters (Fig. 5) reveals that pressure centres are strengthened compared to the mean since 1836, underscoring that the NAO response to volcanic activity is notably stronger than the predominantly positive background conditions observed throughout the study period. Contours compressed at the northern end of the AH and the position of the strongest anomaly southwest of the UK suggest a relative northward AH shift in post-eruption winters compared to its mean position. This observation is consistent with previously observed and modelled results following eruptions like 1982 El Chichón and 1991 Pinatubo43, and this data suggests it applies to older and more northerly eruptions as well.
This northward shift could potentially be explained by the expansion of Hadley circulation, driven by factors such as a reduced tropospheric meridional temperature gradient or stratospheric ozone depletion, processes observed following volcanic aerosol influxes16. Given that ozone concentrations are highest towards the poles, high-latitude NH eruptions may have the greater influence via this mechanism, highlighting its importance for further study, especially because aerosol concentrations may influence the NH response but not align with the stratospheric gradient mechanism consistently.
Possible modulators of NAO response amplitude
The study of the Arctic Oscillation (AO) has suggested that volcanic aerosol amounts directly reaching the polar vortex can significantly influence the AO response46. Although no similar mechanism has been proposed for the North Atlantic Oscillation (NAO), the strong link between these two modes of variability and the lack of a well-established NAO forcing mechanism for extratropical volcanism make this a plausible consideration for further investigation.
The climate impacts of volcanic eruptions occurring on the Kamchatka peninsula, including events like Ksudach 1907, Kharimkotan 1933, and Bezymianny 1956 CE, appear linked to polar vortex state preceding the eruption. For instance, Qu et al.46 demonstrate with the 1987 Shiveluch eruption that high-pressure ridges, located at the polar vortex gyre’s periphery and characterized by sinking, diverging air, can obstruct significant amounts of volcanic dust and aerosols from reaching the Arctic region. This suggests that pre-existing polar vortex state could explain why eruptions of similar magnitude, such as Ksudach 1907 and Bezymianny 1956, resulted in notably different NAO responses. Moreover, the 1991 Pinatubo eruption, despite being the strongest volcanic event of the twentieth century, exhibited a relatively muted response. Qu et al.46 propose that the low latitude of Pinatubo led to substantial aerosol loss within various atmospheric circulation belts before reaching the Arctic, thus reducing its influence on polar vortex strength and the eruption’s impact on the AO. However, this explanation does not align well with the findings of this study. For instance, other low-latitude eruptions like Santa María 1902 and El Chichón 1982 produced some of the largest winter NAO index values. This discrepancy suggests that factors beyond aerosol transport dynamics play a role in shaping the NAO response to volcanic eruptions.
Another factor influencing the subdued response of Pinatubo could be related to the more symmetrical hemispheric distribution of its aerosols compared to other NH eruptions47. Additionally, concurrent environmental factors such as the easterly phase of the Quasi-Biennial Oscillation (QBO), which tends to weaken the polar vortex and promote more negative NAO indices, may further bias the NAO towards a less positive response following the Pinatubo eruption. It is also possible that a subpolar and eastern tropical North Atlantic SST cooling leads an NAO positive event48. Gastineau and Frankignoul48 suggest that surface changes in the western subpolar region might modify transient and stationary eddies, resulting in a positive feedback leading to a large-scale equivalent barotropic signal. Volcanic aerosols may induce this initial SST cooling. Overall, whereas volcanic aerosol transport and aerosol interactions with atmospheric circulation patterns are crucial for understanding volcanic impacts on climate, the nuanced NAO responses following different eruptions highlight the need for continued research into the specific mechanisms driving these interactions.
NAO response to SH eruptions
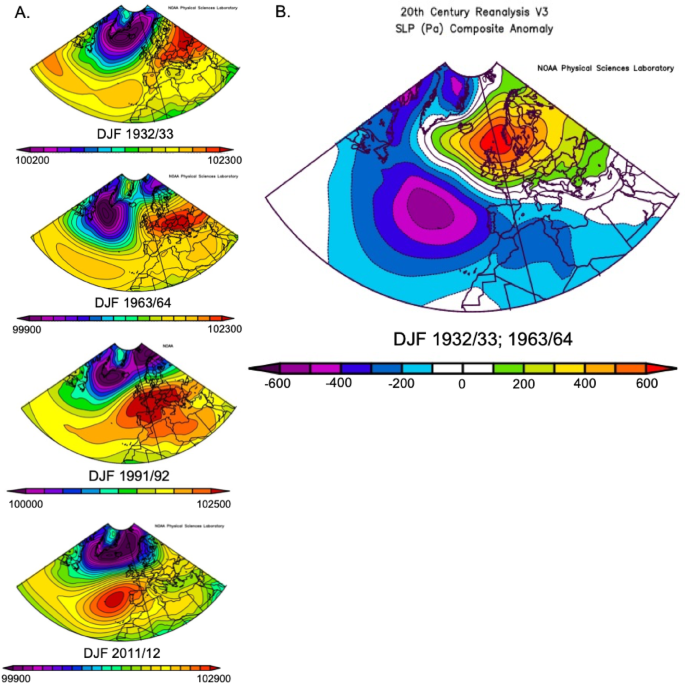
Although we did not find any significant relationship between Southern Hemisphere (SH) eruptions and the North Atlantic Oscillation (NAO), reanalysis plots illustrate a distinct sea level pressure (SLP) configuration in winters following SH eruptions compared to those following Northern Hemisphere (NH) eruptions (Fig. 6). This configuration often shows a notable eastward displacement of the Azores High (AH). Although this trend also appears in the random dataset (indicating it is not entirely unique (e.g., 1931/32, 1971/72) (Fig. 5)), the presence of positive and negative anomalies up to 600 Pa following eruptions like Cerro Azul 1932 and Mt Agung 1963, where the eastward displacement is most pronounced, suggests this pattern is highly unusual (Fig. 6). A subtler shift occurred in winter 1991/92, associated with the VEI 5 eruption of Cerro Hudson in August 1991 and the hemispherically symmetrical aerosol distribution from Mt Pinatubo, which would have resulted in significant SH aerosol concentrations that winter.
(A) Mean North Atlantic winter sea level pressure following southern hemisphere eruptions. (B) SLP anomaly plot following the eruptions of Cerro Azul 1932 and Mt Agung 1963 relative to the period 1836–2015.
Despite these observed patterns, there were too few twentieth century examples of large SH eruptions to statistically evaluate their relationship to the NAO with our techniques, making any identified similarities somewhat speculative. However, the occurrence of such a highly anomalous pattern in three out of four SH post-eruptive winters does warrant further research. Additionally, the SLP data highlight a limitation of this study: the use of a two-point station index to quantify the NAO. For example, strong similarities in dynamic responses in the winters of 1932/33 and 1963/64 exist, despite significantly different NAO index values (0.275 and -0.763 respectively36). This discrepancy is largely attributable to the inability of two-point station indices to account for dynamic shifts in the centres of action, as demonstrated here under extreme SLP configurations49.
Changes across the study window and future trends
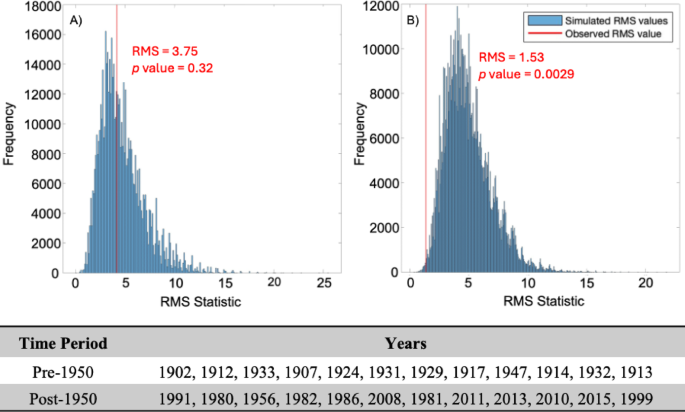
Monte Carlo analyses were run pre- and post-1950 to investigate whether the acceleration of global industrialisation and anthropogenic emissions has influenced the NAO response to volcanism. Because the significance of major NH eruptions across the study window has already been identified, VEI 5 and 6 eruptions were omitted from these simulations, which were instead designed to see whether the NAO has become more-or-less sensitive to more moderate volcanic activity under increasing background concentrations of anthropogenic stratospheric sulphate aerosols. Monte Carlo analyses of the highest ‘points determined’ years, considering only eruptions VEI 4 and below against NAO+ events, strikingly demonstrate how pre-1950, moderate NH volcanic activity does not appear correlated to NAO+ events (p = 0.32), whereas post-1950 the twelve highest years of volcanic activity are correlated with an NAO+ at the 1% level (p = 0.0029) (Figure 7). This does not necessarily mean that the NAO was not sensitive to VEI 4 eruptions in the past but suggests that the sensitivity may have increased since 1950, meaning that the response associated with these eruptions more frequently surpasses the NAO threshold value considered in the Monte Carlo simulation (>1.88). These results seem consistent with other studies proposing that rising background aerosol concentrations are biasing the NAO towards more positive conditions25 and more frequent extreme positive events24. However, the possibility of the NAO becoming generally more sensitive to smaller volcanic sulphur injections under rising background concentrations may also be plausible, given that some studies suggest a threshold aerosol concentration is required to trigger the NAO response50. Finally, these results are important from a geoengineering perspective, where injection of sulphur into the NH to counteract global warming may result in a shift to a NAO+ phase.
Monte Carlo analyses of points determined years of moderate volcanic activity (eruptions VEI 4 and below) against NAO+ events for the period 1900–1950 (A) and 1950–2022 (B). The years included in each simulation are given in the table, in the order of highest to lowest points scored.

