
ALADDIN study population
The Assessment of Lifestyle and Allergic Disease During Infancy (ALADDIN) birth cohort aims to investigate lifestyle factors in the anthroposophic lifestyle and their association with non-communicable diseases in early life, such as allerg21. A total of 466 children were followed from birth until 5 years53. Families were categorised into the lifestyle groups, anthroposophic and non-anthroposophic, based on their choice of Maternal Healthcare Centre and parental responses to the questions on a) choice of future type of preschool/school, b) view of lifestyle, and c) the influence of lifestyle on daily life. The families completed detailed questionnaires at enrolment regarding background, health, lifestyle, and diet, and again at 2, 6, 12, 24, and 60 months postpartum, where also health examinations of the children were carried out. Inclusion criteria for this sub-study were based on the existence of longitudinally collected faecal samples from 8 time points during early life of the children and twice from their mothers. Children born pre-term (before gestational week 36) were excluded from the study. Combined this resulted in inclusion of longitudinal samples from 56 mother-child dyads, with children born between 2004 and 2007. Of these, 21 were raised in anthroposophic and 35 in non-anthroposophic families.
Maternal antibiotic use during pregnancy and delivery was assessed by questionnaires at enrolment. Neonatal antibiotic treatment was assessed by maternal interview when children were 2 months of age (one child had received antibiotics intravenously in connection to delivery). Information on antibiotics prescribed to the child was collected from the Swedish Drug Register at the National Board of Health and Welfare, which was launched July 1st 2005. For the seven children born before July 1st 2005, the information on antibiotics use was assessed from interviews and questionnaires performed during early infancy (none of the children had parental report on antibiotics use until the Drug Register was launched). All commercial products reported in the Drug Register were assigned to an antibiotic class based on antibiotic classifications in the CARD.
The study was approved by the Local Ethical Committee Huddinge 2002-01-07 (2002/474-01) and Regional Ethical Committee Stockholm 2010-04-30 (2010/741-32), and written informed consent was obtained from the parents.
Collection of faecal samples
Faecal samples, in total 547, were collected, frozen within 20 min of collection and stored at −20 °C until later transport in a frozen state for storage at −80 °C.
Quantification of faecal water metabolites
Aliquots of 100–350 mg from faecal samples collected at 2 and 6 months of age were precisely weighed and diluted 1:4 (w/v) in sterile Milli-Q water and homogenised by vortexing. An aliquot of each homogenised sample was used for metabolite quantification, while the remaining sample was used for quantifying bacterial load. Sample aliquots were centrifuged at 16,000 × g, 4 °C for 5 min. Supernatants were transferred to new tubes and centrifuged at 16,000 × g, 4 °C for 10 min. The resulting supernatants were stored at −80 °C in 100 µL aliquots until further sample preparation. Samples were thawed at 4 °C and centrifuged at 16,000 × g for 10 min. Subsequently, 80 µL supernatant was transferred to a new tube in which 20 µL internal standard mix (4 µg/mL isotope-labelled aromatic amino acids: Tyrosine-d4, Phenylalanine-d5, Tryptophan-d5, and Indoleacetic acid-d2) and 240 µL ice-cold acetonitrile were added. Samples were vortexed, incubated at −20 °C for 10 min, and then centrifuged at 16,000 × g, 4 °C for 10 min. For each sample, 320 µL supernatant were transferred to a new tube and dried under a stream of nitrogen. Residues were re-dissolved in 80 µL sterile Milli-Q water for a final sample dilution of 1:4 and internal standard concentration of 1 µg/mL, vortexed, and centrifuged at 16,000 × g, 4 °C for 5 min. Final supernatants were transferred to liquid chromatography vials with inserts and stored at −20 °C until analysis. 10 µL from 56 random samples (seven random samples from each of the eight time points) were pooled for QC. Targeted UPLC-MS was then employed to quantify the aromatic lactic acids in the faecal water samples using isotope-labelled aromatic amino acids as internal standards as previously described31.
Quantification of bacterial load in faeces
The number of bacterial cells was quantified as described in Eriksen et al.54 with few modifications: Briefly, 100–200 mg faeces was weighed accurately. The homogenised samples, diluted 1:4 in Milli-Q water, were further diluted 2.5-fold in Milli-Q water, and centrifuged at 50 × g, 4 °C for 15 min. Supernatant was transferred to a new tube and centrifuged at 8000 × g, 4 °C for 5 min. The bacterial pellet was washed twice in sterile PBS + 1% BSA (>98%, Sigma-Aldrich) with centrifugation at 8000 × g, 4 °C for 5 min, and resuspended in sterile PBS + 1% BSA. An aliquot was diluted 150x in PBS + 1% BSA + 0.01% Tween20 + 1 mM EDTA, mixed with 1 mM DAPI and BD Liquid Counting Beads (BD Biosciences). 200,000 DAPI+ events were acquired on a FACSCanto II (BD Biosciences) flow cytometer. Bacterial counts were defined by gating the bacterial population on SSC-A/Pacific Blue. The number of recorded count beads was used for calculating the recorded sample volume to determine the number of bacteria per µL solution. The bacterial concentration was multiplied by the dilution factor and divided by the input faecal mass (in grams) to calculate the number of bacteria per g faecal matter.
DNA extraction of faecal samples
DNA extraction of the 547 faecal samples was conducted in a 96-well format using the Nucleospin 96 soil kit from Macherey Nagel (MN) according to the instructions given by the manufacturer with the following modifications: Aliquots of approximately 50–100 mg were collected from the original faecal samples (kept on dry ice). Samples were mixed with 700 µL buffer SL1 and 150 µL Enhancer SX in MN bead tubes type A containing 0.6–0.8 mm ceramic beads and vortexed on a horizontal vortexer for 5 min at full speed, then centrifuged for 10 min at 11,000 × g. 150 µL buffer SL3 was added to each sample and vortexed for 5 s. Samples were stored at −80 °C until the next step. Samples were thawed on ice and vortexed for 5 s, then centrifuged for 10 min at 11,000 × g. 800 µL of clear supernatant was transferred to each well of the MN Nucleospin Inhibitor Removal Plate and centrifuged at 4700 × g for 6 min. 250 µL of buffer SB was added to the flow-through in each well of the MN Square-well Block and mixed. 750 µL of the flow-through was transferred onto the MN Nucleospin Soil Binding Plate (4700 × g for 5 min). Washing of the silica membrane was done according to instructions from the manufacturer, with the exception that all centrifugation steps were done at 4700 × g. The plate was air-dried for 15 min and placed on collection tube strips. 50 µL of preheated (80 °C) buffer SE was loaded directly onto the silica membrane of each well and incubated for 10 min (4700 × g for 3 min). This step was repeated. The eluted DNA was stored in Eppendorf tubes at −80 °C.
Shotgun metagenomic sequencing, QC and assembly
Library formation and shotgun sequencing of the 547 faecal samples were performed as previously described using the BGISEQ-500 platform and 100 base pair (bp) paired-end (PE100) sequencing55. QC of raw reads was performed using an overall accuracy (OA)-based algorithm to detect and filter low-quality reads using a default parameter (OAfragment = 0.8). After QC, all remaining reads were aligned to the human genome assembly GRCh37 (hg19) to remove human-derived reads. Contigs were assembled from trimmed and host removed reads using MEGAHIT (v1.1.1)56 (Supplementary Data 4).
Identification of microbial resistance genes
The contigs were used to predict prokaryotic genes using Prodigal57 (v2.6.3). Resistance genes were identified by applying Resistance Gene Identifier RGI v5.2.0 and CARD v3.1.2 (2021-04-23)58 on all prokaryotic predicted genes from all contigs in the 547 faecal samples using standard settings. Genes with a “Perfect” or “Strict” annotation were considered positive hits. Hits flagged as ‘nudged’ were excluded from further analysis.
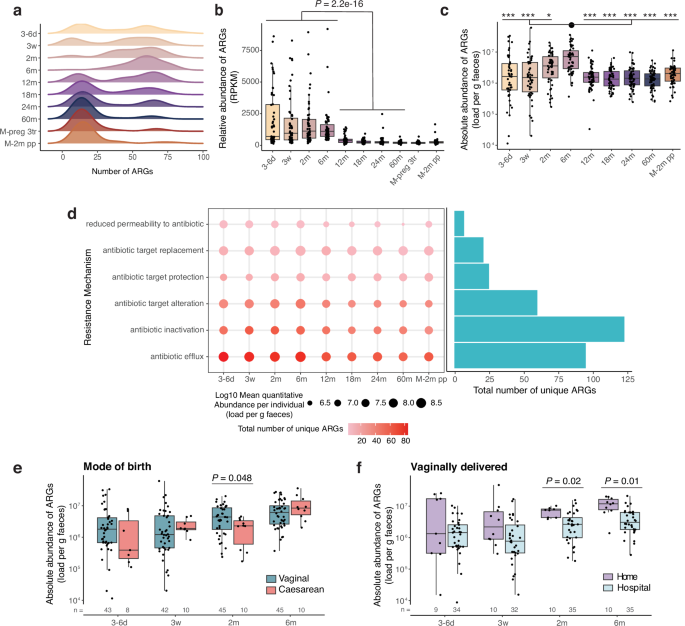
A total of 47,960 genes detected in the dataset were assigned as ARGs according to CARD. Annotation of the ARGs on the Antibiotic Resistance Ontology (ARO) revealed that the detected genes belonged to 315 unique functional genes. Prevalence of the genes across samples revealed that three genes were more prevalent that most other genes. Specifically, dfrA42 was present in 99.8% of the samples, adeF was present at 86% of the samples and dfrA43 at 85% of the samples. dfrA42 and dfrA43 genes have been recently described as trimethoprim resistant dihydrofolate reductases59. According to CARD, the phylogenetic spread of those genes is limited, and the reported species are not regular members of the gut microbiota. Thus, we considered this ARG to be wrongly annotated, potentially by falsely annotating the regular dihydrofolate reductase as the resistant variant, and the two genes were removed from the ARG dataset. Concerning adeF, previous studies60 have shown that the current CARD model for the given gene can lead to the wrong annotation of similar RND (Resistance-nodulation-cell division) efflux pump genes as adeF. As these genes also confer antibiotic resistance, it was decided not to discard adeF. The resistance mechanisms and resistance per antibiotic drug classes were assigned based on the RGI annotation. Genes that were annotated to provide resistance against more than one of the drug classes were characterised as multidrug resistance genes. The clinically relevant ARGs were defined based on the latest WHO Bacterial Priority Pathogen List, 202461 and Diebold et al.62.
In addition to the contig-based approach to identify ARGs described above, a read-based approach was also applied. In brief, trimmed host clean pair reads were mapped to CARD, v3.1.2, using the rgi bwt tool from RGI, v6.0.3. Genes with an average coverage ≥ 80% were considered as positive hits. A strong correlation was identified between the ARG abundance determined using the read- vs. the contig-based approach (R = 0.97, P < 2.2e-16).
For both the contig- and read-based method, gene abundance was calculated based on RPKM (reads per kilobase per million mapped reads), with the formula: ‘reads mapped to ARG gene’ / (‘gene length in kilobase pairs’ × ‘reads mapped to all prokaryotic genes’/106). Absolute ARG abundance was calculated as: (RPKM/106) × ‘bacteria per gram of faeces’.
Metagenome binning and dereplication
Trimmed metagenomic reads were mapped to assemblies with Bowtie2 v2.5.063, and SAM files were converted to BAM format with SAMtools v1.1664. The BAM files were sorted with the samtools sort function and indexed with the samtools index function. SemiBin v1.5.165 was run with the single_easy_bin mode using self-supervised learning for the model with the assembly fasta and sorted and indexed BAM file for each sample. The re-clustered output bins of SemiBin for each sample was dereplicated based on 98% average nucleotide identity (ANI) with the dRep dereplicate function of dRep v3.4.066 using –S_algorithm ANImf.
The quality of the dereplicated bins was evaluated with checkM2 v1.0.167, using the checkm2 predict function with the general model. The MAGs were taxonomically classified using the classify_wf of GTDB-Tk v2.4.068 with the GTDB r220. Virulence genes were detected for each genome based on the Virulence Factors of Pathogenic Bacteria (VFDB) database69 using ABRIcate (v.1.0.1)70.
For each of the samples, the relative abundance of each MAG with >75% completeness and >5% contamination was calculated with the coverm genome function of coverM v0.6.171 using the options –min-read-aligned-percent 0.75, –min-read-percent-identity 0.95, –min-covered-fraction 0.
Mapping resistance genes to MAGs
An ARG was assigned to a MAG if the contig that contained a certain ARG was part of any medium quality (>50% completeness, <5% contamination) MAG before dereplication. The above resulted in 74% of ARGs, as gene hits, to be mapped to a MAG. ARGs assigned to a MAG accounted for 70% (±22.2) of the ARG relative abundance for each sample. Undereplicated MAGs were matched to their dereplicated representative (98% ANI), which led to a final taxonomic assignment of each ARG.
Strain analysis
Analysis was performed using InStrain v.1.7.572. First, the MAG catalogue was dereplicated using dRep v3.4.066 to 95% ANI similarity to get species level representative genomes. Next, raw reads were mapped to the species-level dereplicated catalogue using bowtie2 v2.4.263. The E. coli strain profile of each sample was calculated using the function inStrain profile with the above-created SAM files and the consensus E. coli MAG. Finally, inStrain compare was used to compare strain profiles between each two samples. Two samples were considered to share the same profile if they had a coverage of at least 30% and a population average nucleotide identity (popANI) higher than 99.999%. When at least one early life sample fulfilled the above criteria when compared to any of the corresponding maternal samples (pre- or post-partum), it was considered as a shared strain population.
Aromatic lactate dehydrogenase (aldh) gene identification in MAGs
Genome annotation was performed for all MAGs with prokka (v 1.14.5)73 with default settings. Additionally, 13 genomes of aldh+ and aldh- bifidobacteria genomes31 were downloaded from NCBI and annotated similar to the MAGs. All genes annotated as lactate dehydrogenase (ldh) (EC number 1.1.1.27) were aligned with multiple sequence alignment using clustal-omega (v 1.2.1)74 with default settings. A phylogenetic tree was generated based on the alignment with FastTree (v 2.1.11)75 and was visualised with iTOL v776. All genes that belonged to the same cluster as the aldh genes from the annotated reference genomes, and shared the same gene size, were considered as aldh, and the MAGs harbouring these genes were considered aldh+. All other bifidobacteria strains were designated as aldh-.
Replication cohort (Copenhagen Infant Gut cohort)
The study design, microbiota and metabolomic analyses to determine the ALAs have been described in detail previously31. The study was approved by the Data Protection Agency (18/02459), and informed consent was obtained from all parents of infants participating in the study. Briefly, the cohort consists of 25 healthy infants from the Copenhagen region, Denmark. Infant faecal samples were collected approximately every second week between the first week of life and 6 months of age, resulting in a total of 269 samples. As described in detail previously31, DNA was extracted from faeces, and sequenced using 16S rRNA gene amplicon sequencing. Data processing was performed using the UPARSE pipeline77. qPCR and strain- or species-specific primers were used to quantify the abundance of the aldh+ bifidobacteria, as described in detail previously31.
Growth of infant isolates in the presence of metabolites
All strains used in this study were isolated from faecal samples of different children at 1 week, 1 month or 12 months of age enroled in the Copenhagen Prospective Studies on Asthma in Childhood 2010 (COPSAC2010) cohort, approved by the local Ethics Committee (H-B-2008-093) and the Danish Data Protection Agency (2015-41-3696).
To identify the 3 E. coli isolates with closest genomic resemblance to each of the four E. coli MAGs identified in the ALADDIN-enroled children, we computed the genomic distance (ANI) between the four E. coli MAGs of the dataset and the 690 isolate E. coli genomes from COPSAC2010-enroled infants, calculated using Mash78. Redundancy amongst the genomes of the 690 isolates was removed by clustering them according to HC1100 scheme provided by EnteroBase79, including random selection of one representative genome for each cluster. The three closest HC1100 clusters for each of the four MAGs were selected (ANI range 98.4%–99.9%), resulting in the selection of 3 × 4 isolates. One of the isolates was missing in the culture collection, leading to eleven isolates being available for the in vitro cultivation experiment. Three K. pneumoniae and three C. freundii strains were also selected from the same biobank. One K. pneumoniae strain was growing in aggregates, which hindered OD measurements and was therefore removed from the dataset.
The sixteen infant-derived strains were struck from frozen stocks onto LB plates and incubated at 37 °C for 24 h. They were then transferred to LB liquid medium and grown overnight at 37 °C, and finally inoculated at OD600 = 0.1 into 96-well plates containing diluted LB medium (1:2) and the tested metabolites (DL-indole-3-lactic acid (ILA, I5508, Sigma), DL-p-hydroxyphenyllactic acid (4-OH-PLA, H3253, Sigma), D-phenyl lactic acid (PLA, 376906, Sigma), sodium L-lactate (L7022, Sigma), sodium acetate (S5636, Sigma)) each at a final concentration of 0.1, 1 or 10 mM, or positive controls (1% DMSO and dH2O). ILA, PLA, 4-OH-PLA stocks of 1 M were made in DMSO, and acetate and lactate stocks at 1 M in dH2O. Three different antibiotics (NaI 0.1 mg/mL, Gentamycin 0.01 mg/mL, Tetracyclin 0.01 mg/mL) were used as three separate negative controls and tested in triplicates. The 96-well plates were incubated at 37 °C and OD600 was measured every hour for the first 6 h and at 22 h with a Biotek ELx808 plate reader. No growth was observed for any of the negative controls. Growth was estimated as the OD600 difference between each sample and the OD600 of the negative control samples (average of all replicates for three antibiotic conditions) for the given time point (delta OD600 was based on the mean of the triplicates). Three independent experiments were performed with three replicates each time, and the average delta OD600 was calculated by using the mean per time to calculate the mean of the three independent replicates.
Statistics & reproducibility
Statistical analysis was performed using R v4.0.5. No statistical method was used to predetermine sample size. Shannon diversity and richness were calculated using diversity() and specnumber() functions according to the vegan package (v2.6.4) in R. Differences across time points were calculated with a Dunn’s test with the dunn.test() function of the R package dunn.test (v1.3.5), with Benjamini–Hochberg correction for multiple comparisons. Effects of environmental variables (delivery mode and home birth) and log10-transformed absolute and relative ARG abundance were assessed by linear regression models using the lm() function from the package stats (v4.2.1). Models were controlled for sex, family lifestyle, and feeding mode at 2 and 6 months. Effects of environmental parameters on absolute E. coli abundance were calculated by a two-sided Wilcoxon rank-sum test using wilcox.test() from the package stats (v4.2.1).
ARG β-diversity was calculated based on Bray-Curtis dissimilarities calculated from Hellinger-transformed abundance matrices with the R package vegan (v2.6.4). Differences across time points were calculated based on ANOSIM using the anosim() function of the same package based on Bray–Curtis dissimilarity on Hellinger-transformed data and 9999 permutations. Correlation between the resistome and microbiota composition was estimated by comparing the Bray–Curtis dissimilarity matrices of the two datasets with the Mantel test using the mantel() function of vegan, a Spearman correlation and 9999 permutations. The abundance of the bacterial taxa was fitted to the ARG ordination with the function vegan::envfit(). FDR correction of the P values of the significantly associated taxa was performed using Benjamini–Hochberg correction, and only the taxa with r > 0.15 and Padj value < 0.01 were displayed at the NMDS ordination plot. PERMANOVAs were performed using the adonis2() function from vegan with 999 permutations, except for categorical variables with fewer than five children in each stratum. Adonis2() was run with the option by = ‘margin’, accounting for sex, birth mode, and family lifestyle. FDR correction of the P values was performed using Benjamini-Hochberg correction per time point. Correlations between the abundance of E. coli and the Bifidobacterium species, or E. coli and faecal aromatic lactic acids, were calculated by Spearman correlations using the cor.test() function from the package stats (v4.2.1). All statistical tests were two-sided, and Padj-values were considered significant when lower than 0.05, unless otherwise specified.
Reporting summary
Further information on research design is available in the Nature Portfolio Reporting Summary linked to this article.