
The soil was taken from shield tunneling Section No. 02 of Xizhimen Station (Beijing Metro Line No. 13 Capacity Expansion and Upgrading Project). The particle-size distribution curve is shown in Fig. 1. The soil mainly comprises 8% cobbles (> 80 mm), 16.1% coarse gravel (20–80 mm), 28.4% fine gravel (5–20 mm), 27.3% sand (0.075–5 mm), and 20.2% fines (< 0.075 mm). With a uniformity coefficient (Cu) of 1000 (Cu> 6) and a curvature coefficient (Cc) of 2.5 (1 < Cc < 3), the natural soil sample is well-graded in accordance with GB/T50145-200735. Fines content is defined as the mass percentage of granular soil particles with particle size less than 0.075 mm, and the fines contents of granular soil used in the experiment are 10%, 20%, 40%, 60% and 80%, respectively.
Fig. 1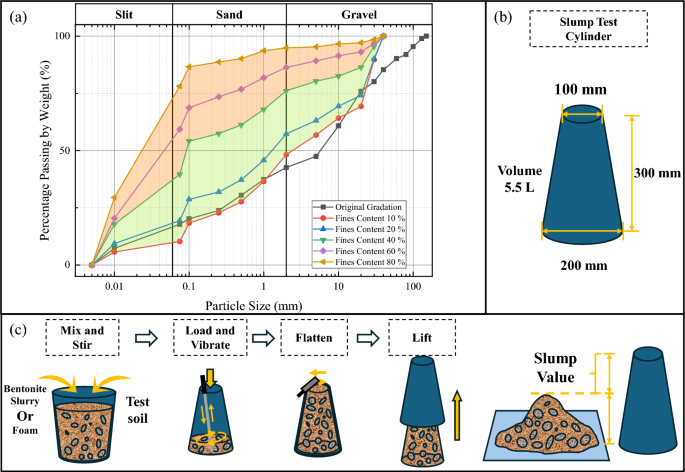
Grain-size distribution curve of original and experimental soils and slump test procedure. (a) Grain-size distribution curve of experimental soils with different fines contents; (b) The slump test cylinder; (c) The procedure of slump test.
The slump test was used to evaluate the workability of the conditioned soil. Existing research indicates that the optimal slump value for well-conditioned pebble soil ranges from 150 to 200 mm25,36,37. Pebble particles greater than 40 mm were removed, owing to limitations in the slump test. The procedure, using a standard slump cylinder is shown in Fig. 1.
The relevant parameters were calculated using the following equations:
$$SIR = \frac{{M_{s} }}{{M_{m} }}$$
(1)
$$FIR = \frac{{Q_{L} }}{{Q_{m} }}$$
(2)
$$C_{s} = \frac{{M_{b} }}{{M_{s} }} \times {\text{100(\% )}}$$
(3)
$$C_{f} = \frac{{Q_{f} }}{{Q_{L} }} \times {\text{100(\% )}}$$
(4)
where SIR is the slurry injection ratio; FIR is the foam injection ratio; the Cs is the weight concentration of bentonite slurry (%); Cf is the volume concentration of the foam (%); Ms is the weight of bentonite slurry (g); Mm is the weight of conditioned soil (g); QL is the volume of foam (mm3); Qm is the volume of conditioned soil (mm3); Mb is the weight of bentonite (g); and Qf is the volume of the foaming solution (mm3).
Figure 2a is the slump values for unconditioned sandy pebble soil with different fines content. For soil with fines contents of 10%, 20%, and 40%, the slump values are 238 mm (Fig. 2b), 207 mm (Fig. 2c), and 127 mm (Fig. 2d), respectively. The soil with 10% and 20% fines contents has a large slump value and exhibits a loose state due to weak interlocking among coarse particles. The soil with 40% fines content exhibits a low slump value and a cohesive state. This cohesiveness can cause consolidation within the cutterhead, thus forming a mud cake. Without conditioning, the slump values for these soils with 60% and 80% fines contents are 76 mm (Fig. 2e) and 47 mm (Fig. 2f), respectively. The soil exhibits a stiff state, with fine particles closely interlocked. This interlocking facilitates mud cake formation on the cutterhead during construction.
Fig. 2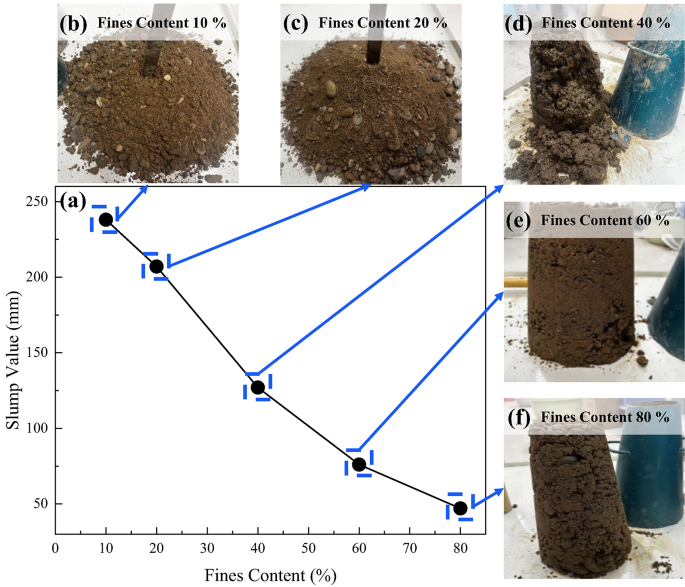
Slump values for unconditioned sandy pebble soil with different fines contents and the corresponding state of soil after slump tests; (a) slump values; (b) 10% fines content; (c) 20% fines content; (d) 40% fines content; (e) 60% fines content; (f) 80% fines content.
Sandy pebble soils with fines contents of 10%, 20%, 40% 60%, and 80% were prepared to investigate the effects of fines content on the mechanism of conditioning by slurry and foam. Cu and Cc are listed in Table 1. Bentonite slurry was used to condition the soil with fines contents of 10%, 20%, and 40%, and foam was used to condition pebble soils with fines contents of 60% and 80%. This study used sodium-based bentonite, known for its superior physical and chemical properties and technological performance38,39,40.
Table 1 The Cu and Cc of experimental soil for slump tests.
Figure 3a shows the viscosity of bentonite slurries with varying Cs, measured with the Marsh funnel viscometer. Viscosity slightly increases from 23 s to 27 s, with Cs rising from 7.7% to 11.1%, and markedly increases from 27 s to 135 s, with Cs rising from 11.1% to 20%. Excessively high funnel viscosity hinders the injection of bentonite slurry into the strata and increases the risk of blockages in the additive pipelines. Conversely, extremely low funnel viscosity may fail to provide adequate cohesive strength for the conditioned soil. Table 2 lists SIR and Cs used in this study. These values ensured suitable injection properties.
Fig. 3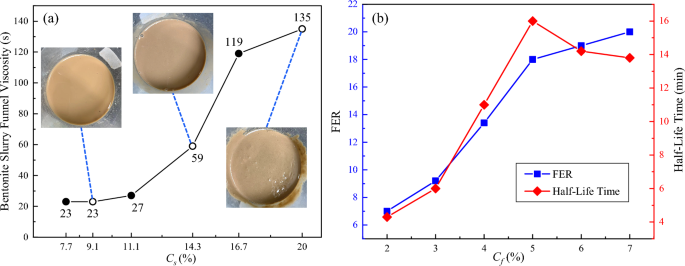
Physical properties of conditioning agents: (a) Funnel viscosity of bentonite slurry with different concentrations; (b) FER and HLT of foam with different concentrations.
Table 2 The SIR and Cs of bentonite slurry in slump tests.
Foam properties are typically assessed by two primary indicators: half-life time (HLT) and foaming expansion ratio (FER). The HLT is the duration required for the foam to decrease to half of its initial volume, whereas the FER is the ratio of the foam volume to the volume of the foaming solution. EFNARC41 recommends that foam used for soil conditioning should have an FER ranging from 5 to 30 and an HLT of more than 5 mins. For effective and economical foaming, the gas and liquid flow rates in the foam generator were set to 1.4 m3/h and 30 L/h, respectively.
The FER and HLT of foam were measured at different concentrations (Fig. 3b). As Cf increased from 2% to 5%, FER increased from 7 to 18, and HLT increased from 4.3 mins to 16 mins. However, as Cf increased from 5% to 7%, HLT decreased from 16 mins to 13 mins. The increase in FER also decreased slightly, rising only from 18 to 20. This finding suggests that increasing Cf does not necessarily optimize performance. The FIR and Cf used in the study are presented in Table 3
Table 3 The FIR and Cf of foam in slump tests.Slump value of bentonite-conditioned soil
The slump values for bentonite-conditioned pebble soil with fines contents of 10%, 20%, and 40% are shown in Figs. 4, 5 and 6. For the soil with 10% fines content and conditioned using bentonite slurry with Cs of 20% and 16.7%, the slump value gradually decreases from 238 mm to 146 mm and 167 mm, respectively. The higher slurry concentration leads to higher viscosity, forming a thick film on the surfaces of coarse particles (Fig. 4e). This film strengthens interparticle adhesion, causing the slump pattern to transition from divergent to plastic flow. Consequently, high SIR may not meet workability requirements.
Fig. 4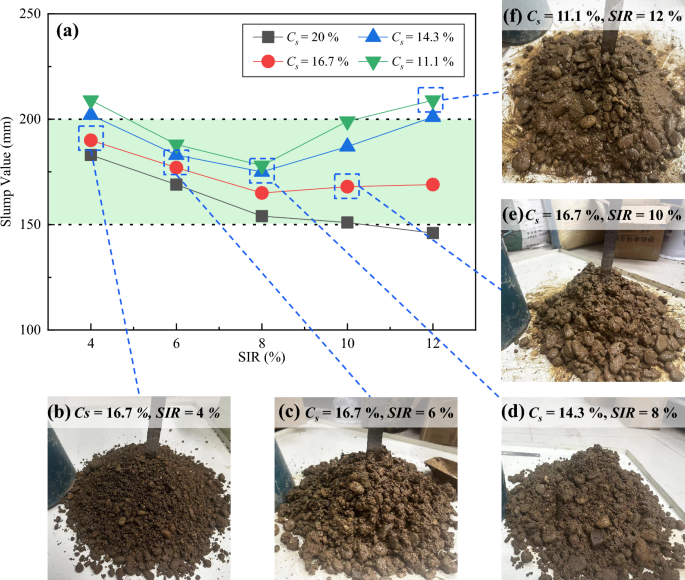
Slump values for bentonite-conditioned sandy pebble soil with 10% fines content and the corresponding state of soil after slump tests; (a) slump values; (b) Cs = 16.7%, SIR = 4% (c) Cs = 16.7%, SIR = 6%; (d) Cs = 14.3%, SIR = 8%; (e) Cs = 16.7%, SIR = 10%; (f) Cs = 11.1%, SIR = 12%.
Fig. 5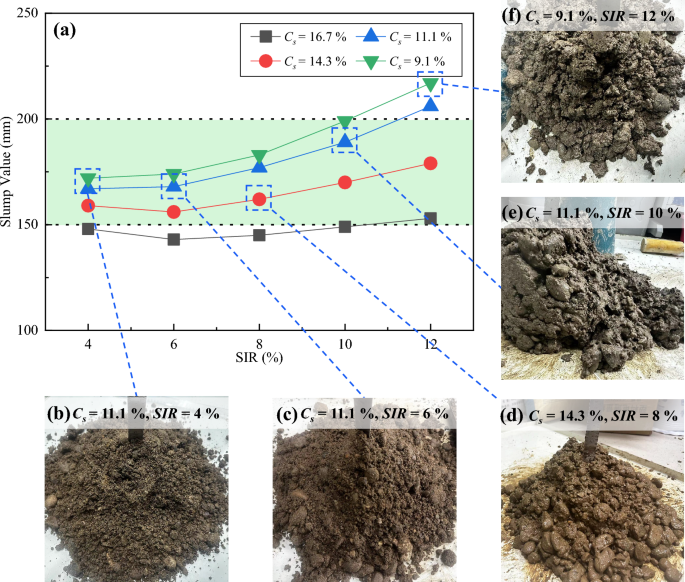
Slump values for bentonite-conditioned sandy pebble soil with 20% fines content and the corresponding state of soil after slump tests; (a) slump values; (b) Cs = 11.1%, SIR = 4% (c) Cs = 11.1%, SIR = 6%; (d) Cs = 14.3%, SIR = 8%; (e) Cs = 11.1%, SIR = 10%; (f) Cs = 9.1%, SIR = 12%.
Fig. 6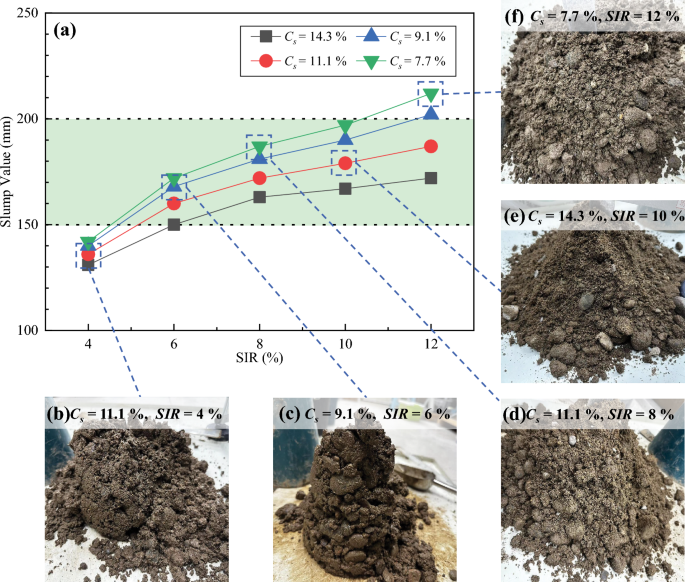
Slump value of bentonite-conditioned sandy pebble soil with 40% fines content and the corresponding state of soil after slump tests; (a) slump values; (b) Cs = 11.1%, SIR = 4% (c) Cs = 9.1%, SIR = 6%; (d) Cs = 11.1%, SIR = 8%; (e) Cs = 14.3%, SIR = 10%; (f) Cs = 7.7%, SIR = 12%.
The slump value decreases to approximately 170 mm (Fig. 4d) and then increases to more than 200 mm as SIR rises from 8 to 12% for the soil with 10% fines content (Fig. 4f). The slurry provides sufficient clay particles to coat the coarse particles of the soil with 10% fines content, leading to improved cohesion between the particles and a stiffer state (Fig. 4c). This tendency is the same for the soil with 20% fines content, but the inflection point is at the SIR of 4% (Fig. 5c). The soil with 20% fines content needs less slurry to adhere to the sand particles. As the viscosity of the slurry exhibits nonlinear growth with increasing SIR, optimal slump values of 172 mm (Fig. 5b) and 167 mm (Fig. 5c) are achieved with slurry Cs of 11.1% and 14.3% respectively. Further increases in the SIR to 12% lead to a gradual rise in slump value to 209 mm (Fig. 5d) for the slurry with Cs of 9.1% and around 150 mm (Fig. 5e) for the slurry with Cs of 16.7%. This divergence is attributed to the bentonite slurry providing a large amount of free water, which reduces interparticle interlocking between particles and enhances fluidity, consequently improving workability (Fig. 5d). Bentonite slurry with high Cs is less suitable for sandy pebble soil with finer particles as excessive viscosity can hinder soil fluidity (Fig. 5f).
For soil with 40% fines content, the slump value increases linearly with SIR up to 12%. Regard to the SIR of 4%, the slump value is always less than 150 mm (Fig. 6b). As SIR rises, the soil surface is saturated with the water in the slurry, and the additional clay particles provide lubrication. This occurrence leads to the divergence of the coarse and fine particles (Fig. 6f). This separation enhances fluidity, thus improving its workability. The slump value of soil conditioned with a low Cs of 7.7% increases significantly to 212 mm (Fig. 6d). This occurrence causes the formation of a thinner hydration film with less free water to effectively reduce interparticle friction. The slump value of soil conditioned with a Cs of 14.3% increased to 172 mm (Fig. 6e). High viscosity causes clay particles to adhere to each other, leading to a slow increase in slump value. Various optimizing conditioning alternatives can be employed with SIR ranging from 6% to 12% and Cs between 7.7% and 20% to achieve a slump value between 150 mm and 200 mm (Fig. 6c). Notably, soils with an increase in fines content can be conditioned by increasing SIR and decreasing viscosity. With this approach, the free water content and the concentration of cohesive clay particles are adjusted, which improves fluidity, thus enhancing workability.
Slump value of foam-conditioned soil
The slump values of foam-conditioned soil with 60% and 80% fines contents are shown in Figs. 7 and 8. The Cf significantly influences the conditioning effect in soil with 60% fines content. As FIR increases to 80%, the slump value of soil conditioned by soil with Cf of 6% increases to 218 mm (Fig. 7f), whereas that of soil conditioned by foam with Cf of 3% only rises to 156 mm. Foam with increased concentration enhances water adsorption capacity14. Macroscopically, the space once occupied by foam is filled with soil particles, owing to the loss of the original lubricating layer. This phenomenon results in increased direct contact among soil particles, leading to a higher internal friction angle and a significant decrease in the slump value42.
Fig. 7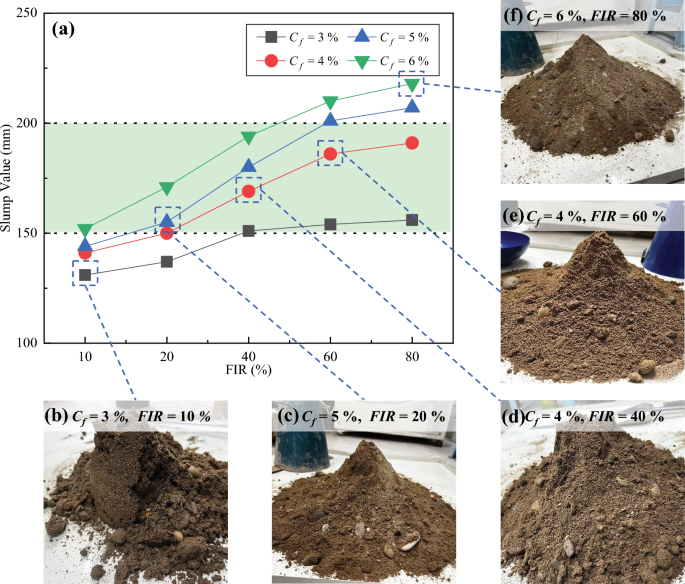
Slump value of foam-conditioned sandy pebble soil with 60% fines contentand the corresponding state of soil after slump tests; (a) slump values; (b) Cf = 3%, FIR = 10% (c) Cf = 5%, FIR = 20%; (d) Cf = 4%, FIR = 40%; (e) Cf = 4%, FIR = 60%; (f) Cf = 6%, FIR = 80%.
Fig. 8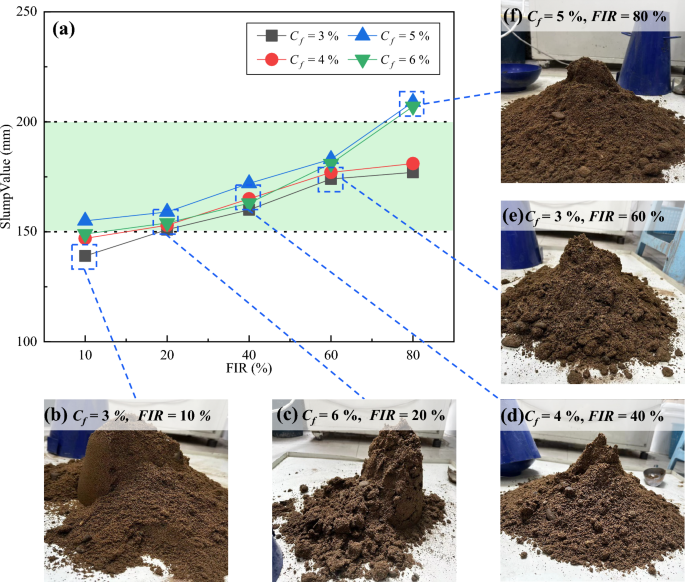
Slump value of foam-conditioned sandy pebble soil with 80% fines content and the corresponding state of soil after slump tests; (a) slump values; (b) Cf = 3%, FIR = 10% (c) Cf = 6%, FIR = 20%; (d) Cf = 4%, FIR = 40%; (e) Cf = 3%, FIR = 60%; (f) Cf = 5%, FIR = 80%.
However, when conditioning soil with 80% fines content, the pores between soil particles are too small for the foam to penetrate, leading to a negligible effect of Cf on the slump value at FIRs below 60%. As FIR rises to 80%, the slump value increases to 177 mm and 181 mm with Cf of 3% and 4%, respectively, but markedly increases to 209 mm and 207 mm with Cf of 5% and 6% (Fig. 8f). More free water from the agent enlarges the pores, allowing for enhanced foam penetration and a more pronounced effect of Cf on slump value.
Prediction of slump value by machine learning
During construction, conducting numerous slump tests to determine soil conditioning strategies is inefficient because of the complex geological conditions. With unique advantages in capturing complex nonlinear relationships of data, deep learning models are widely used in complex physical property prediction43,44. The slump values for all soils exhibit a nonlinear relationship with increasing injection ratio and concentration, regardless of the soil conditioning agent (bentonite slurry or foam). Therefore, a deep learning algorithm in RapidMiner can be used to predict the slump value of the conditioned soil. The input variables are processed by constructing a multilayer feedforward artificial neural network (Fig. 9). Training and optimization of the existing data were performed after the model was established.
Fig. 9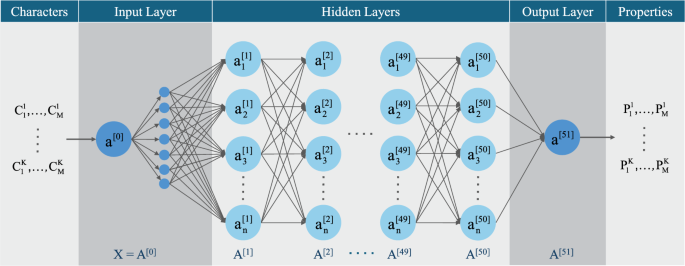
Neurons and hidden layers in neural networks established using a deep learning algorithm.
The steps involved in using a deep learning algorithm for machine learning are presented in Fig. 10.
Fig. 10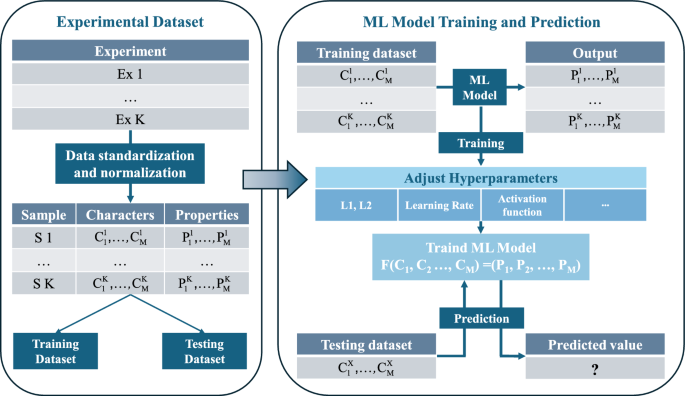
Implementation of deep learning algorithm in RapidMiner for machine learning.
Step I. Preprocessing of data on 72 groups of slump values for bentonite-conditioned soil and 48 groups of slump values for foam-conditioned soil through data cleaning, standardization, and normalization.
Step II. Dividing datasets into training and testing sets to verify the prediction results. The 72 groups of slump values for bentonite-conditioned soil were divided into 66 groups for training and 6 groups for testing. The slump values for foam-conditioned sandy pebble soil were divided into 44 groups for training and 4 groups for testing.
Step III. Application of a deep learning algorithm to develop a regression model and optimize its critical hyperparameters—L1, L2, number of hidden layers, and learning rate—to improve accuracy. L1 regularization filters the key features in the data by imposing weight constraints to reduce the interference of redundant information; L2 regularization limits the size of parameters to control the complexity of the model by punishing the Euclidean norm of the weight matrix. The synergy of the two can alleviate the overfitting problem. The number of hidden layers is determined by gradually adding and deleting strategy, and the optimal solution of model representation ability is sought in the balance between training error and verification error: too few hidden layers may lead to insufficient capture of nonlinear relationships, and too many hidden layers may easily lead to waste of computing resources and gradient anomalies. The dynamic attenuation mechanism is used to optimize the learning rate. In the initial stage, a large step size is set to accelerate the convergence, and in the later stage, the adjustment accuracy is gradually refined to avoid the oscillation of the loss function in the local optimal region. Using a rectifier activation function introduces nonlinearity, enhancing the nonlinear fitting ability of neural networks to learn complex patterns in data.
Step IV. Comparison of the predicted slump values with the validated values after an improved model is determined. The accuracy can be used to evaluate the effectiveness of prediction.
Table 4 and Fig. 11 present the predicted and verified slump values after the training dataset is input into the model. When testing the accuracy of the model, two groups were randomly selected from the experimental data of each fines content as the test set. The predicted values of each fine particle content are predicted value A and predicted value B, and the verification values are verification value A and verification value B respectively. The maximum accuracy between the predicted value and the verified value is 99.97%, whereas the minimum accuracy is 95.23%. And the R2 of two models were 0.9599 and 0.9702, respectively. The slump value of conditioned soil was predicted accurately, reducing the test workload and improving efficiency. In subsequent research, additional parameters may be incorporated based on other soil properties to enhance the accuracy of prediction.
Table 4 Predicted slump values and forecast accuracy.Fig. 11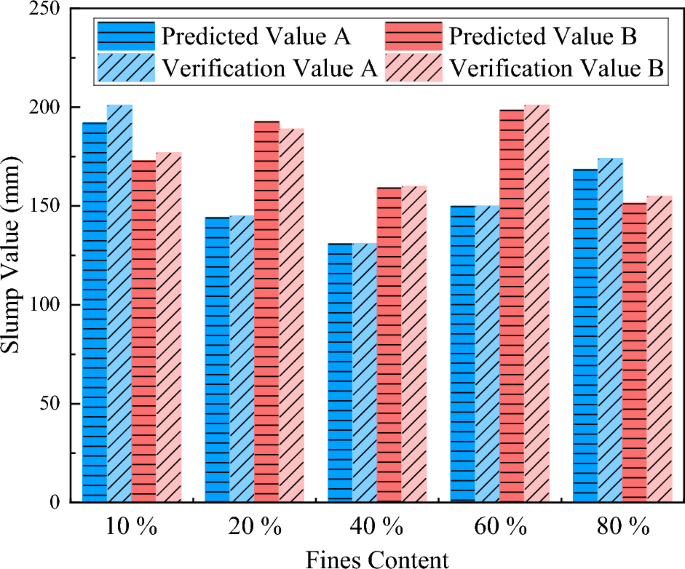
Predicted and verified slump values.