
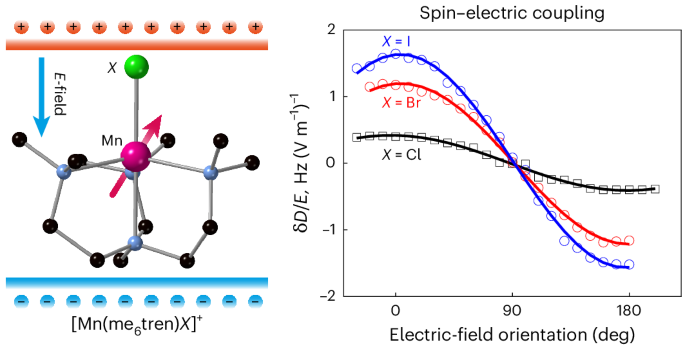
The Mn(Me6tren)X compounds
The crystallographic structure of Cl derivative 1 is the same as that reported for its Ni(II) and Co(II) counterparts27,28,29. None of the reported Br derivatives with any metal ion crystallize in a trigonal space group. We thus prepared a new compound with Br in the axial position and [PF6]− as the counter anion that turned out to crystallize in a trigonal space group. For the I derivative, despite trying several counter anions, they all crystallized in a cubic space group. We therefore prepared the Mn complex based on the reported Zn(II) one, which crystallizes in a cubic space group (Supplementary Tables 1 and 2)30. Mn(II) is pentacoordinate, surrounded by one axial (N1) and three equatorial (N2) nitrogen atoms belonging to the tetradentate me6tren ligand, and one halogen (X). Its coordination sphere has a trigonal bipyramidal (tbp) geometry of C3 point group symmetry, with the three-fold axis along the N1–Mn–X direction (Fig. 1a and Supplementary Fig. 1). The Mn–N1 and Mn–N2 bond lengths and the N1MnN2 angles differ by less than 1% for the three complexes (Supplementary Table 3). The main difference is the Mn–X distance: 2.3458(3) Å, 2.5026(18) Å and 2.7133(6) Å, for X = Cl, Br and I, respectively. 1 and 2 crystallize in the R3c and the R3m trigonal space group, with the C3 molecular axis along the crystal c axis and all the N1–Mn–X bonds aligned. 3 crystallizes in the cubic P213 space group with the C3 molecular axes along the cubic unit cell diagonal. For each compound, we used the corresponding isostructural diamagnetic Zn(II)-containing compounds to provide a diamagnetic host crystal with dilute Mn(II)-complex impurities (Supplementary Sections I and II).
Fig. 1: ESR spectra and spin relaxation measurements for 1 and 2.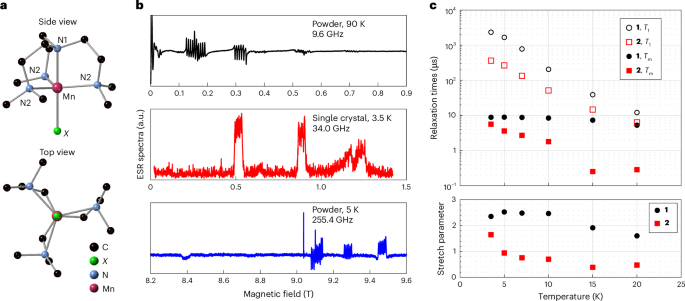
a, Ball-and-stick representation of the [Mn(me6tren)X] molecules. H atoms are omitted for clarity. b, Representative low-temperature ESR spectra for 1 recorded with different sample forms at different frequencies. The single-crystal spectrum (middle) was recorded at the Q-band using an echo-detected field sweep (EDFS), whereas the ESR experiments for the powder sample (top and bottom) were conducted using the continuous-wave method. c, Low-temperature relaxation times for 1 and 2 molecules measured on the −5/2 ↔ −3/2 and +3/2 ↔ +5/2 transitions, respectively. Upper panel: the spin–lattice relaxation time, T1, and quantum phase memory time, Tm, for 1 and 2 as a function of temperature. T1 is described by a single exponential decay over the experimental temperature range. Lower panel: in contrast, Tm follows a stretched exponential, whose stretch parameter varies with temperature.
We characterized the magnetic properties using electron spin resonance (ESR) at three frequencies. Representative data for 1 are shown in Fig. 1b (Supplementary Fig. 2 presents more data). The results can be described by an electron spin S = 5/2 and a nuclear spin I = 5/2 under the Hamiltonian
$${\hat{H}}={D{\hat{S}}_{z}^{2}+{\mu }_{\rm{B}}g{{\bf{B}}}_{0}\cdot \hat{{\bf{S}}}+A\hat{{\bf{I}}}\cdot \hat{{\bf{S}}}}$$
(1)
where B0 is the applied magnetic field, g and A are the isotropic g-factor and hyperfine coupling, respectively, and D is the axial ZFS parameter. No evidence of a transverse anisotropy was observed for any of the three compounds, consistent with the three-fold rotational symmetry of the molecules. D exhibits a systematic trend through the series, with 1 possessing easy-axis-type anisotropy (D < 0) and 2 and 3 exhibiting easy-plane-type anisotropy (D > 0). By contrast, the hyperfine coupling is almost identical across the family (Table 1).
Table 1 Spin Hamiltonian parameters
We measured low-temperature spin relaxation times for 1 and 2 using magnetically diluted single crystals [Mn0.001Zn0.999(me6tren)X]Y (for 3, see Supplementary Figs. 3, 4 and 8). The results are shown in Fig. 1 (Supplementary Fig. 4 presents representative relaxation data). The spin lattice relaxation time T1 for both molecules increases monotonically as the temperature falls, showing no sign of saturation down to our base temperature. At 3.5 K, T1 for 1 (2.3 ms) is approximately six times that for 2 (0.36 ms). Such a difference in T1 is probably due to the difference between the Mn–Cl (2.3458(3) Å) and Mn–Br (2.5026(18) Å) bond lengths: the longer Mn–Br distance leads to a weaker bond and lower energy vibrational modes, leading to faster spin–lattice relaxation rates at all temperatures that we studied. This is also consistent with the difference in the ESR spectra for 1 and 2: although the hyperfine structure of 1 is clearly resolved for all transitions (Supplementary Fig. 2a,e), we could only distinguish it for the ms = ±1/2 transition in 2 (Fig. 2b and Supplementary Fig. 2b), indicating the presence of a substantial D strain.
Fig. 2: SEC in Mn triangle molecules.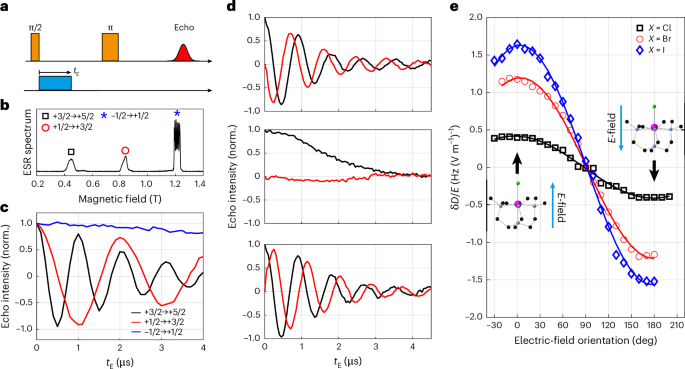
a, The microwave and E-field pulse sequence measuring SEC in single crystals. b, The Q-band EDFS spectrum for 2 recorded at 3.5 K. c, The in-phase spin echo signals for different ms transitions as a function of tE recorded on 2. The data were recorded with both B0 and the pulsed electric field parallel to the Mn–Br bond. d, The in-phase (black) and quadrature (red) echo signals for the +3/2 to +5/2 transition in MnBr with the electric field applied parallel (top), perpendicular (middle) and antiparallel (bottom) to the Mn–Br direction. Note that the polarity of the quadrature signal is reversed for the top and bottom data, consistent with a linear SEC. e, Orientation dependence of the E-field-induced shift in the ZFS parameter D (errors are smaller than the symbol sizes).
The phase coherence times (Tm) for 1 and 2 are described by a stretched exponential decay with a temperature-dependent stretch parameter, indicating an interplay between multiple decoherence mechanisms31. At 3.5 K, both compounds show similar Tm values, with their stretched parameters close to 2, suggesting that the decoherence is dominated by the nuclear spin bath surrounding Mn spins. On raising the temperature, the coherence of 2 decreases rapidly, with the stretch parameter dropping below 1 at 5 K. By comparison, both Tm and the stretch parameter for 1 remain almost temperature-independent up to 10 K (Supplementary Table 4 provides more details).
The average Mn–Mn distance in our 0.1% diluted crystals is less than 8 nm, so electron spin–spin dipolar interactions are of the order of ~1 MHz. The difference in the temperature dependences of Tm is probably related to the short T1 associated with 2 (Fig. 1c): T1 relaxation in 2 leads to magnetic fluctuations in the local environment, inducing contributions to the phase decoherence. Above 10 K, both the Tm and the stretch parameter for 1 start to decrease rapidly with increasing temperature, suggesting that the nuclear spin bath is no longer the dominant decoherence source.
SECs
We measured SECs for all three molecules by embedding a square d.c. E-field pulse into a Hahn-echo sequence (Fig. 2a and Supplementary Fig. 5). We recorded the spin echo signal as a function of the duration/amplitude of the E-field pulse22,32 (more details are provided in Supplementary Figs. 6–8). Representative data (recorded on 2) are shown in Fig. 2. The echo signals for the inter-Kramers transitions exhibit clear oscillations as a function of the duration of the E-field pulse (tE), with the oscillation frequency for the +5/2 ↔ +3/2 signal almost exactly double that for the +3/2 ↔ +1/2 signal. The E-field-induced change in the spin transition frequency, δfE, is calculated by a fast Fourier transform of the oscillating echo signal. By comparison, the −1/2 ↔ +1/2 transition shows only a weak SEC coupling. Measuring on different hyperfine peaks yields the same weak SEC.
When the magnetic field B0 is parallel to the magnetic anisotropy axis, the transition within the ±1/2 doublet depends only on g and A, whereas the inter-Kramers transitions also depend on the ZFS parameter D. Hence, the lack of E-field dependence for the ±1/2 transition suggests both A and g show negligible SEC, and the oscillations observed with the inter-Kramers transitions are, therefore, attributable to the E-field modulation of the anisotropy parameter D. This is further supported by the fact that the ZFS for the +5/2 ↔ +3/2 transition, 4D, is exactly twice that for the +3/2 ↔ +1/2 transition, 2D. Accordingly, an E-field-induced modification in D, δD, lead to oscillation in the +5/2 → +3/2 echo at frequency 4δD, double that for the +3/2 → +1/2 echo, 2δD.
Both 1 and 2 crystallize in a polar space group with all molecules co-aligned. Consequently, all molecules should exhibit the same linear response upon application of an external E-field, allowing us to measure both the amplitude and sign of δfE. (The sign of δfE is inaccessible for random orientated samples, such as frozen solutions32 or single crystals with inversion-related molecules22.) The in-phase and quadrature parts of the echo signal should follow cos(2πδfEtE) and sin (2πδfEtE), respectively, where the sign of δfE is determined by the polarity of the quadrature component, as illustrated in Fig. 2d (more details are provided in Supplementary Figs. 6–8). When the orientation of the electric field is rotated from the Mn–Br (top) to the Br–Mn (bottom) direction, the quadrature part of the signal is inverted, whereas the in-phase part remains virtually identical, as expected for a linear SEC.
The full orientation dependence of the SECs is mapped by rotating the E-field against the crystals. We present the E-field-induced changes in D for all three molecules for direct comparison (Fig. 2e). For all molecules the maximum SECs occur with the applied electric field parallel or antiparallel to the Mn–X bond, with a near-complete extinction of the effect for the perpendicular orientation. This highlights the importance of the molecular electric dipole: an E-field is coupled to the molecular spin via its electric dipole. Hence, even though the triangular plane perpendicular to the Mn–X bond also does not possess an inversion symmetry, allowing first-order SEC6,33,34 by symmetry, an E-field applied in this plane cannot couple to the spin efficiently due to the lack of an electric dipole in this orientation.
The observed E-field-induced frequency shifts (~4.8 Hz (V m−1)−1 for 2) are substantial, especially considering that Mn(II) ions are typically associated with a weak spin–orbit interaction due to their half-filled 3d5 outer shell. The coupling to the spin spectrum (δfE/E) is much stronger than that for molecular magnets containing Mn(II) (~0.68 Hz (V m−1)−1)24 and comparable with the shift for a lanthanide-based molecule (~11 Hz (V m−1)−1) with giant SOC22. The E-field effect on the ZFS parameter, δD/E = 1.7 Hz (V m−1)−1 for 3, is also comparable to those found for Mn2+ spins doped in inorganic crystals: 1.26, 2.25, 1.33 and 3.3 Hz (V m−1)−1 for CaWO4 (ref. 35), SrWO4 (ref. 36), PbMoO4 (ref. 37) and ZnO (ref. 26), respectively. For the scheelite lattices35,36,37, the SEC is largely attributed to the displacement of the spin-carrying ion in the applied electric field. In ZnO (ref. 26), the SEC is associated with the piezoelectric nature of the host lattice, allowing a substantial E-field-induced distortion of the lattice geometry. These previous works are consistent with our findings: a strong SEC is probably due to the substantial molecular electric dipole and the fact that it is directly correlated to the molecular magnetic anisotropy. An E-field distorts the geometry of the molecule, modulating the ZFS of the Mn2+ spins.
The SECs for the complexes could be adequate for practical spin control with an E-field generated by sufficiently localized electrodes. For example, with a d.c. E-field of 107 V m−1, that is, 10 mV nm−1, the resonance frequency of 3 can be shifted by ~68 MHz, corresponding to the excitation bandwidth of a 15-ns microwave pulse. A high-frequency resonance a.c. E-field of the same amplitude can drive coherent spin transitions with the Rabi rate of ~15 MHz and ~1.7 MHz for standard δms = 1 and double δms = 2 transitions, respectively (applying B0 perpendicular to the anisotropy axis), potentially allowing hundreds of coherent E-field-driven spin operations within Tm. E-fields on this scale are routinely accessible in reported molecular break-junction devices7,38 and scanning tunnelling microscopy experiments11.
Despite the fact that D < 0 for X = Cl and D > 0 for X = Br and I, we note that δD < 0 for all three compounds when an electric field is applied pointing from the X halogen ion towards Mn2+ (Supplementary Table 5). Such behaviour showcases the possibility of controlling magnetic anisotropy and SEC independently, allowing the design of molecular magnets with strong SEC while maintaining operability within the microwave frequency range convenient for (quantum) information technologies. This can be understood qualitatively by considering the origin of the magnetic anisotropy and the symmetry of their electronic states (see next section).
Electronic structure calculations
We performed wavefunction-based ab initio calculations to understand the origin of D and its interaction with an external E-field10,39,40,41. The ZFS parameters for all molecules (without external E-field) were calculated using two geometries: the X-ray structures and the molecular geometries optimized in density functional theory (DFT) while preserving C3 symmetry. Both calculations reproduce the trend of D observed in ESR measurements; that is, the ZFS shifts from easy-axis type (D < 0) to easy-plane type (D > 0) as the halogen atom varies from Cl to I. Here we focus on results obtained using the DFT-optimized geometry, as this allows us to investigate the E-field-induced distortions to the geometry of the molecules.
Detailed analysis was performed with 1 and 3 to rationalize the origin of the ZFS. For a high-spin Mn(II) (S = 5/2) ground state, all five d orbitals are singly occupied, leading to a sextuplet ground state 6A. Therefore, the ZFS can only emerge due to interactions between the electronic ground state and the excited quadruplet states, 4Yi, via SOCs. It is worth noting that the spin–spin contribution to D (ref. 42), which is considered in the calculations, is very small.
For analysis purposes, we can consider the second-order perturbation expression of the SOC contributions. The SOC interaction between the ground electronic state \({{| }^{6}{A}_{{m}_{\rm{s}}}\left.\right\rangle}\) with the spin projection ms and the msl component in an excited electronic state 4Yi leads to a contribution to D of the ground state, \({c(D)[{4\atop}{Y}_{{m}_{\rm{sl}}}^{\,i}]}\):
$${c(D)\left[{4\atop}{Y}_{{m}_{\rm{sl}}}^{i}\right]}={\sum _{k}\frac{\left| \left\langle {6\atop}{A}_{{m}_{\rm{s}}}| {\zeta }_{k}\left[\left({\hat{L}}_{k}^{+}{\hat{S}}_{k}^{-}+{\hat{L}}_{k}^{-}{\hat{S}}_{k}^{+}\right)/2+{\hat{L}}_{k}^{z}{\hat{S}}_{k}^{z}\right]| {4\atop}{Y}_{{m}_{\rm{sl}}}^{\,i}\right\rangle \right| ^{2}}{{\mathcal{E}}\left({4\atop}{Y}^{i}\right)}}$$
(2)
where the sum runs over all electrons k of the d shell. \({\mathcal E} ({4\atop}{Y}^{\,i})\) is the energy of the 4Yi excited state with respect to the ground state and ζk is the SOC constant, which depends on the two orbitals involved in the excitation. By summing over the ms and msl components of both the ground and excited states, one obtains the full contribution C(D) of each excited state. The sum of the contributions of all 4Yi excited states, ∑C(D), leads to the ZFS. Ab initio calculations show that the main contributions to D arise from the ten excited quadruplet states. Among them, four doubly degenerate states Ei (i = 1 to 4) that couple to the ground state through the \(({\hat{L}}_{k}^{+}{\hat{S}}_{k}^{-}+{\hat{L}}_{k}^{-}{\hat{S}}_{k}^{+})/{2}\) term lead to negative contributions to D, and the two non-degenerate states Ai (i = 1 or 2) that couple to the ground state through \({\hat{L}}_{k}^{\,z}{\hat{S}}_{k}^{\,z}\) lead to positive contributions to D (ref. 43).
The excitation energies are driven by the ligand field and follow the halogen spectrochemical series (Supplementary Fig. 9 and Supplementary Section V.A). However, although for many series of complexes the excitation energies govern the magnitude and nature of D, here the variation of the SOCs plays the most important role. Indeed, one may notice that the increase or decrease in the contributions to D of an excited state is directly correlated with the decrease or increase of the SOCs (Supplementary Table 6). The variation in SOCs can have two origins: either the coefficient on the 4Y state determinants involved in the coupling varies between 1 and 3, or the spin–orbit constants ζk vary. In the present case, both variations need to be considered. However, the dominant effect concerns the spin–orbit constants. Indeed, for an excitation involving an orbital with a z component (that is pointing towards the halogen), the constant ζk is weaker for the iodine-containing complex than for the chlorine-containing one due to the relativistic nephelauxetic effect, inducing weaker couplings and therefore lower negative contributions. Concerning the A2 state, it is essentially carried by the two excitations from dxy to \({d}_{({x}^{2}-{y}^{2})}\) (Supplementary Table 7) and vice versa, and the weight on these two configurations (Supplementary Table 8) is larger in 3 than in 1, inducing a stronger coupling and therefore a larger positive contribution. To summarize, the negative contributions to D due to the quadruplet Ei states decrease from 1 to 3, whereas the positive contributions brought by the Ai states increase, resulting in an overall ZFS shifting from easy-axis to easy-plane type, as experimentally observed.
The application of an E-field modifies both the electronic structure and the geometry of the molecules, thus changing D. To appreciate the spin–electric effect due to each contribution individually, we calculated D using the following three cases: (1) an E-field only modifies the electronic structure, with the molecular geometry unperturbed; (2) an E-field distorts the geometry of the molecule, leading to a new structure (optimized using DFT in the presence of the E-field) with which D is calculated; (3) D is calculated using the new geometry in the presence of an E-field affecting the electronic structure. To reduce relative digital errors in the ab initio calculation, a strong electric field is used (~109 V m−1), substantially larger than those applied in experiments (~105 V m−1). Nevertheless, the calculations produce a linear E-field dependence of D (Fig. 3a), allowing us to draw a direct comparison between calculations and experiments.
Fig. 3: Theoretical calculations for 3.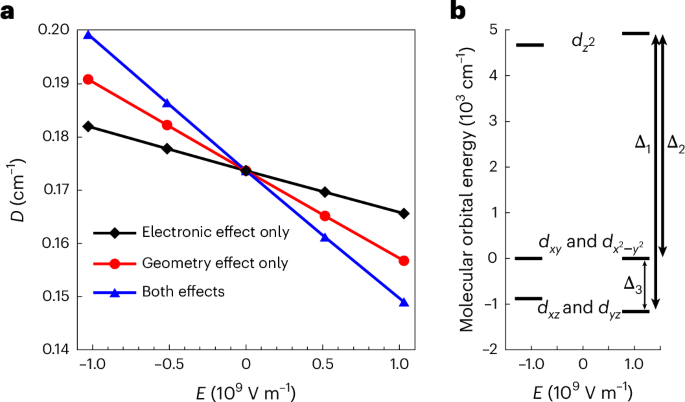
a, Theoretical calculation for 3 showing a linear SEC. A positive E corresponds to an E-field applied from I− to Mn2+. The calculations were performed with three cases as described in the main text. b, Molecular orbital energy diagram for 3 with the application of an E-field.
Representative results for 3 are shown in Fig. 3 (Supplementary Fig. 10 presents results for 1 and 2). When an E-field is applied pointing from the halogen ion towards the Mn(II) ion, it distorts the molecular geometry such that the Mn–X distance increases (Supplementary Table 9) while the Mn–N bond length decreases. This changes the electronic structure of the molecule such that all energy differences between the orbitals increase, as shown in Fig. 3b. Note that this increase is larger in the iodine-containing complex than in the chlorine one due to the larger polarizable character of iodine; that is, a stronger deformation of the electronic cloud induces a larger geometric distortion of the molecule. More importantly and as explained in the Supplementary Information (Supplementary Tables 10–13), the application of an E-field varies the SOCs, leading to a weaker D > 0 contribution by the Ai states and a stronger D < 0 contribution by the Ei states. These two modulations combine constructively and give rise to the overall E-field-induced modulation of D.
The results are summarized in Table 1. The calculations successfully reproduce the trend observed in experiments, with increasing effects when the halogen is changed from Cl to I. The variations in dipole moment also follow the expected trends (Δμe = 2.063 D, 2.194 D and 2.465 D for 1, 2 and 3, respectively; Supplementary Table 14); that is, a positive (negative) E-field increases (decreases) the dipole moment. As the geometric distortions follow the displacements of the electron cloud, the two effects in cases (1) and (2) add up almost perfectly (Supplementary Table 14). The comparison of the dipole moments in the spectrochemical series also shows that the E-field-induced effect is stronger for 3 than that for 1, as I− is more polarizable than Cl−, so applying an E-field leads to a larger distortion in 3 and a stronger modulation of D, despite the SOC constant being stronger for 1.
To check that the effect of the electric field on the crystallographic structures follows the same trend as on the optimized ones, we performed the same analysis (case (1)) on the experimental structures of 1 and 3 (Supplementary Tables 15 and 16) and found the same results: the variation of the contributions to D follows the variations of the SOCs and can therefore be attributed to changes in the ground- and excited-state wavefunctions. Overall, we can conclude that the structural distortions follow the field-induced deformations of the electron cloud and are therefore stronger for 3 than for 1, as I− is more polarizable than Cl−. Crucially, our analysis reveals that the distortions to the molecular geometry play the major role for all three molecules22.
Finally, we note that, compared to the optimized structures used in the calculation, which are obtained considering single molecules in vacuum, the actual crystal structure contains counterions that can lead to larger distortions. Therefore, it is conceivable that the calculations underestimate the electric-field effect. Nevertheless, the theoretical results are in reasonable agreement with the experimental data.