
Plant materials and growth conditions
The 320 previously sequenced accessions16 utilized for GWAS, and an F2 population (n = 280) and its progenies utilized for fine mapping, were grown under natural conditions from 2018 to 2021 in Guangzhou (113°23′E, 23°16′N; July to October) or Sanya (108°56′E, 18°09′N; November to March) to evaluate 100-seed weight. Each row was 1.5 m long with 0.5 m spacing between rows, and a plant spacing of 0.1 m.
NILs for the locus SW14 were selected from F6 generation of the cross Yunchun 2014× Huachun 8 using a molecular marker for SW14. The NILs, CRISPR/Cas9 knockout mutants, and transgenic plants used for phenotyping were planted under natural conditions from 2021 to 2024 in Sanya, Guangzhou, and Beijing (116°23′E, 39°54′N; May to October) as indicated in the text. For the field trials, the indicated lines were grown in a randomized complete block design with three replications for each field environment. In Sanya and Guangzhou, each row was 1.5 m long with 0.5 m spacing between rows, and a plant spacing of 0.1 m. In Beijing, each row was 3.0 m long with 0.5 m spacing between rows, and a plant spacing of 0.3 m. At the R8 stage, agronomic traits including plant height, node number, and branch number were measured. Seed traits were determined using uniform dry seeds after harvest.
To assess the effect of nature variations in SW14 on yield, a randomized complete block design with three replicates was implemented in Guangzhou and Xiangyang (110°45′E, 31°14′N; May to October). Field plots were arranged in 2 m long rows with 0.5 m spacing between each row, covering a total plot area of 5.0 m2. A plant density of 120,000 plants per hectare was maintained, and grain yield per plot was measured and calculated after harvest.
Arabidopsis plants used in this study are in the Col-0 background and grown at 22 °C under long-day conditions (16 h light/8 h dark photoperiod).
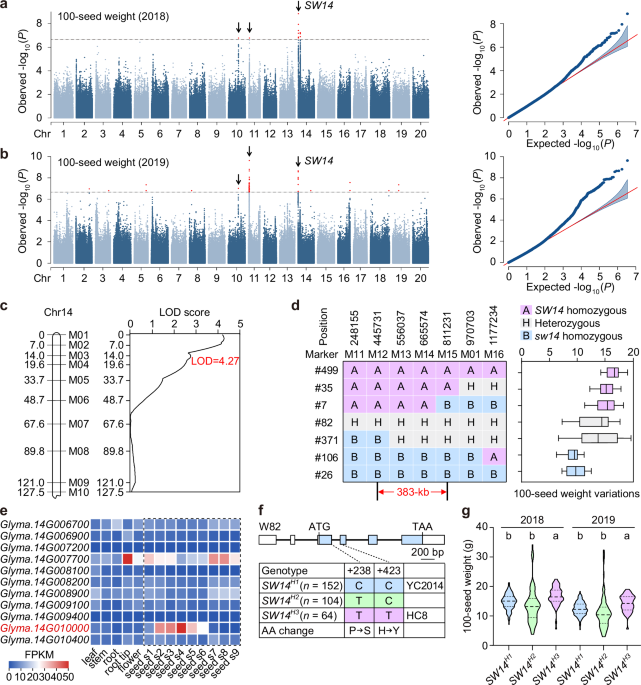
GWAS for the 100-seed weight
A total of 3,455,323 high-quality SNPs (MAF > 0.05) were used for GWAS assay in 320 accessions. Association analyses were performed by MLM implemented in efficient mixed model association expedited (EMMAX) software40. Kinship was derived from all these SNPs. The significant association threshold was determined by Bonferroni correction as 1/n (n, total SNP number), based on a previous report24. The significant association regions were manually verified from resequencing reads aligned against the Williams 82 (W82) genome with SAMtools41.
QTL analysis
Genomic DNA was extracted from leaves using the SurePlant DNA Kit (CWBIO, CW2298M) and used for indel marker amplification. Linkage map construction was carried out according to a previous report16, and the QTL analysis performed using MapQTL V5.0 software. Primer sequences of the markers for mapping are listed in Supplementary Data 1.
Multiple alignment analysis
Homologous SW14 protein sequences were downloaded from Phytozome (https://phytozome-next.jgi.doe.gov/). Amino acid sequences were aligned using the Jalview V2.11.1 with manually adjustments.
Plasmid construction and plant transformation
The coding sequence of GmLEC1a was amplified from W82 cDNA and inserted into the XbaI/BamHI restriction sites of pTF101 vector to generate the overexpression construct. To generate sw14 and Gmlec1 mutants, multiple sgRNAs targeting different positions of the candidate genes were designed using the CRISPR direct website (http://crispr.dbcls.jp/)42. Primers used are listed in Supplementary Data 1. All constructs were introduced into the Agrobacterium tumefaciens strain EHA101, and separately transformed into W82 or TL1 (all carrying SW14H1) via the cotyledon-node method43.
To overexpress different SW14 haplotypes in Arabidopsis, N. benthamiana leaves, and soybean hairy roots, the coding sequences of SW14H1 and SW14H3 were inserted into the pCAMBIA1350 vector. Primers used are listed in Supplementary Data 1. The floral dip method was used to generate the transgenic plants, and positive transgenic plants were selected on MS medium supplemented with hygromycin. Transgenic hairy roots were generated through Agrobacterium rhizogenes-mediated transformation44.
RNA in situ hybridization
RNA in situ hybridization was performed following a previously described protocol45. Briefly, seeds were fixed in RNase-free solution containing 5% acetic acid, 50% ethanol, and 3.7% formaldehyde at 4 °C. A 153-bp fragment specific to the SW14 cDNA was amplified with gene-specific primers containing T7 and SP6 RNA polymerase binding sites and integrated into the pSPT18 T-Easy vector (Roche, 11175025910). Primers used are listed in Supplementary Data 1. The digoxigenin-labeled antisense or sense probes were transcribed and labeled using a DIG RNA Labeling kit (Roche, 11175025910) according to the manufacturer’s protocol. Images were captured under a Leica stereomicroscope (DVM6).
Subcellular localization
To investigate the subcellular localization of different SW14 haplotypes, the coding region of SW14H1 was inserted into the PstI restriction site of the pGreen-35S: GFP vector to fuse in-frame with GFP. Primers used are listed in Supplementary Data 1. The above constructs were introduced into Arabidopsis mesophyll protoplasts. Fluorescence signals were captured using a confocal spectral microscope imaging system (TCS SP5; Leica).
Gene expression analysis and RNA-seq
For gene expression analysis in seeds, flowers were marked with color-coded thread after fertilization. The corresponding pods were harvested at the indicated days after fertilization (DAF), and the developing seeds were then dissected using a needle and immediately placed in liquid nitrogen. For SW14 gene expression analysis, various tissues were collected from 2-week-old seedlings or plants at flowering stage. All experiments were performed with three biological replicates, each of which is a pooled tissue from more than 10 individual plants. Total RNA was isolated with a Plant RNA Kit (Promega, LS1040) and reverse transcribed to cDNA using M-MLV Reverse Transcriptase (Promega, M1701). RT-qPCR was performed using ChamQ Universal SYBR qPCR Master Mix (Vazyme, Q711) on a Light Cycler 480 thermal cycler system (Roche). The relative quantification was calculated in triplicate and normalized to that of GmACT11 (as an internal control). Primers used are listed in Supplementary Data 1. For the RNA-seq analysis, total RNA was extracted from 21 DAF seeds of W82 and sw14#1 plants, with three biological replicates for each genotype. Differentially expressed genes were assessed using R package DESeq246 with a criterion of fold change ≥1.5 and an adjusted P < 0.01.
Cell-free protein degradation assay
The coding sequences of SW14H1 and SW14H3 were inserted into the BamHI/SalI restriction sites of pGEX-4T-1 (Pharmacia, 28954549). Primers used are listed in Supplementary Data 1. GST and GST fusion recombinant proteins were induced in Escherichia coli Rosetta cells and purified by Glutathione Sepharose Beads (GE Healthcare, 17-0756-01).
The cell-free protein degradation assay was performed as described47 using 21 DAF developing seeds. Total proteins were extracted with degradation buffer (25 mM Tris-HCl, pH 7.5, 10 mM NaCl, 10 mM MgCl2, 5 mM DTT, 100 mM CHX, and 10 mM ATP) and cell debris was removed by centrifugation at 20,000 × g for 15 min. 100 μL cell extracts (containing 500 μg total proteins) were incubated with equal amounts of recombinant GST-SW14H1, GST-SW14H3, or GST protein at 25 °C for the indicated time. Reactions were boiled in SDS loading buffer and then analyzed by immunoblotting with α-GST antibody (Tiangen, AB101-02, 1:10,000 dilution).
Yeast two-hybrid, three-hybrid, and four-hybrid assays
The coding sequence of SW14H1 was inserted into the EcoRI/BamHI restriction sites of pGBKT7 (Clontech, 631604). The coding sequences of GmLEC1a and GmLEC1b were inserted into the EcoRI/BamHI restriction sites of pGADT7 (Clontech, K1612-1). Primers used are listed in Supplementary Data 1. Yeast two-hybrid assays were performed according to the Yeastmaker Yeast Transformation System 2 (Clontech). Yeast AH109 cells were co-transformed with the bait and prey plasmids. All yeast cells were grown on SD/-LW medium for selection. Positive clones were selected in SD/-LWHA dropout plates to evaluate direct protein interactions following incubation at 30 °C.
To investigate the effect of GmNF-YC2 and SW14 on the interaction between GmLEC1a and GmbZIP67, the coding sequence of GmbZIP67 was inserted into the EcoRI/BamHI restriction sites of pGADT7, and the coding sequences of GmNF-YC2 and SW14 were inserted into the XhoI/XmaI restriction sites of pQH05, respectively. For the yeast three-hybrid assay, yeast AH109 cells were co-transformed with bait and prey plasmids in the presence of either pQH05 or pQH05-GmNF-YC2. All yeast cells were grown on SD/-LWH medium for selection, and positive clones were then spotted on SD/-LWHA medium for the interaction test. For yeast four-hybrid assays, PCR genotyping was performed to select the yeast single colonies containing both GmNF-YC2 and SW14 genes. Primers used are listed in Supplementary Data 1. These experiments were repeated at least three times with similar results.
Split-luciferase assay
The coding sequences of GmLEC1a and GmLEC1b were inserted into the KpnI/SalI restriction sites of pCAMBIA1300-nLUC, and the coding sequence for SW14H1 was inserted into the KpnI/SalI restriction sites of pCAMBIA1300-cLUC48. Primers used are listed in Supplementary Data 1. Agrobacterium tumefaciens strain GV3101 cells harboring the indicated constructs were mixed at a 1:1 ratio and introduced into N. benthamiana leaves. The luciferase was activated by 1 mM D-luciferin sodium salt substrate (Abcam, ab145164) after 2 to 3 days of infiltration. The luminescence imaging workstation (NightSHADE LB985; Berthold) was used to capture luciferase images. Split-luciferase experiment was repeated at least three biological replicates.
Co-IP assay
The coding sequence of SW14H1 was inserted into the pGreen-35S: GFP vector to generate 35S: SW14-GFP construct. The 35S:BFP-GFP construct is from a previous study49. The coding sequences of GmLEC1a and GmLEC1b were inserted into the XbaI/BamHI restriction sites of pTF101 vector to generate 35S: GmLEC1a/b-FLAG constructs. Primers used are listed in Supplementary Data 1. Pairwise constructs were co-transformed into N. benthamiana leaves. At 2 to 3 days after infiltration, the leaves were harvested for total protein extraction in co-immunoprecipitation buffer (50 mM HEPES [pH 7.5], 150 mM KCl, 10 mM ZnSO4, 5 mM MgCl2, 1% Triton X-100, and 0.05% SDS, 0.5 mM PMSF, proteinase inhibitor cocktail,). The total proteins were incubated with GFP trap beads (Chromotek, gtak-20) at 4 °C overnight, and rinsed three times with co-immunoprecipitation buffer. The precipitated proteins were boiled in 1× SDS loading buffer and detected by immunoblotting with α-GFP (TransGen, HT801-01, 1:5000 dilution) and α-FLAG (Sigma, F3165, 1:10,000 dilution) antibodies. Co-IP experiment was repeated three biological replicates.
Transient expression assay
To generate the pFA9:LUC and pGmFAD3c:LUC reporter constructs, 3 kb FA9 and 2 kb GmFAD3c promoters were cloned into the HindIII/BamHI restriction site of the pGreenII 0800-LUC vector, respectively. The Renilla Luciferase (REN) gene under the control of the 35S promoter in the pGreenII 0800-LUC vector was used as the internal control. The coding sequences of GmLEC1a, GmNF-YC2, GmbZIP67, and SW14 were cloned into the modified pDOE-01 vector used as effectors. Primers used are listed in Supplementary Data 1. The indicated combinations of effectors and reporters were transformed into N. benthamiana leaves. The LUC and REN activities were measured using the Dual-Luciferase Reporter Assay System Kit (Promega, E1910).
Chromatin immunoprecipitation (ChIP) qPCR assay
ChIP assays were performed as described previously23. Briefly, 21 DAF developing seeds were crosslinked with 1% formaldehyde (Sigma, F8775). Nuclei were isolated from the samples and sonicated to fragment chromatin with an average size of ~500 bp. Subsequently, the chromatin was immunoprecipitated with Protein G PLUS/ Protein A agarose (Millipore, 16-201) plus α-FLAG antibody. The precipitated DNA were purified and used for qPCR analysis with ChamQ Universal SYBR qPCR Master Mix using the primers shown in Supplementary Data 1. Relative enrichment fold was quantified by normalizing the amount of a target DNA fragment against that of a GmACT11 genomic fragment and then against the respective input DNA samples.
Genetic diversity analysis
SNPs from previous study24 with <10% missing data and MAF > 5% were utilized to analyze the genetic diversity (π) of SW14 locus. The pairwise genomic differentiation values for wild, landrace and cultivated soybean populations or soybean accessions harboring different natural variations were calculated using a—window pi2000—window-pi-step 1000 sliding window in VCFtools50. The values of Tajima’s D were calculated as the probability of the sequence departure of a neutrally evolved model using VCFtools24.
Statistical analyses
GraphPad Prism 8.0 and SPSS (version 19, IBM) were used for statistical analysis of the numerical data. The statistically significant differences between two groups or multiple samples were determined by one-way ANOVA. The figure legends provide details on the statistical tests utilized for each experiment.
Reporting summary
Further information on research design is available in the Nature Portfolio Reporting Summary linked to this article.