
Patient population
Paired tumor and normal samples from 513 self-identified AA women with TNBC were interrogated by WES. After data processing and quality control steps, 462 (90%) cases were included in the final analysis. Patient descriptive characteristics are shown in Supplementary Table 1. The average (±s.d.) age at diagnosis was 53 (±11) years, with 38% before the age of 50 years.
Mutational landscape of TNBC in AA women
From the 462 tumors, we identified 39,103 mutations in the coding regions, including 36,059 (92%) single-nucleotide variants (SNVs) and 2,690 (7%) insertion/deletions (indels; Supplementary Fig. 1). The median mutation burden was 1.29 (range = 0.07–22.2) SNVs per Mb, with five tumors (1%) considered hypermutated (>10 SNVs per Mb)13 (Supplementary Fig. 2), three of which carrying a mutation in mismatch repair genes (MLH1, MSH3 and LIG1). At the gene level, we identified nonsilent mutations in 11,273 genes (Supplementary Table 2), with a median of 47 (range = 1–664) mutated genes per tumor.
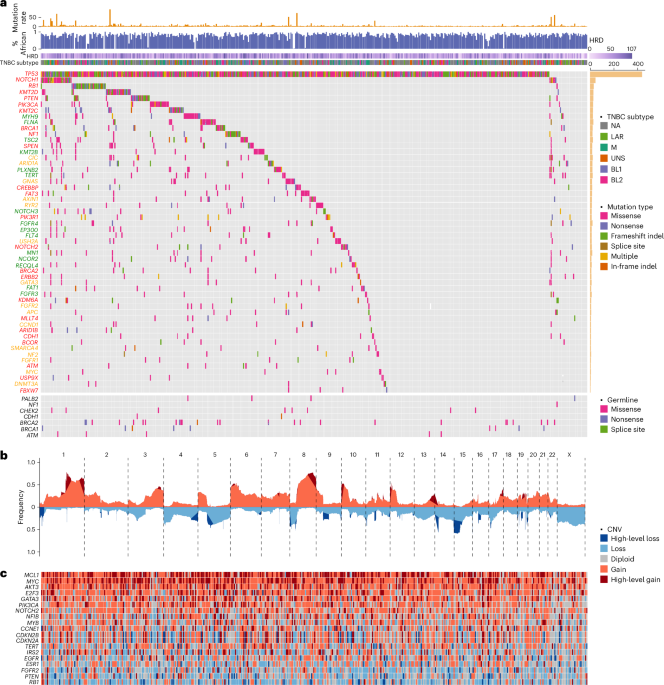
Figure 1a illustrates the compendium of somatic mutations in TNBC from AA women. The mutational landscape is predominated by alterations in TP53, with a total of 463 mutations found in 437 (95%) tumors, including 18 with two or more mutations. A majority (59%) of the mutations were recurrent and all but six were nonsilent. We classified 294 (66%) of the TP53 coding mutations as loss of function, 113 (26%) as gain of function, 2 (0.5%) as benign, and 33 (7%) as function unknown (most in-frame indels). Most tumors (n = 431 or 93%) had at least one nonsilent mutation. One tumor harbored E224E, a known cancer-driving synonymous mutation14. In addition, five tumors harbored intronic mutations only. Using transcriptomic data available from four of these tumors, we found evidence of aberrant RNA splicing in three (Extended Data Fig. 1).
Fig. 1: Mutational landscape of TNBC from AA women.
a, CoMut plot of somatic and germline mutations in TNBC from AA women. Mutation rate is presented as the number of SNVs per Mb. The proportion of African ancestry was estimated based on germline variant data from matched normal DNA samples and presented as a numeric value between 0 and 1. TNBC subtype was classified based on tumor transcriptomic data available from 260 cases using the method discussed in ref. 20. HRD was estimated based on WES data using scarHRD R package57. Somatic mutations are sorted by mutation frequency and shown in the upper section of the CoMut plot. Germline variants are shown in the lower section of the plot. Gene symbols are labeled in colors to indicate known TNBC genes (red), breast cancer genes (yellow) and pan-cancer genes (green). NA, not available. b, Frequency of CNAs (y axis) across chromosomes (x axis), with red color for copy number gain, blue color for copy number loss and dark red and dark blue for regions tested substantially in GISTIC2 analysis. CNV, copy number variation. c, Heatmap of known cancer genes in substantial peaks identified by GISTIC2. BL1, basal-like 1; BL2, basal-like 2; LAR, luminal androgen receptor; M, mesenchymal; UNS, unassigned.
Confirmation of TP53 mutations
In validation analysis of TP53 mutations using transcriptomic data available from 260 patients, 215 (83%) of the 259 mutations identified by WES were detected at the RNA level (Extended Data Fig. 2). Given the uneven coverage of RNA sequencing, we restricted the analysis to tumors with ≥10× and were able to confirm 183 of 187 (98%) mutations in these tumors. The concordance reached 100% (109/109 mutations) in tumors with ≥30× coverage.
Furthermore, we resequenced the TP53 region in 338 tumors with DNA available (317 with and 21 without mutations) using targeted amplicon sequencing (TAS). These 317 tumors harbored 326 mutations identified by WES. We confirmed 324 (99%) mutations, with only two going undetected by TAS (Extended Data Fig. 2). Of the 21 tumors that had no TP53 mutations in WES data, TAS analysis identified two new mutations at low variant allele frequency (<5%).
Known cancer genes and significantly mutated genes
Of the 11,273 genes harboring nonsilent mutations, 218 had a frequency ≥2% (≥10 tumors; Supplementary Table 2). Aside from TP53, all other genes were mutated at a much lower frequency (Fig. 1a). These included 16 known TNBC genes, namely, NOTCH1 (7%), RB1 (7%), KMT2D (6%), PIK3CA (5%), PTEN (5%), KMT2C (5%), BRCA1 (5%), NF1 (5%), SPEN (4%), FAT3 (4%), CREBBP (4%), PIK3R1 (3%), NOTCH2 (3%), BRCA2 (2%), ERBB2 (2%) and KDM6A (2%), and 7 known breast cancer genes, albeit not specific to TNBC, ARID1A (4%), CIC (4%), GNAS (4%), AXIN1 (4%), RYR2 (3%), USH2A (3%) and GATA3 (2%). Additionally, 21 driver genes identified in previous pan-cancer analysis15,16 mutated in ≥2% in our cohort. These included several well-known cancer genes or their family members with previously less recognized role in breast cancer—FGFR3, FGFR4, NOTCH3, KMT2B, EP300, FLT4 and FAT1.
Significantly mutated genes (SMG) analysis identified 13 genes with q ≤ 0.20 by two or more programs used (MutSigCV17, MutSig2CV18 and MuSiC19), which were all known cancer genes in TNBC (Supplementary Tables 3–6).
In comparisons across TNBC transcriptional subtypes20,21, the luminal androgen receptor subtype had enrichment of somatic mutations in PTEN (P = 0.003) and PIK3R1 (P = 0.04) and slight depletion of TP53 (P = 0.009) mutation, consistent with previous studies in Asian and NHW patients (Supplementary Fig. 3)10,22,23.
Pathogenic germline mutations
Using sequencing data from matched normal samples, we identified 124 germline mutations in nine known TNBC predisposition genes from 241 patients (Fig. 1a). Of these variants, 115 were found in gnomAD and other reference datasets24,25,26,27, 22 being exclusive to populations of African ancestry (Supplementary Table 7). When minor allele frequency was compared with reference populations, 60 variants had a higher frequency in TNBC patients (P < 0.05; Extended Data Fig. 3). These results confirmed benignity for 28 of 30 variants classified as ‘benign/likely benign’ and pathogenicity for 23 of 25 variants classified as ‘pathogenic/likely pathogenic’ by ClinVar28, while yielding new evidence of pathogenicity for 14 of 35 variants annotated as ‘conflicting classification of pathogenicity’ and 15 of 18 variants annotated as ‘uncertain significance’. Moreover, we identified six variants, including two in PTEN and four in BRCA1, with no pathogenicity annotation in ClinVar28, all of which had a higher frequency in TNBC cases than in the reference datasets, including R119C mutation in PTEN (P = 9 × 10⁻⁷). Lastly, we discovered nine new germline mutations not previously reported in any reference databases, including three in BRCA1, three in BRCA2, two in PALB2 and one in NF1. Two of the BRCA1 variants were deemed damaging in saturation genome editing29.
Copy number aberrations
Figure 1b illustrates the copy number abberation (CNA) landscape based on WES data captured with additional baits representing human array comparative genomic hybridization (aCGH) probes. We identified multiple substantial copy number gains or losses, including 18 regions containing known cancer genes (Supplementary Fig. 4). As expected, high-level MYC amplification was one of the most common copy number changes found in 36% of the tumors (Fig. 1c). Other known cancer genes residing within substantial aberrant regions defined by Genomic Identification of Significant Targets in Cancer (GISTIC2) included high-level amplifications of MCL1 (44%), AKT3 (21%), GATA3 (19%), E2F3 (18%), NFIB (13%), CCNE1 (12%), IRS2 (12%), PIK3CA (12%), MYB (8%), NOTCH2 (8%), EGFR (5%), FGFR2 (5%) and TERT (4%) and homozygous deletion of RB1 (8%), PTEN (6%), CDKN2A/CDKN2B (5%) and ESR1 (3%).
Commonly altered signaling pathways
In gene set enrichment analysis (GSEA) based on 218 cancer driver genes harboring recurrent (≥1%) somatic mutations in the cohort, we identified four commonly altered signaling pathways (q < 0.05). The p53 signaling pathway was altered in most (95%), if not all, TNBC in our cohort (Fig. 2a). Mutations in other genes in the core p53 signaling pathway were much rarer (1% in ATM and 5% in CHEK2) and all co-occurred with TP53 mutations. When CNAs were also considered, the p53 signaling pathway was implicated in 97% (n = 450) of the tumors.
Fig. 2: Common signaling pathways altered in TNBC from AA women.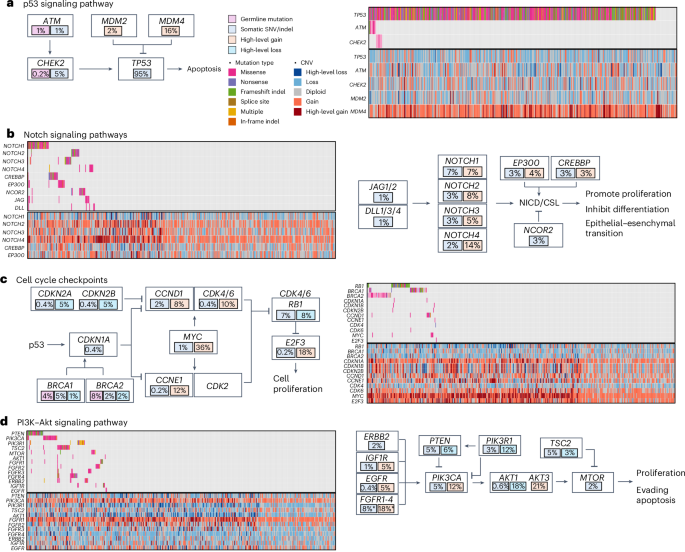
Commonly altered pathways in TNBC from AA women based on GSEA results using point mutations and indels. The numbers in the plots indicate the percentages of tumors harboring the alterations that are color coded. a, p53 signaling pathway. b, Notch signaling pathway. c, Cell cycle checkpoints. d, PI3K–Akt signaling pathway.
NOTCH1 was the second commonly mutated gene (7%) in our cohort. Nonsynonymous mutations were found at a lower frequency in three other NOTCH family genes, with an aggregated mutation frequency of 14%, which was further increased to 22% when other genes in the core Notch signaling pathway were considered (Fig. 2b). Moreover, high-level amplifications were also identified in NOTCH family genes and two co-activators EP300 and CREBBP.
RB1 is the third most commonly mutated gene (7%) in our cohort, and homozygous deletion was observed in 8% of the tumors (Fig. 2c). In addition to germline mutations, BRCA1 and BRCA2 somatic mutations were observed in another 5% and 2% of tumors, respectively. Further, 5% of the tumors demonstrated homozygous deletion of CDKN2A and CDKN2B. On the contrary, high-level amplification occurred at a high frequency in several key genes driving cell cycle progression, including CCND1 (8%), CCNE1 (12%), CDK4/CDK6 (10%), E2F3 (18%) and MYC (36%).
Several genes in the PI3K–Akt signaling pathway that encode growth factor receptors demonstrated mutation and/or high-level amplification, including the four FGFR family members, ERBB2, IGFR1 and EGFR (Fig. 2d). In addition, several core PI3K pathway members were among the top mutated genes, including PIK3CA, PTEN and TSC2 each at 5%, plus PIK3R1 at 3% and MTOR at 2%.
Mutational signatures
Three de novo single base substitution (SBS) mutational signatures were extracted from 457 tumors after excluding five hypermutated samples, which were then decomposed to five of the COSMIC SBS96 signatures (Fig. 3a and Supplementary Fig. 5)30. These include two clock-like signatures, SBS1 and SBS5, homologous recombination deficiency (HRD)-related signature, SBS3, and two APOBEC-related signatures, SBS2 and SBS13, all of which have previously been found in TNBC in Asian and NHW women10,11,31,32. The clock-like SBS1 and SBS5 were moderately correlated with each other (r = 0.45, P < 0.001) and together showed a moderate correlation with patient age (r = 0.21, P < 0.001; Supplementary Fig. 6a).
Fig. 3: Mutational signatures in TNBC from AA women.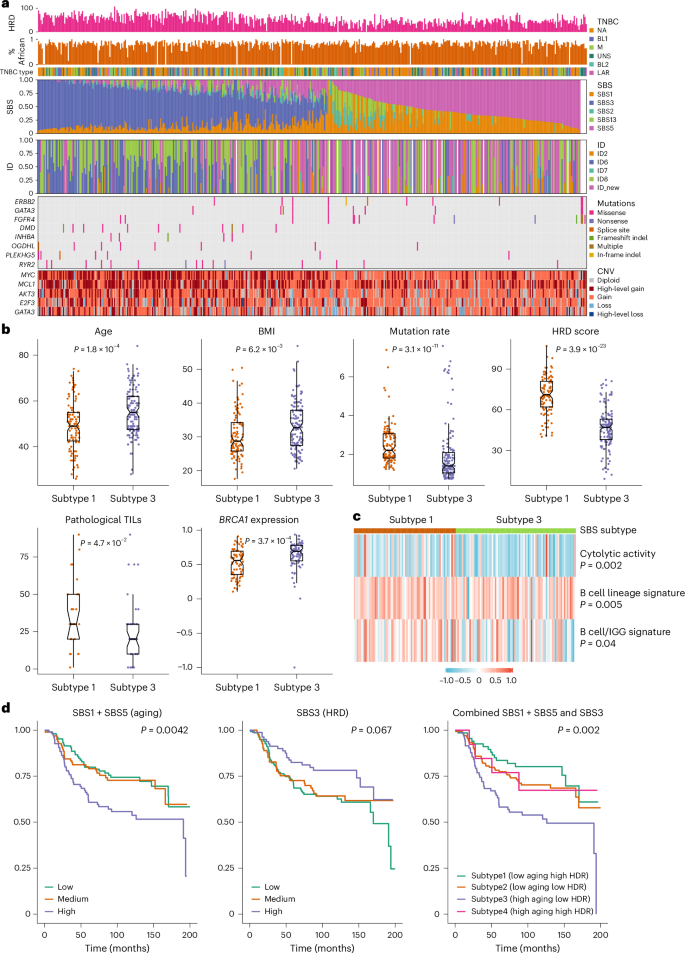
a, From top to bottom: the first row shows HRD estimated based on WES data using scarHRD R package57. The second row shows the proportion of African ancestry was estimated based on germline variant data from matched normal DNA samples and presented as a numeric value between 0 and 1. The third row shows TNBC subtype classified based on tumor transcriptomic data available from 260 cases using the method discussed in ref. 20. The fourth and fifth rows show SBS and ID (indel) mutational signatures, respectively. The sixth and seventh rows show genes with differences in frequency of somatic mutations and CNAs between SBS subtype 1 (low aging and high HRD) and subtype 3 (high aging and low HRD), respectively. b, Demographic and mutational features that show substantial differences between SBS subtype 1 (n = 103) and subtype 3 (n = 131) by the Wilcoxon test and the P values were two-sided without adjustment for multiple comparisons. Subtypes 2 and 4 have characteristics that fall somewhere between subtypes 1 and 3 and are not shown. The bar in the middle of a box indicates the subgroup median, and the lower and upper edges indicate the first and third quartiles, respectively. The whiskers indicate the range in each subgroup. P values were derived from two-sided Wilcoxon test between Black and white patients. TILs, tumour-infiltrating lymphocytes. c, Tumor microenvironment immune signatures that show substantial differences between SBS subtype 1 and subtype 3 by the Wilcoxon test and the P values were two-sided without adjustment for multiple comparisons. d, Kaplan–Meier curves of all-cause mortality (death due to any cause) by SBS signatures, with P values derived from the log-rank test.
While SBS1 and SBS5 were found in virtually all tumors, representing the dominant mutagenic processes in almost half of the tumors, the HRD-related SBS3 dominated the other half (53%; Fig. 3a). As expected, SBS3 was correlated with HRD score (r = 0.62, P < 0.001; Supplementary Fig. 6b), and was more active among patients carrying BRCA1 and BRCA2 germline variants (P = 0.005; Supplementary Fig. 6c). Notably, there was also a moderate negative correlation between SBS3 and SBS5 (r = −0.29, P < 0.001). The two APOBEC-related signatures, SBS2 and SBS13, were strongly correlated with each other (r = 0.85, P < 0.001) and manifested in 35% TNBC tumors at lower activity relative to the other three signatures.
For indels, three de novo signatures were extracted from 439 tumors. Decomposition analyses yielded six indel signatures in reference to COSMIC ID83 (ref. 30), including the following five known ones: ID2 related to slippage during DNA replication, ID4 with no known etiology, ID6 related to HRD, ID7 related to defective DNA mismatch damage repair and ID8 related to double strand break repair (Fig. 3a and Supplementary Fig. 5)30. ID6 and ID8 were the most active mutagenic processes found in 38% and 42%, respectively, of the tumors and both showed a moderate correlation with estimated HRD score (r = 0.48 and r = 0.42, respectively, P < 0.001; Supplementary Fig. 6d,e). The sixth indel signature, characterized by longer indels ≥5 bp was new and presented in one-third of the TNBC tumors, which displayed a weak negative correlation with HRD (r = −0.21, P < 0.001; Supplementary Fig. 6f).
When examined across TNBC transcriptional subtypes20,21, the M subtype had relatively lower APOBEC-related SBS2 (P = 0.005) and SBS13 (P = 0.09) signatures, and the luminal androgen receptor subtype had lower HRD-related SBS3 (P = 0.006) but higher ID4 signature (P = 0.006; Supplementary Fig. 3).
Genomic and immune differences by SBS subtype
We defined SBS signature-based TNBC subtypes by combining SBS1 + SBS5 (aging) and SBS3 (HRD). The differences between subtype 1 (low aging and high HRD) and subtype 3 (high aging and low HRD) were the most apparent, whereas subtype 2 (low aging and low HRD) and subtype 4 (high aging and high HRD) were somewhere in between. Tumor classified as subtype 1 had higher mutation rate, HRD score and pathological tumor infiltrating lymphocyte score, lower BRCA1 expression and were less likely from older patients or those with higher body mass index (BMI; P ≤ 0.05; Fig. 3b). For every 10-year increment of age and every 5 kg m−2 increment of BMI, the odds of having subtype 1 versus subtype 3 TNBC decreased by 68% (P = 0.0001) and 31% (P = 0.008), respectively.
Moreover, these two SBS subtypes differed in somatic mutations in several cancer driver genes, including higher mutation frequency of ERBB2, GATA3 and FGFR4, and lower frequency of DMD, INHBA, OGDHL, PLEKHG5 and RYR2 in subtype 3 than in subtype 1 (P < 0.05; Fig. 3a). In addition, subtype 1 tumors were also more likely to have high-level amplification of MYC, MCL1, AKT3, E2F3 and GATA3 (P < 0.05). In analysis of gene expression-based immune signatures, subtype 1 manifested with stronger immune cytolytic activity signature33 (P = 0.002) and two B cell signatures34,35 (P = 0.005 and P = 0.04) than subtype 3 (Fig. 3c). Consistent with this, GSEA showed substantial enrichment of many immune response gene sets in subtype 1 relative to subtype 3 tumors (Supplementary Fig. 7).
Mutational signatures and patient survival
As shown in Fig. 3d, higher SBS1 + SBS5 (aging) was associated with higher all-cause mortality (high versus low—hazard ratio (HR) = 1.97, 95% confidence interval (CI) = 1.24–3.13, P = 0.004), whereas higher SBS3 (HRD) was associated with lower mortality (HR = 0.55, 95% CI = 0.33–0.92, P = 0.02). The associations became only borderline substantial after adjusting for age, study and stage (Supplementary Table 8). No substantial association of patient survival was found with APOPEC signatures SBS2 or SBS13. In analyses of SBS signature-based TNBC subtype, patients with subtype 3 had the higher all-cause mortality, in comparison to those with SBS subtype 1 (HR = 2.63, 95% CI = 1.47–4.69, P = 0.001; Fig. 3d), which remained substantial after controlling for age and cancer stage (HR = 1.96, 95% CI = 1.05–3.64, P = 0.03). Meta-analyses across the three studies show similar results (Extended Data Fig. 4). No substantial association was observed with subtype 2 or subtype 4.
Comparisons of somatic mutations across racial groups
Figure 4 shows the three-way comparisons of mutation frequency of known breast cancer genes across AA patients from ‘Breast Cancer in African Americans: Understanding Somatic Mutations and Etiology’ (B-CAUSE) study (n = 462), Asian patients from Fudan University Shanghai Cancer Center (FUSCC; n = 279)10 and NHW patients (n = 626) pooled from The Cancer Genome Atlas (TCGA)36, Sweden Cancerome Analysis Network—Breast (SCAN-B)11 and Molecular Taxonomy of Breast Cancer International Consortium (METABRIC)37, with the full results provided in Supplementary Table 9. The mutation frequencies were largely similar between Asian and NHW patients, yet several genes had notably different mutation frequency from these in AA patients, including higher frequencies of TP53 (95%, 78% and 75% in AA, Asian and NHW patients, respectively; P < 1 × 10⁻⁹) and NOTCH1 (7%, 2% and 4%, respectively; P < 0.01) mutations. On the contrary, a number of genes were found to mutate at a lower frequency in AA patients than in Asian or NHW patients, most notably PIK3CA (5%, 19% and 15%, respectively; P < 2 × 10⁻⁶), RYR2 (3%, 7% and 8%, respectively; P < 0.03) and USH2A (3%, 1% and 8%, respectively; P < 9 × 10⁻⁴), while the mutation frequency of AKT1, ATR, ATRX, MAP3K1, PREX2 and SETD2 were very low in AA patients (<1%) but relatively common (≥3%) in Asian and/or NHW patients.
Fig. 4: Comparison of somatic mutations in TNBC between AA, Asian and NHW women.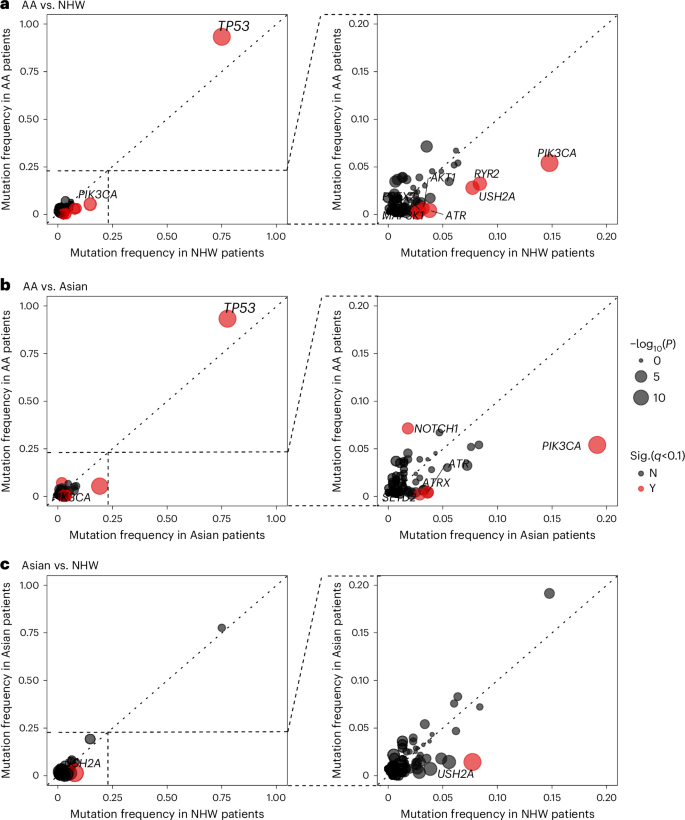
a–c, The frequency of nonsilent mutations in known breast cancer genes in TNBC from AA women (y axis) and NHW women (x axis) (a), AA women (y axis) and Asian women (x axis) (b) and Asian women (y axis) versus NHW women (x axis) (c). AA women were from B-CAUSE study; Asian women were from FUSCC and NHW women were pooled from TCGA, SCAN-B and METABRIC. Each dot represents one gene with the dot size corresponding to the negated log10-transformed two-sided P value from comparison test. Genes that were substantial at q < 0.10 after FDR correction are shown in red.
For TP53 and PIK3CA, the two genes showing the largest mutation frequency discrepancy across the three patient populations, the gene mutation spectrums were, nevertheless, largely similar, with some minor yet notable differences. Most of the mutations in TP53 were found in the DNA-binding domain (DBD), featured prominently with four hotspot mutations (R175, R213, R248 and R273), plus another hotspot mutation R342 in the tetramerization domain (Fig. 5a). Tumors from AA women had two other hotspot mutations, H179 and E286 in the DBD, which were absent in Asian patients and at only low frequency in NHW patients. On the contrary, nonsense mutation R196* was rare in AA patients but more common in Asian and NHW patients. The spectrum of PIK3CA mutations was dominated by one hyperactivating mutation, H1047R/L, in all three populations; however, the other three hyperactivating hotspot mutations, N345K, E542K and E545K, were found only in tumors from Asian and NWH women but not from AA women (Fig. 5b).
Fig. 5: Mutation spectrum of TP53 and PIK3CA in TNBC from AA, Asian and NHW women.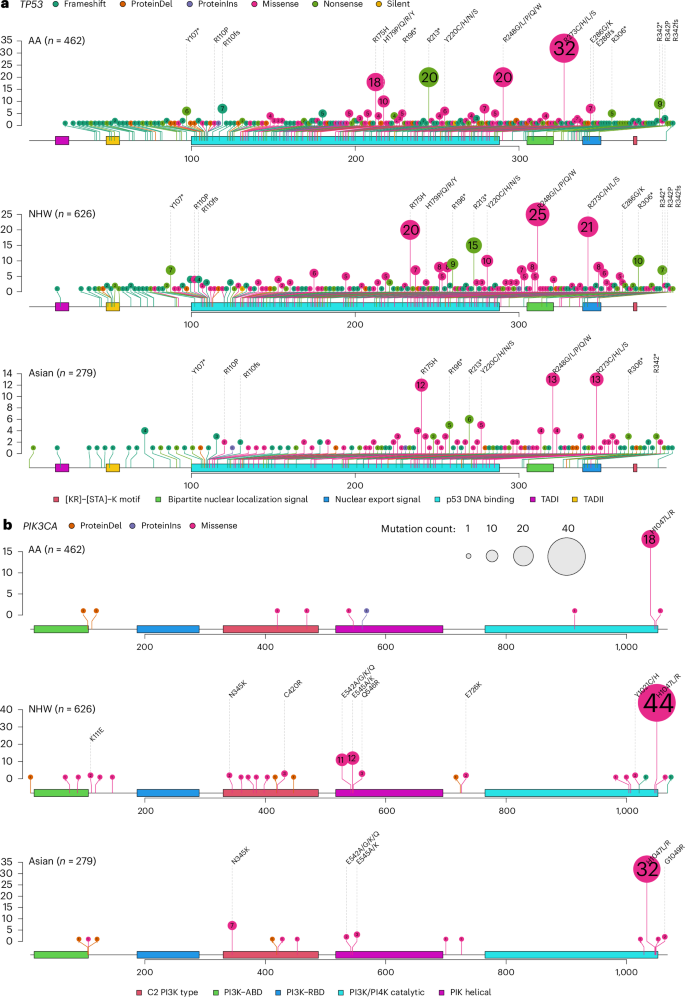
a,b, Lollipop plot of TP53 (a) and PIK3CA (b) somatic mutations in TNBC from AA (B-CAUSE, n = 462), Asian (FUSCC, n = 279) and NHW women (TCGA, SCAN-B and METABRIC, n = 626). ABD, adaptor-binding domain; RBD, RAS-binding domain. The numbers in the circles indicate the number of tumors harboring the mutation in the cohort.
African ancestry and somatic mutational features
The median proportion of African ancestry was 0.82 (interquartile range = 0.74–0.89; Supplementary Fig. 8). There was no correlation of African ancestry with mutation rate, HRD score or any of the mutational signatures (Supplementary Fig. 9). There were also no differences in percent African ancestry by TNBC subtype or TP53 hotspot mutations.
Neoantigen analysis
Supplementary Fig. 10 shows the number of predicted neoantigens in each tumor (median = 2, range = 0–35) with the number of nonsynonymous missense mutations, where moderate correlation was found between the two (r = 0.58, P < 0.001).
RNA fusion events
We characterized fusion events in 260 TNBC patients with transcriptomic data. Using stringent filtering criteria, we identified 471 fusion mutations in 148 (56%) of the tumors, including seven recurrent fusions and 96 fusions involving a known cancer gene (Supplementary Table 10). The most common recurrent fusions were characterized by adjacent rearrangements involving PTK2 or ETV6, the latter of which is a tumor suppressor that turns to an oncogene in its fusion forms38. We identified one tumor with BCL2L14–ETV6 associated with mesenchymal TNBC39 and another with ETV6–NTRK3 that was a marker of secretory breast carcinoma, a rare basal-like breast cancer40,41. Six tumors had fusions involving PTK2 with multiple partners, and none retained the kinase domain (Supplementary Fig. 11). Moreover, three tumors contained PARG–BMS1 fusion associated with metaplastic TNBC42. In addition, four tumors had fusion mutations involving NOTCH2 or NOTCH2NL43.
Potential therapeutic targets in TNBC
Based on deleterious mutations in BRCA1 and BRCA2 and an HRD score ≥42 (ref. 44), 332 (70%) tumors were predicted responsive to neoadjuvant chemotherapy (Fig. 6a). We also annotated somatic mutations, CNAs and gene fusions using OncoKB45, and identified 53% of the tumors (n = 246) harboring genetic alterations with known target therapeutic agents at various confidence levels (Supplementary Table 11 and Fig. 6b). It should be noted that none of these molecular targets nor the associated therapies have been approved for TNBC treatment. Finally, 163 (35%) and 62 (13%) tumors had copy number gain and high-level amplification of CD274 (PD-L1), respectively, associated with higher mRNA expression (Supplementary Fig. 12) and predictive of response to pembrolizumab46, an immune checkpoint inhibitor approved for TNBC treatment.
Fig. 6: Clinically actionable genomic changes in TNBC from AA women.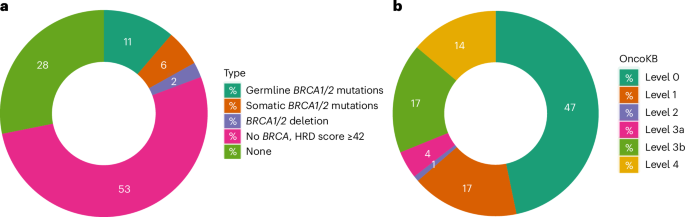
Donut plots of actionable alterations in TNBC from AA women. Numbers in the plots are percentage of cases classified to each category. a, HRD defined on the basis of germline and somatic mutations in BRCA1 and BRCA2, and an HRD score ≥42, which predicts response to neoadjuvant chemotherapy. b, Classification of actionable somatic mutations, CNAs or fusion events based on OncoKB database45. Level 1, Food and Drug Administration (FDA)-recognized biomarker predictive of response to an FDA-approved drug; level 2, standard care biomarkers predictive of response to an FDA-approved drug; level 3a, compelling clinical evidence for the biomarker predictive of response to a drug; level 3b, standard care of investigational biomarker predictive of response to an FDA-approved or investigational drug; level 4, compelling biological evidence for the biomarker predictive of response to a drug.