

Short-term Bitcoin investors have generated a rare signal that previously indicated a local market bottom. This was reported by Frank Fetter, an analyst at Vibes Capital Management.
Officially got the Oversold print on the short-term holder MVRV bollinger bands. Last three instances of this:
1. Yen Carry Unwind — $49k
2. Tariff Tantrum — $74k
3. Today — $108k $BTC pic.twitter.com/AqcYXLwbzw
— Frank (@FrankAFetter) September 1, 2025
The purchase price of coins held by short-term holders has equaled the current market price of the leading cryptocurrency. This level often acts as support during corrections in a bull market, but its loss could lead to a prolonged decline.
The MVRV indicator for this category of holders has reached a breakeven point. Its deviation from the lower Bollinger band is extremely rare. Over the past year, this has occurred only twice:
in August 2024 amid the unwinding of the yen carry trade;
in April 2025, when digital gold fell below $75,000 due to U.S. tariffs.
Currently, a bullish divergence is forming on the BTC/USD chart on the four-hour RSI indicator. According to Fetter, this indicates a potential trend reversal.
A “Fragile” Market
On September 2, Bitcoin’s price briefly recovered to $110,000 after falling to $107,000 at the end of August. However, analysts at Glassnode noted a decline in investor interest. They stated that the market structure remains unstable.
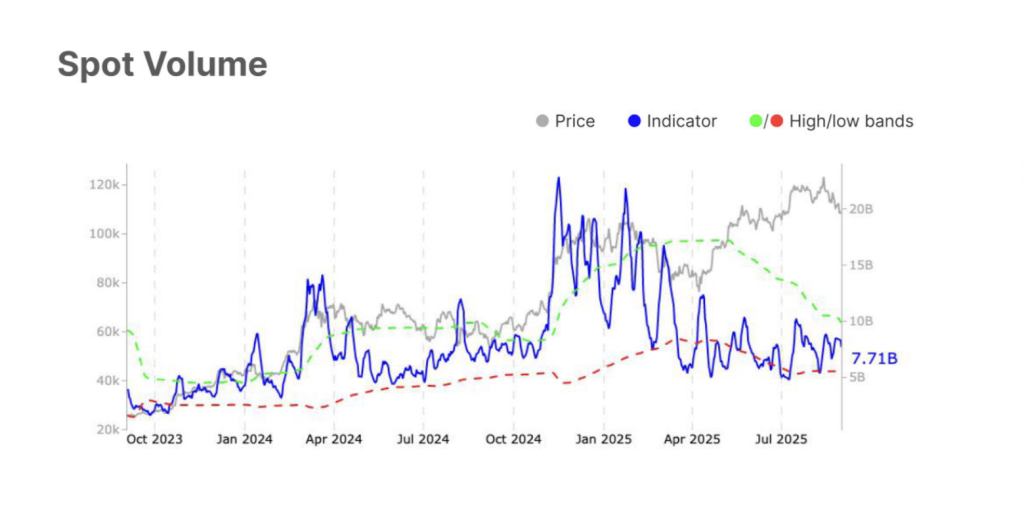
Last week, demand in the spot market for digital gold was weak. Trading volume fell by 9% — from $8.5 billion to $7.7 billion. Experts emphasized that investors and traders are losing confidence in Bitcoin’s recovery.
 Source: Glassnode.
The CVD indicator rose slightly, indicating a decrease in sales. Nevertheless, “spot metrics indicate fragile demand,” added Glassnode.
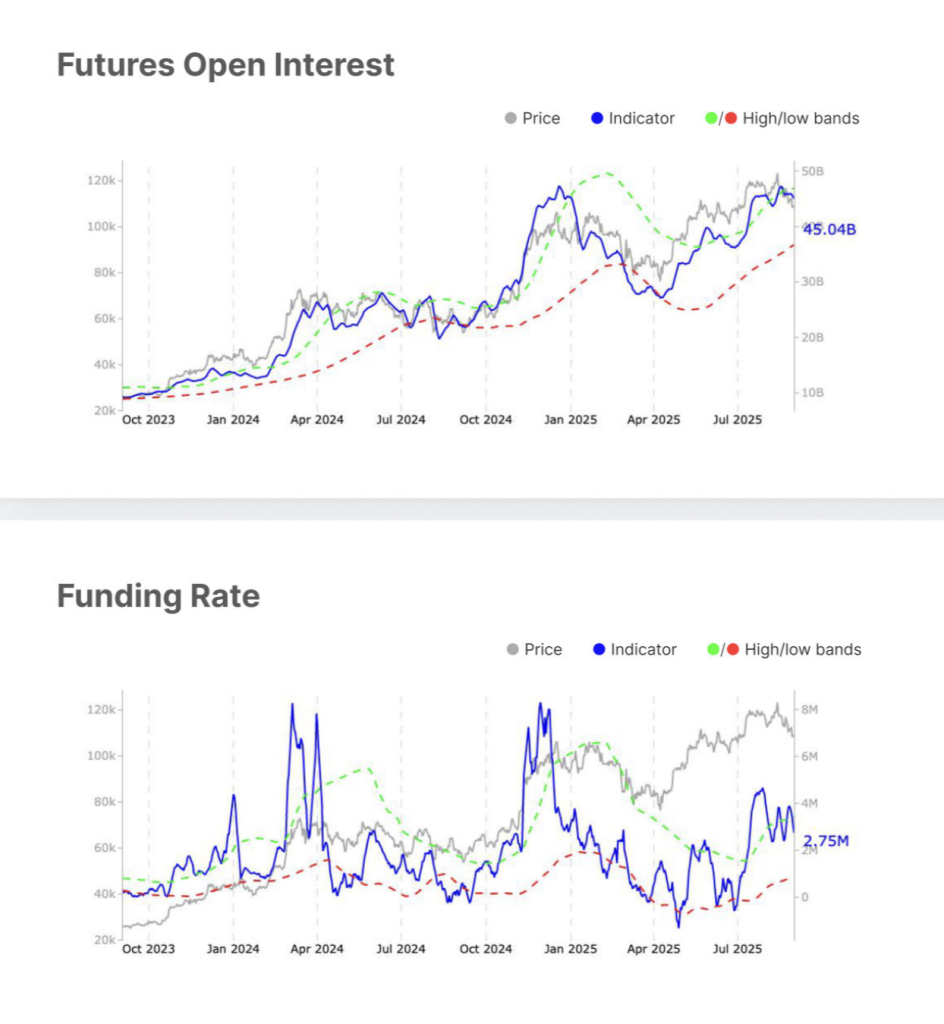
The situation in the futures market also points to player caution. Open interest decreased from $45.8 billion to $45 billion, and funding volume fell from $3.8 billion to $2.8 billion.
 Source: Glassnode.
Key Levels to Watch
The key resistance level has become $110,500 — the upper boundary of the descending channel. Closing above this could open the path to the liquidity zone of $110,000-117,000.
The nearest support levels, according to experts, are $108,000 and $107,300.
MN Capital founder Michaël van de Poppe believes that for Bitcoin to reach a new all-time high, it must consolidate above $112,000. Otherwise, the cryptocurrency faces a pullback to $103,000.
The area remains the same for $BTC.
If we can clearly break $112K, we’ll be onto a new ATH.
Otherwise, I’d be looking at $103Kish for a great opportunity.
Interestingly enough, Gold is yet to make a new ATH.
When Bitcoin? pic.twitter.com/JDruy5ba8O
— Michaël van de Poppe (@CryptoMichNL) September 2, 2025
The liquidity map shows significant clusters of buy orders in the range of $105,500-107,000 and sell orders in the $110,000-111,000 zone. Analyst AlphaBTC suggested that the market is “hunting for money” and may first test the short area before returning to check the lows.
📈 #Bitcoin liquidity hunt 🎯
Looks like they are coming for that big cluster of shorts 110K-111k, then likely back to run the Monday low and the longs from the weekend.#Crypto #BTC pic.twitter.com/crRwauoOyq
— AlphaBTC (@mark_cullen) September 2, 2025
Earlier in September, the CEO of Bitcoin Magazine accused two whales of “stalling” Bitcoin.
Подписывайтесь на ForkLog в социальных сетях
Нашли ошибку в тексте? Выделите ее и нажмите CTRL+ENTER
Рассылки ForkLog: держите руку на пульсе биткоин-индустрии!