
Population characteristics
We included 254,825 UKB participants with both metabolomic and genomic data available after quality control. The median age was 58 years (interquartile range, IQR: 50–63 years), with 137,089 (53.79%) individuals being female and 218,380 (85.70%) individuals of white British ancestry. The median fasting time before blood collection was 3 h (IQR: 2–4 h). The study workflow is illustrated in Fig. 1, and the characteristics of the study population are delineated in Supplementary Data 1.
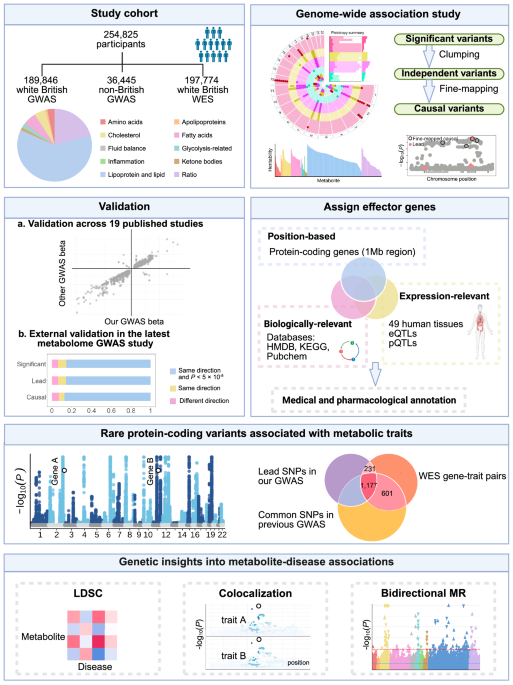
Fig. 1: Graphical summary of the study workflow and results.
Created in BioRender. Qiang, Y. (2025) https://BioRender.com/b5b9nh8. Abbreviations: GWAS genome-wide association study, HMDB the Human Metabolome Database, KEGG the Kyoto Encyclopedia of Genes and Genomes Pathway database, LDSC linkage disequilibrium score regression, MR Mendelian randomization, WES whole exome sequencing.
GWAS of 249 plasma metabolic measures and 64 derived ratios
The primary GWAS analysis included 189,846 white British participants and 7,924,871 common variants (MAF ≥ 1%) after quality control. Plasma levels of 249 metabolic measures were quantified utilizing a high-throughput NMR metabolic biomarker platform developed by Nightingale Health Ltd24. A substantial proportion of the identified metabolites were grouped into the lipoprotein and lipid category (n = 192; 77.11%), with the remaining metabolites classified as amino acids (n = 10; 4.02%), apolipoproteins (n = 3; 1.20%), cholesterol (n = 15; 6.02%), fatty acids (n = 18; 7.23%), fluid balance (n = 2; 0.80%), glycolysis-related (n = 4; 1.61%), inflammation (n = 1; 0.40%), and ketone bodies (n = 4; 1.61%) (Supplementary Data 2). The primary GWAS analysis of 249 metabolic measures identified 21,132 independent variant-metabolite associations at 3059 unique lead variants (Methods). These associations were distributed across the entire NMR metabolomic spectrum, with the majority falling into the lipoprotein and lipid category, where the number of associations per trait ranged from 24 to 152. Fewer associations were observed for non-lipid traits, ranging from 7 to 85 per trait (Fig. 2, Supplementary Data 3 and 4).
Fig. 2: Overview of the identified loci associated with 249 metabolic measures and their pleiotropy effects.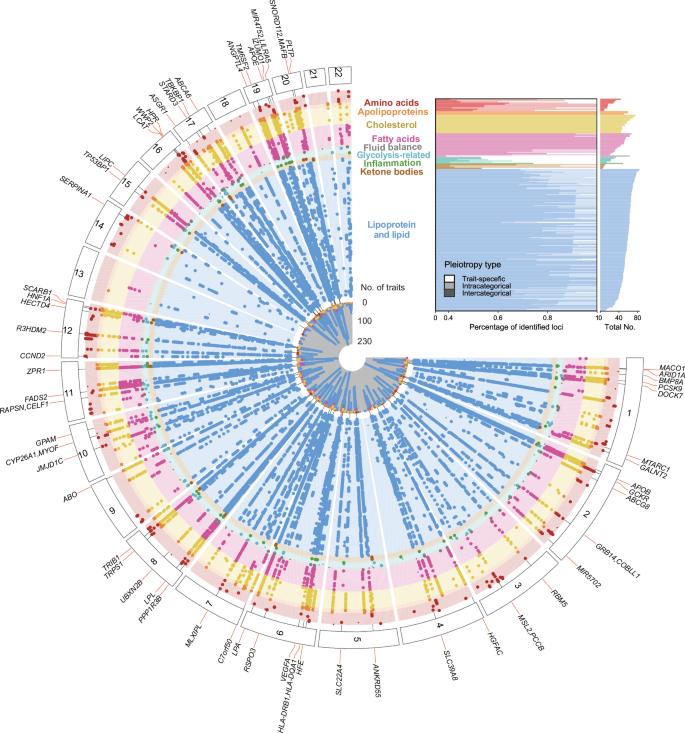
Top right inset, the number of trait-associated loci for each metabolite, grouped by their pleiotropy type. Main panel, Fuji plot illustrating the GWAS results of 249 metabolic measures across 9 categories. Each dot represents a locus-trait association, with larger dots indicating pleiotropic associations. Each radial line connects all dots for an intercategorical pleiotropic locus, which are associated with traits from more than four categories, with a locus symbol. Source data are available in Supplementary Data 8.
We also analyzed ratios of 64 metabolite pairs linked by common proteins (Fig. 3), as documented in the Human Metabolome Database (HMDB). Among these ratios, about half were within the amino acid group (n = 33; 51.56%), and approximately a quarter involved metabolites related to glycolysis (n = 17; 26.56%) (Supplementary Data 5). We identified 3306 independent associations for the 64 metabolite ratios. The number of associations per metabolite ratio ranged from 6 (isoleucine to valine ratio) to 122 (total cholesterol to total triglycerides ratio) (Supplementary Data 4). Across the 64 ratios, ratio-associated loci showed comparable overlap with both denominator-associated (0%–68.18%) and numerator-associated loci (0%–77.78%) (Supplementary Data 6). The median proportion of lead variants that showed stronger associations with the ratio than with either individual metabolite was 33.77% (IQR: 12.74%–53.04%), based on a P-gain threshold of 640. Notably, a median of 21.26% (IQR: 9.53%–57.89%) of loci were uniquely identified through ratio-based analyses, underscoring their added value in uncovering novel associations beyond individual metabolites (Supplementary Data 7).
Fig. 3: Generation of 64 metabolite ratios and visualization of their GWAS results.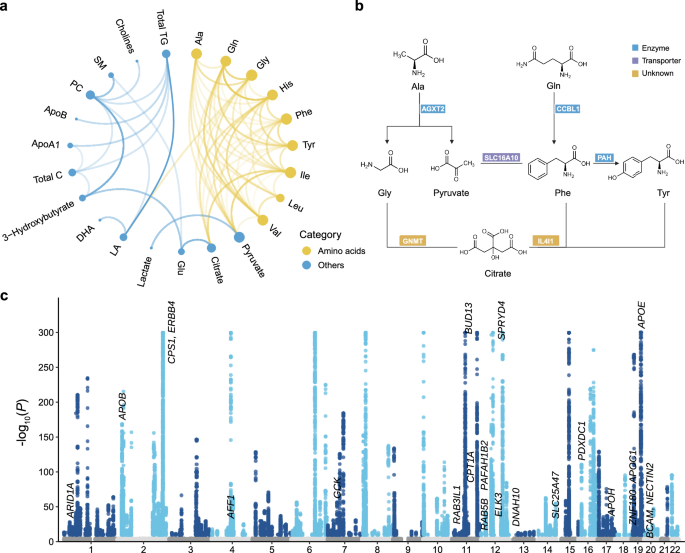
a The chord diagram depicts the generation of 64 biologically plausible metabolite ratios. Each connection represents a pathway of ratio derivation. Amino acids are denoted by yellow nodes, while metabolites in other categories are represented by blue nodes. The size of each node represents the number of metabolite ratios involving that metabolite. The darker the connecting lines, the higher the number of significant genome-wide associations for the metabolite ratios. Source data are available in Supplementary Data 5. b Examples of metabolite pairs sharing common proteins as documented in the HMDB database. Source data are available in Supplementary Data 5. c Manhattan plot displaying the GWAS results for 64 metabolite ratios. Each point represents a trait-associated locus, with its corresponding −log10(P) value on the y-axis and its chromosomal position on the x-axis. Statistical analysis was performed using an additive model of linear regression implemented in PLINK2.0. Significant variants (two-sided P < 1.6 × 10⁻¹⁰, derived from Bonferroni correction for 313 metabolic traits) are shown in colors, while insignificant ones are displayed in gray. The −log10(P) values are capped at 300. See abbreviations in Supplementary Data 2 and 5.
The linkage disequilibrium (LD) score regression intercepts25 for all 313 metabolic traits ranged from 0.99 to 1.09, with a median value of 1.04. These intercepts indicate a reasonable inflation (not substantially above 1), which can predominantly be attributed to the polygenicity of the metabolic traits4. Each independent variant explained from 0.02% to 11.13% (median = 0.04%) of the phenotypic variance of the corresponding trait, with 266 (1.09%) variants explaining ≥ 1% of the phenotypic variance (Supplementary Fig. 1).
Subgroup analyses stratified by sex revealed that 13,770 out of 24,438 lead variant–trait associations were significant in both male and female subgroups (P < 1 × 10⁻⁶; Supplementary Data 4). Sex-specific associations were identified, exemplified by rs768832539, which was significantly associated with glycine levels in females (P = 3.77 × 10-40) but not in males (P = 0.16). Interestingly, this variant has also been reported to show female-specific effects on sleep duration according to the GWAS Atlas26,27. These findings suggest that sex-specific metabolic associations may provide mechanistic insights, such as potential mediating pathways, into other important human phenotypes.
Pleiotropy, polygenicity, and heritability of metabolic measures and derived ratios
The GWAS analysis elucidated the complex genetic architecture underlying metabolites and derived ratios. The number of associations identified in each metabolite category was proportional to the number of metabolites within that category (Fig. 4a). We then assessed single-locus pleiotropy across 427 independent loci, derived from 24,438 lead variant-trait associations. The majority of these loci were associated with multiple traits (n = 323; 75.64%). Specifically, 37 loci (8.67%) were linked only to traits within the same category (intra-categorical pleiotropy) and 286 loci (66.98%) were associated with traits from different categories (inter-categorical pleiotropy) (Figs. 2, 4b and Fig. 4b, Supplementary Data 8). Notably, TRIB1 (8q24.13) exhibited the most extensive inter-categorical pleiotropy, being associated with 255 traits across 9 categories. Our results also bolster the concept of metabolites’ polygenicity. We observed that each trait was associated with a minimum of 5 independent loci, with 171 traits associated with over 50 loci. Certain metabolites, such as cholesteryl esters in large high-density lipoprotein (HDL), were associated with up to 85 loci (Fig. 2).
Fig. 4: Genetic architecture of metabolites and derived ratios.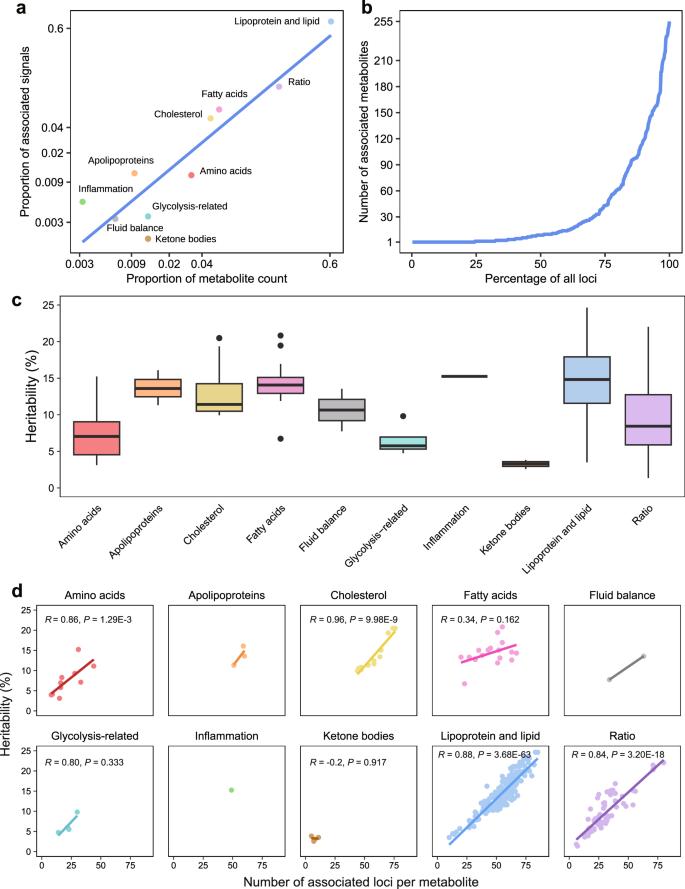
a Correlation between the number of metabolites and the number of significant genetic associations (Bonferroni correction for total metabolic traits, 5 × 10⁻⁸/313 = 1.6 × 10⁻¹⁰) within ten major categories. Data are plotted on a log scale, with each point representing a unique category of metabolites. Source data are available in Supplementary Data 3. b Distribution of the number of associated metabolites per genetic locus, illustrating the pleiotropic effects on metabolite profiles. The x-axis represents the percentage of all loci, while the y-axis quantifies the number of metabolites associated with each locus. See details in Supplementary Data 4 and 8. c Box plots illustrating the heritability estimates for metabolic traits grouped by biochemical categories. Colors distinguish different metabolite categories. Boxes represent the IQR, with the horizontal line indicating the median. Whiskers extend to the most extreme data point that is no more than 1.5 × IQR from the edge of the box, with points beyond representing outliers. The numbers of metabolites for each category are provided in Supplementary Data 2. Source data are available in Supplementary Data 9. d Scatterplots for each biochemical category, illustrating the relationship between the heritability of metabolites and the number of associated genetic loci. The fitted lines were derived from a linear regression in each facet, with corresponding Spearman’s correlation coefficients and two-sided P values provided, if applicable. See details in Supplementary Data 4 and 9.
The median estimated heritability across all 313 metabolic traits was 12.32%, with significant variability among different categories. Specifically, heritability was higher in the categories of lipoprotein and lipid (14.33%), fatty acids (13.18%), and apolipoproteins (12.85%), while glycolysis-related metabolites (5.76%) and ketone bodies (3.29%) exhibited lower heritability (Fig. 4c, Supplementary Data 9). Notably, a positive correlation was observed between the number of associated genetic loci and the heritability estimates of metabolites (Supplementary Fig. 2). Subsequent subgroup analysis revealed that four out of the ten categories showed significant associations (P < 0.05), while the lack of significance in the remaining six categories may stem from the limited number of metabolites within these categories (Fig. 4d). Additionally, we examined the pairwise phenotypic and genetic correlations among the 313 metabolic traits, revealing a highly concordant structure between phenotypic and genetic correlation matrices (Supplementary Fig. 3). Together, these findings highlight the complex genetic architecture of metabolic traits, characterized by polygenicity, pleiotropy, and a strong concordance between genetics and phenotypes.
Fine mapping reveals candidate causal variants
We next performed fine-mapping analysis using the FINEMAP software28 to prioritize genetic variants most likely to have a direct effect on metabolic traits29,30. We created 2-Mb regions centered on each index variant and merged any overlapping regions associated with the same metabolite. Among the 14,661 unique regions, we identified 35,338 distinct signals. In the identified credible sets, 13,597 signals were fine-mapped to 5 or fewer variants with a posterior probability of including the causal variant P > 0.99; at 6620 trait-associated loci, we resolved the signal to a single nominated causal variant (Fig. 5a and Supplementary Data 10). We identified 3610 unique variant–metabolite associations with a posterior probability P > 0.99 for being the causal variant. Overall, the putative causal variants demonstrated an inverse relationship between their effect allele frequency and absolute effect size (Supplementary Fig. 4). Of these, 2871 overlap with the 24,438 independent associations identified through clumping analysis. Notably, cholesteryl esters in large HDL and triglycerides to total lipids in very small very low-density lipoprotein (VLDL) percentage had the most fine-mapped causal variants, while no potential causal variants were detected for isoleucine to leucine ratio. The 3610 potential causal signals accounted for 0.03% (isoleucine to valine ratio) to 15.21% (omega-3 fatty acids) of the residual trait variance (Fig. 5b and Supplementary Data 11). Each causal variant explained 0.002% to 11.78% of the phenotypic variance (median = 0.09%), with 244 variants explaining ≥ 1% (Supplementary Fig. 5).
Fig. 5: Summary of fine-mapped associations across 313 metabolic traits.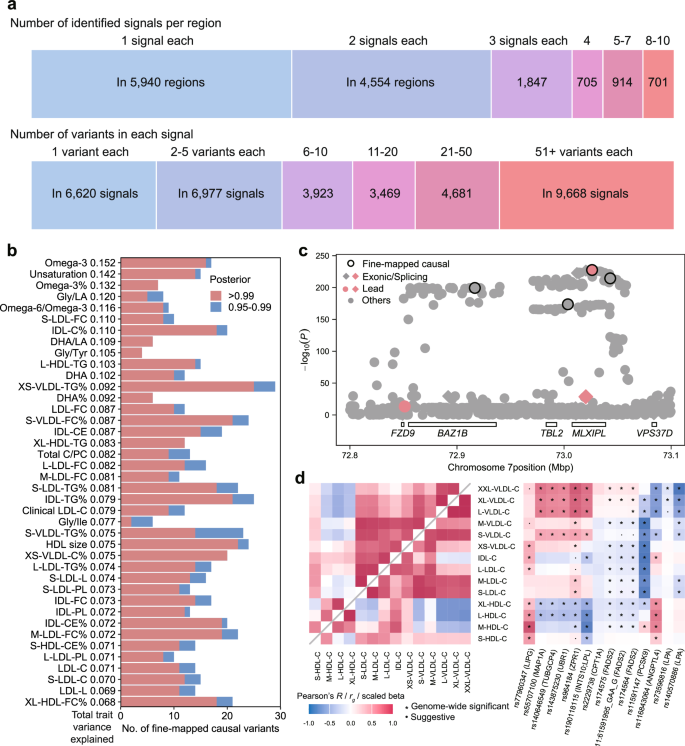
a FINEMAP summary. At the top, the numbers of association signals identified in each region that contains at least one independent association are shown. This includes a single signal in 5940 regions and 2–10 signals in 8721 regions across 313 metabolites. At the bottom, the numbers of candidate causal variants in the credible set with ≥ 99% posterior probability are displayed. For example, 6620 signals were mapped to a single variant in the credible set across 313 traits. Source data are available in Supplementary Data 10. b Breakdown of the number of fine-mapped variants. Red bars represent causal variants with a posterior probability greater than 0.99. Blue bars represent causal variants with a posterior probability between 0.95 and 0.99. The x-axis shows the number of fine-mapped causal variants, and the y-axis indicates the total variance explained by those variants with a posterior probability greater than 0.99. The 40 traits with the highest total variance explained are displayed. Source data are available in Supplementary Data 11. c A regional association plot showing the fine-mapping result for XS-VLDL-TG% at the MLXIPL loci, based on GWAS summary statistics. Fine-mapped variants are indicated by black outlined points. Exonic or splicing functional variants are represented as diamonds. Lead variants are highlighted in red. The raw two-sided P values are provided. d Heatmaps of phenotypic (top left inset) and genetic (bottom right inset) correlation structure of cholesterol in lipoprotein subclass particles (left) and the association landscapes of variants associated with degree of unsaturation (right). Pairwise Pearson’s correlation coefficients and genetic correlations (left), and effect estimates for the variant–metabolic trait associations (right) are represented as a color range. Stars indicate genome-wide significance and dots indicate suggestive associations. The variant effect sizes were scaled relative to the absolute maximum effect size in each region. The effect allele for each variant is shown. Each column represents a variant, and each row corresponds to a metabolic measure. Two-sided tests were used for statistical analysis. Source data are available in Supplementary Data 12. See abbreviations in Supplementary Data 2 and 5.
The putative causal variants identified through fine-mapping may exert their effects through multiple independent genetic mechanisms. For instance, at the MLXIPL locus, we revealed several alleles associated with genetic regulation of the triglycerides to total lipids in very small VLDL percentage. Through fine-mapping, we pinpointed three primary causal signals: an intronic variant in MLXIPL (rs13234378, β = −0.16, P = 2.97 × 10−228), and two intergenic variants near TBL2 (rs573252567, β = −0.15, P = 1.93 × 10−174) and VPS37D (rs34958196, β = −0.15, P = 3.44 × 10−215) (Fig. 5c). Notably, among the likely causal variants identified in this locus, one was a lead variant pinpointed through clumping analysis while the other two were not. Functional annotation using the FAVOR database31 revealed that rs13234378 and rs573252567 are located in active enhancer flanking regions (EnhAF), while rs34958196 resides in a poised promoter region (PromP), suggesting potential regulatory roles for these noncoding variants.
To investigate how lipid-related loci affect lipoprotein metabolism, we focused on putative causal variants associated with unsaturation degree of fatty acids. This trait may reduce cardiovascular risk by altering lipoprotein composition, increasing HDL cholesterol and lowering low-density lipoprotein (LDL) cholesterol32,33. We standardized effect estimates to range from −1 to 1 by dividing each estimate by the strongest association effect estimate observed across all metabolic traits within each region, minimizing the influence of statistical strength and highlighting overall patterns10. Distinct patterns emerged between the variants and cholesterol levels (Fig. 5d, Supplementary Data 12). For instance, the missense SNP rs77960347, which is putatively damaging and leads to a loss of function of LIPG, was positively associated with cholesterol levels across all lipoproteins. Endothelial lipase, encoded by LIPG, preferentially hydrolyzes HDL cholesterol over other lipoproteins34,35, supporting our finding of a stronger association between rs77960347 and HDL cholesterol. On the other hand, rs174575, 11:61591995_GAA_G, and rs174564 in FADS2 were associated with increased cholesterol levels in larger VLDL, but with decreased cholesterol levels in smaller VLDL, LDL and larger HDL. These three intronic variants may exert regulatory effects, as they are located in promoter (marked by H3K4me3 and H3K9ac) and enhancer (marked by H3K4me1 and H3K27ac) regions across multiple tissues, according to the Roadmap Epigenomics project36. Fatty acid desaturase, encoded by FADS2, regulates fatty acids unsaturation37 and has been implicated in atherosclerotic cardiovascular diseases38,39. The lipid profile alterations linked to these variants may explain FADS2’s role in cardiovascular risk, though the underlying mechanisms for the differential effects across lipoprotein subclasses warrant further experimental investigation. Overall, genes containing these variants, such as LIPG, FADS2, PCSK9, and ANGPTL4, play key roles in cholesterol and fatty acid metabolism, glucose homeostasis, and insulin sensitivity34,40,41,42,43,44. These findings further advance our understanding of the complex effects of genetic variants on lipoprotein metabolism.
GWAS validation and novelty assessment
To identify previously reported associations and assess whether they were replicated in our study, two methods were employed. First, we compiled a list of 19 representative metabolomics GWAS with overlapping metabolites and genomic variants to our study (Supplementary Data 13). For each of these studies, we compared our estimated effect sizes for each significant variant against those reported in earlier GWAS studies (P < 5 × 10⁻⁸ or more stringent). This comparison demonstrated substantial concordance across the datasets, with a median Spearman’s correlation of 0.98 (IQR: 0.90–0.99), and 1164 of 1327 pairwise comparisons achieving Bonferroni-corrected significance (P < 0.05/1327 = 3.77 × 10⁻⁵; Supplementary Data 14, Supplementary Fig. 6). Correlations were higher for studies including UKB samples (median R = 0.99) than for those without (median R = 0.93). Sensitivity analyses using less stringent thresholds yielded consistent results (Supplementary Data 15). Of the 3610 potential causal associations identified, 2785 were previously reported, 40 were in LD with previously known variants, and 785 associations were considered novel.
Second, we compared our results with those from the latest published GWAS study on circulating NMR metabolic traits, which included 136,016 participants across 33 cohorts10. We observed that 73% of the lead variants identified in this study were validated in our results (P < 5 × 10⁻⁸ and consistent effect direction), whereas 47% of our lead variants were validated by this study (Supplementary Data 16).
We also performed a validation analysis on the lead variants identified in the discovery cohort using samples from 36,445 individuals of non-British ancestries. While the effect sizes were highly correlated with those from the discovery cohort (median Spearman’s correlation coefficient R = 0.96, IQR 0.94–0.97, Supplementary Data 17), only 24% of the variants in the validation cohort reached genome-wide significance and had the same effect direction as in the discovery dataset, which may be partly attributed to the smaller sample size10. A pan-ancestry meta-analysis of the lead variants largely confirmed the primary results (median Spearman’s R = 1.00), with 85% of variants showing more significant P values than in the primary analysis.
Identification of potential effector genes
Metabolites are not directly encoded by genes, but are linked to gene-encoded proteins through various biological processes including synthesis, degradation, conversion, secretion, and transport. To identify the potential effector genes for metabolites, evidence should be integrated from multiple dimensions. For each putative causal variant, we first retrieved the 20 nearest protein-coding genes within a 1-Mb genomic region. These candidate genes were filtered based on biological evidence from multiple specialized databases, and co-localization analyses with eQTL and pQTL summary statistics (Methods). Genes with both biological and colocalization evidence were designated as effector genes, leading to the annotation of 71 variant-metabolite pairs. For the remaining 3539 pairs not annotated through this approach, the nearest genes were assigned.
In total, we assigned 221 unique genes to 312 metabolic traits (Supplementary Data 18 and 19). Notably, we linked GCKR to 205 metabolites across diverse categories based on genomic proximity, suggesting its well-established role in glucokinase regulation may have far-reaching metabolic implications beyond glucose homeostasis. We also identified novel genes closely associated with metabolites. For instance, LDHB encodes the B subunit of lactate dehydrogenase, which catalyzes the reversible conversion of pyruvate and lactate45. LDHB eQTLs colocalized with both pyruvate levels and the lactate to pyruvate ratio. The variant rs138560021 emerged as the likely shared causal variant, showing negative associations with LDHB expression (β = −0.33, P = 9.82 × 10⁻⁷) and the lactate to pyruvate ratio (β = −0.10, P = 1.22 × 10⁻¹³), and positive association with pyruvate levels (β = 0.09, P = 2.05 × 10⁻¹³). These consistent directional effects suggest that reduced LDHB expression may disrupt pyruvate-lactate balance, in line with the enzyme’s known biological function.
To understand the clinical and pharmacological relevance of the 221 effector genes, we systematically searched these genes across reference databases. We identified 89 associated Mendelian diseases from the Online Mendelian Inheritance in Man (OMIM) database46, 471 drugs at different development phases from the DrugBank database47, and 124 phenotypic changes in knockout mice from the International Mouse Phenotyping Consortium (IMPC) database48 (Supplementary Data 20).
Rare protein-coding variants associated with metabolic traits
Next, we aimed to identify rare coding variants associated with metabolic traits, as they often confer larger effect sizes and are more likely to implicate causal genes. We leveraged WES data from 197,774 UKB participants of white British ancestry, yielding 10,662,863 rare variants after strict quality control.
We conducted rare-variant aggregation tests using ten models based on two functional categories (Loss-of-function [LOF] variants alone or in combination with missense variants), five MAF bins (1%, 0.1%, 0.01%, 0.001%, and 0.0005%), as well as ten gene-based tests including burden, ACAT, SKAT, and their respective omnibus or joint tests (Methods). Overall, we identified 2948 significant gene-metabolite pairs, involving 126 genes across 308 metabolic traits, at a Bonferroni-corrected threshold of 0.05/(313 × 19,559) = 8.17 × 10⁻⁹ (Supplementary Fig. 7, Supplementary Data 21). Of these, 1,804 signals were identified using the LOF mask, 2827 using the combined LOF and missense variant mask, and 33 were uniquely identified through joint tests in REGENIE, which integrate burden masks generated from these two annotation classes as well as all MAF thresholds. The higher carrier frequency of missense variants in the population compared to LOF variants likely contributes to the increased discovery power when both are combined. Among all aggregation tests, burden tests identified the most associations (n = 2712), including 171 unique to this method. ADD-SKATO-ACAT ranked second with 1169 associations, 104 of which were unique. The strong performance of the burden test suggests that rare coding variants associated with metabolites generally have consistent effect directions and magnitudes, aligning with the assumptions of this test. A total of 1910 gene-trait associations were replicated in both male and female subgroups (P < 0.05/2948). The numbers of genes associated with each trait ranged from 1 to 20, with a median value of 10. Exome-wide aggregate-based analyses showed good calibration of P-values across all performed tests, as indicated by genomic inflation factors consistently below 1.06 (Supplementary Data 22). We then compared our findings to published metabolite GWAS, and the lead variant-trait associations identified in our GWAS. Notably, examining the genes annotated for single variant associations, we showed that of the 2948 gene-trait pairs identified, 1778 had associations involving common variants in previous GWAS, 1408 had associations involving lead variant identified in our GWAS, and the remaining 939 pairs provided new insights that complemented the GWAS findings. These results underscore the added value of WES, potentially benefiting from its deep coverage and enhanced sequencing accuracy in protein-coding genes.
We then performed conditional analyses to determine whether our signals were independent of nearby common variants. We modeled our gene-trait pairs while conditioning on nearby (< 1 Mb) LD-independent common variants identified in our GWAS. Among the 963 gene-trait pairs in which at least one nearby common associated variant (±1 Mb) was directly mapped to the WES genotype, the effect sizes and P values were not substantially attenuated in 904 pairs (93.87%, Supplementary Data 21), indicating the independent role of rare variants on metabolic traits.
We compared our findings with a recent WES study of metabolic traits involving 99,283 UKB participants by Nag et al.19. Among the 244 metabolites analyzed in both studies, we identified 2524 significant gene–metabolite associations. Of these, 1357 (53.76%) overlapped with those reported by Nag et al., while 1167 (46.24%) were novel (Supplementary Data 23). Conversely, of the 1476 associations reported by Nag et al., 1357 (91.94%) were confirmed in our analysis. These results demonstrate both the robustness of our approach in replicating known associations and its power to uncover novel gene–metabolite pairs.
Genetic insights into metabolite-disease associations
To explore the disease relevance of the plasma metabolome, we examined genetic correlations between 313 metabolic traits and 2179 clinical traits (Supplementary Data 24), uncovering 75,927 metabolite-disease pairs with genetic overlap (Supplementary Fig. 8). The extensive genetic correlations prompted further colocalization analysis, resulting in the identification of 72,538 metabolite-disease pairs with shared genetic determinants (Supplementary Data 25). Next, we conducted two-sample MR analyses for the colocalized pairs. Notably, reverse MR analysis revealed bidirectional causal relationships for half of the significant main MR results, including reverse causation between type 2 diabetes (T2D) and glucose. We ultimately identified 36 potentially causal associations that remained significant in both main and sensitivity MR analyses while showing no evidence of reverse causality (Methods, Fig. 6a, Supplementary Data 26–29). Among those, glucose associated with the most diseases (n = 9), followed by acetate (n = 4), the glucose to sphingomyelins ratio (n = 3) and free cholesterol in large HDL (n = 3).
Fig. 6: Genetic insights into metabolite-disease associations.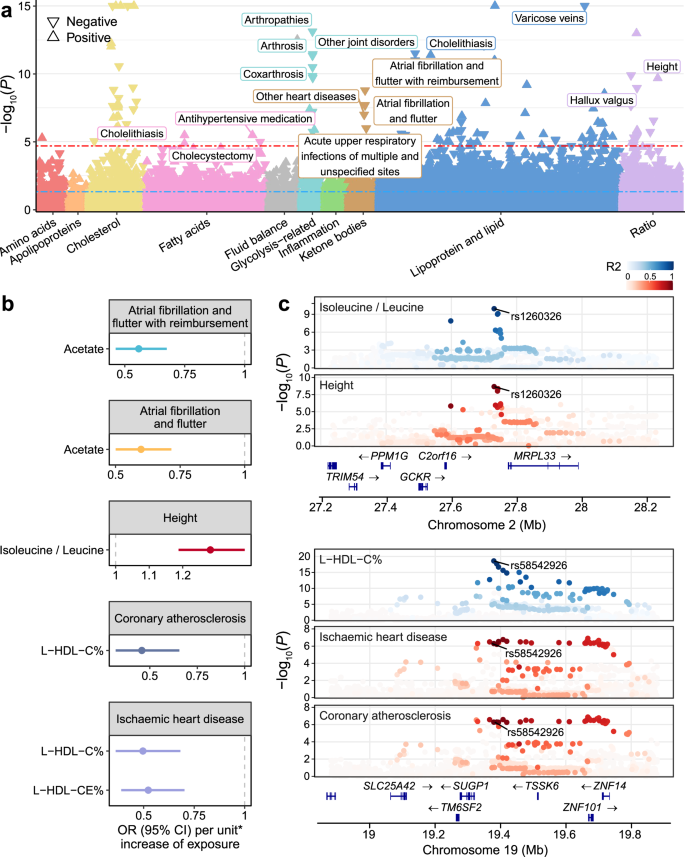
a Manhattan plot showing the association results from main MR analyses of metabolite-disease pairs with colocalization evidence. Metabolites are labeled on the x-axis, with color coding to distinguish different categories. Statistical analysis was performed using the Wald ratio method for single-instrument cases and the IVW method when multiple instruments were available. For each metabolite category, the four most significant diseases that remained robust in sensitivity analyses and were not significant in reverse MR are labeled. The −log10(P) values are presented on the y-axis, which is capped at 15. Significance thresholds are marked by a blue dashed line at P < 0.05 and a red dashed line indicating corrections for multiple testing (FDR–corrected Q < 0.05, equivalent to P < 2.09 × 10⁻⁵). Arrows reflect the impact on disease risk per unit increase in metabolic trait, with upward arrows indicating increased risk and downward arrows suggesting decreased risk. Source data are available in Supplementary Data 26. b Forest plots depicting results for metabolite-disease pairs of interest. Odds ratio estimates (central points), 95% confidence intervals (error bars) and two-sided P values were derived from two-sample MR analysis using the IVW method. An asterisk (*) indicates one standard deviation of the log-normalized value of the metabolic traits. Source data are provided in Supplementary Data 26. c Stacked regional plots illustrating the colocalization (PP.H4 > 0.8) of metabolite-disease pairs. Colocalization analysis was performed using coloc R package with Bayesian approach. A two-color gradient displays LD (R²) with the candidate causal variant pinpointed through colocalization analysis. Blue represents metabolic traits, while red indicates clinical diseases. P-values shown are two-sided and not adjusted for multiple comparisons. Source data are provided in Supplementary Data 25. See abbreviations in Supplementary Data 2 and 5.
We replicated well-known relationships, such as the positive associations between glucose and gestational diabetes, supporting the robustness of our analytical framework. Similarly, we found that free cholesterol in large HDL was negatively associated with cholelithiasis, in line with previous observational studies reporting that dyslipidemia often accompanies gallstone formation49. Beyond these known associations, we also identified several less-studied findings. Notably, strong evidence of colocalization was observed between acetate and atrial fibrillation and flutter at rs4766897 in ACAD10. MR analysis demonstrated that genetically predicted plasma acetate levels were associated with a reduced risk of atrial fibrillation and flutter (odds ratio [OR] = 0.60, P = 2.07 × 10⁻⁸), suggesting a potential beneficial role of acetate in cardiovascular diseases, which was also reported in a previous study50 (Fig. 6b, c).
Beyond individual metabolites, our analysis extended to explore relationships between metabolite ratios and various diseases. Notably, genetically predicted values of the isoleucine to leucine ratio were positively correlated with height (OR = 1.28, P = 2.10 × 10⁻¹⁰), with strong evidence of colocalization at rs1260326 in GCKR. Isoleucine and leucine, two branched-chain amino acids (BCAAs), play crucial roles in skeletal muscle metabolism and growth regulation51,52. However, the imbalance of BCAAs may adversely affect growth. This phenomenon aligns with a previous study showing that excessive leucine levels, which lead to relatively isoleucine deficiency, impaired the growth of chicks53. Furthermore, we found that higher genetically predicted levels of cholesterol to total lipids percentage and cholesteryl esters to total lipids percentage in large HDL were associated with a reduced risk of ischemic heart disease. Additionally, cholesterol to total lipids percentage in large HDL was inversely associated with the risk of coronary atherosclerosis.