
Typically, the final GDP data rarely causes market fluctuations, but the U.S. second-quarter economic growth figures released on Thursday (September 25) were an exception, giving bullish dollar traders an edge. On Friday (September 26), during the Asian session, the U.S. Dollar Index stabilized near the high of 98.38, largely retaining gains from the previous two trading sessions.
The annualized quarterly GDP growth rate was revised up from 3.3% to 3.8%, marking the fastest pace since the third quarter of 2023. Consumer spending rose from 1.6% to 2.5%, while sales were revised upward from 6.8% to 7.5%. Inflation in the second quarter also edged higher, with the PCE price index revised to 2.1%, and core PCE remaining at 2.6%.
This data has led markets to question the Federal Reserve’s path of interest rate cuts. Derivatives markets now predict an 83% probability of a rate cut in October, down from near certainty earlier in the week. Expectations for rate cuts in December and further reductions in 2026 have also weakened.
 The yield curve rose across the board, with the 2-year yield climbing by 7.3 basis points to 3.6% (more than twice its one-year daily average volatility of 3.5 basis points), the 10-year yield rising by 9.3 basis points, and the 30-year yield increasing by 9.5 basis points.
Technical Analysis of the U.S. Dollar Index
The 96 level continues to provide solid support for the U.S. Dollar Index, which not only formed a key low in 2023 but also successfully bottomed out twice in 2025. Recently, the Dollar Index appears to be staging a countertrend rebound, but the key question is how much upside potential remains. Given that the Fed is unlikely to consider rate hikes at this stage, achieving a full 6% rebound seems challenging. However, as the market overall still holds net short positions, there remains potential for further short-term upside in the dollar.
The 14-day Relative Strength Index (RSI) is above the midline, reinforcing bullish momentum.
According to Elliott Wave Theory, the 100% projection of wave a following wave b converges with the recent cyclical high and the 50-week moving average (102.44), forming a dense resistance zone below the 100 level. If this area is successfully breached, the subsequent move may challenge the 50-week simple moving average (102.44) and the 138.2% Fibonacci projection (near 102).
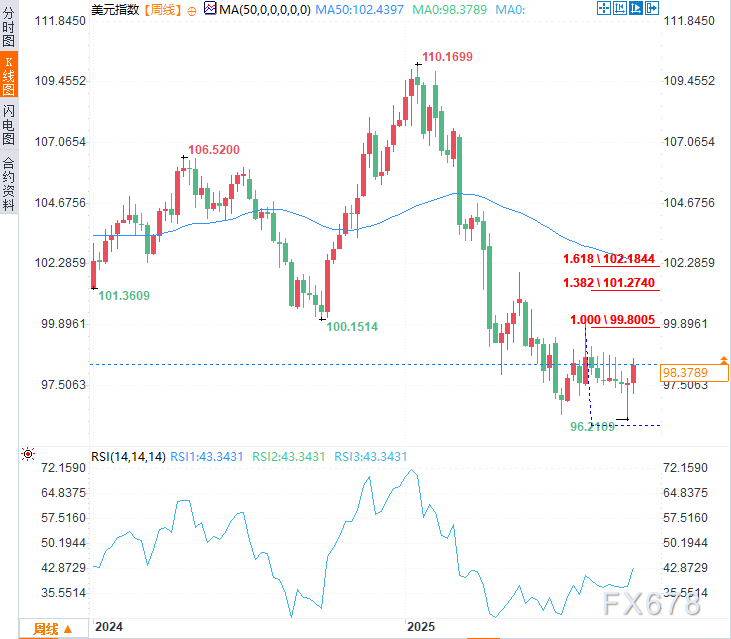
(Weekly chart of the US Dollar Index, source: Yi Huitong)
Given the political pressure from the Trump administration for interest rate cuts and the Federal Reserve’s stance, the baseline scenario remains that any rise in the US dollar is a technical correction rather than the start of a new upward trend.
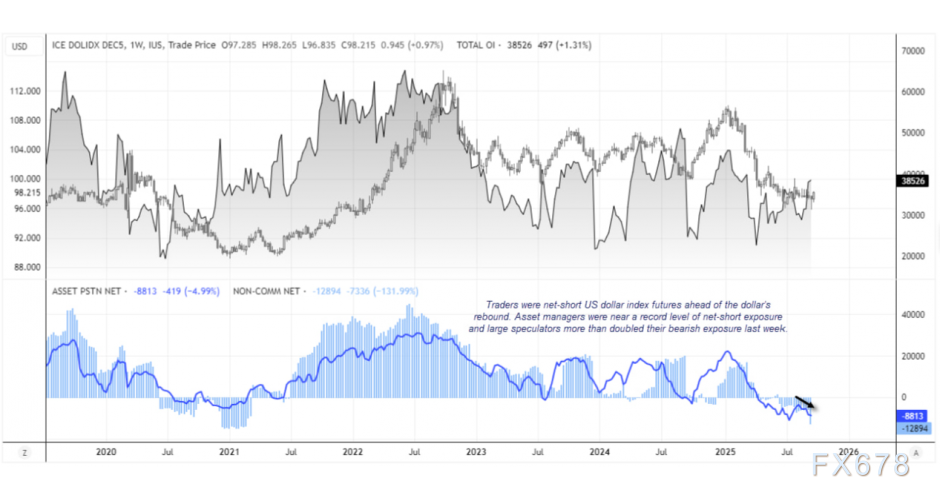
US Dollar Positioning Analysis: Interpretation of the COT Weekly Report
The latest Commitment of Traders (COT) report shows that the market still maintains a net short position in US Dollar Index futures. Large speculators more than doubled their net short exposure last week, mainly due to significant long liquidation, pushing short positions to a four-year high. Asset management firms also reached a net short position of -8.8 thousand contracts, close to historical extremes. Currently, both groups seem to be positioned incorrectly – as the market recalibrates expectations for Federal Reserve rate cuts, the US dollar has begun a counter-trend rally.
At 11:20 Beijing time, the US Dollar Index was trading at 98.39.