

This is the fourth of a six-part series looking at figures who have played a pivotal role in a modern football success story. The first piece, on the rebuilding of Ajax, can be found here. Part two, on Belgium becoming No 1 in the FIFA Rankings is here. And part three, on the rise of Croatian football is here.
Each article comes with a related podcast, which can be found here on The Athletic FC Tactics Podcast feed.
“All this data analysis in football is bulls**t, isn’t it?”
Ian Graham had been hired to assist Spurs’ recruitment team, but his first meeting with Michael Edwards, his boss at Tottenham Hotspur, and future sporting director at Liverpool, was not going well.
“It was long and aggressive,” Graham explains. “I called my boss (at Decision Technology — an analytics company) up after the meeting and said I thought Spurs are going to drop us, because they clearly think we’re idiots. But he wanted to find out the answer. The way he asked them, I thought he was trying to make me look stupid, but he was honestly trying to gauge the quality of what we were doing.”
Working under Edwards and Jurgen Klopp at Liverpool, Graham’s work helped turn the club into Premier League and European champions, transforming the squad in the process.
But his first experience was typical of many of the first data pioneers of English football. They have now, however, broken through — their work becoming mainstream across recruitment, training methodology, and even the sport’s dialect.
“When I started, realistically the brief was: ‘We’ve got lots of data, we think there’s some value in it, can you find something?’” says Sam Green, a former data analyst at Opta who went on to work at Aston Villa. “That was it. It wasn’t like we wanted to change football.”
“You’re seeing fans having online arguments about expected goals (xG) and player age,” adds Graham. “But at least they’re arguments about things that make sense — things that clubs actually worry about, rather than the old, ‘Who’s best in the dressing room?’ stuff.”
Generally, the birth of football’s data revolution is dated back to the mid-2000s, although companies such as Opta and Prozone had been collecting data since the late 1990s. Back then, even if the ideas were sound, the battle its proponents faced was for people to believe in it.
Part of the issue was the existing data’s limitations. Baseball, the poster-child for the analytics movement, had a dataset going back decades — in contrast, when Graham began at Spurs, he had only two seasons to work with, with many foreign leagues completely inaccessible. While in baseball, statistics recording the outcome of every pitch told analysts what actually happened — high inside, low outside, where hit, how out — football’s existing data did not necessarily do the same. What inherent value was there in knowing a player completed 19 passes?
“Football is one of the most complex sports to analyse, just because of the sheer number of people involved,” explains Green, one of the key players in the invention of xG. “You need to worry about the dynamics of how those 22 players are interacting, and it just makes it much harder. After calculating the simple, event-based data, you don’t hit a wall as such but it becomes more and more expensive, and the number of people with access just gets smaller and far less public.”
“What is a pass, what is an aerial challenge, what is a clearance?” asks Sarah Rudd, one of the first full-time in-house data analysts at Arsenal. “It’s actually quite difficult. Was that player trying to cross or shoot? There’s a lot of ambiguity around these things, so getting agreement across data collectors is tricky. And that creates this whole mess where we can’t even really define a pass or a shot, and now are trying to build complex models on top of it.”
Many analysts in the 2000s found themselves tarred by the reputation of Charles Reep — a visionary in many ways with his painstaking, handwritten analysis into play patterns in the 1950s — but who was ultimately widely criticised for his conclusions, preaching long ball football over all other styles. His ideas were later propagated by the likes of Charles Hughes in the 1980s, arguably setting back English football stylistically by decades. In his book, How to Win the Premier League, Graham describes former Liverpool head coach Brendan Rodgers raising this example.
But by this point, however, Graham had a supporter in Edwards, who had begun to see the value in his work.
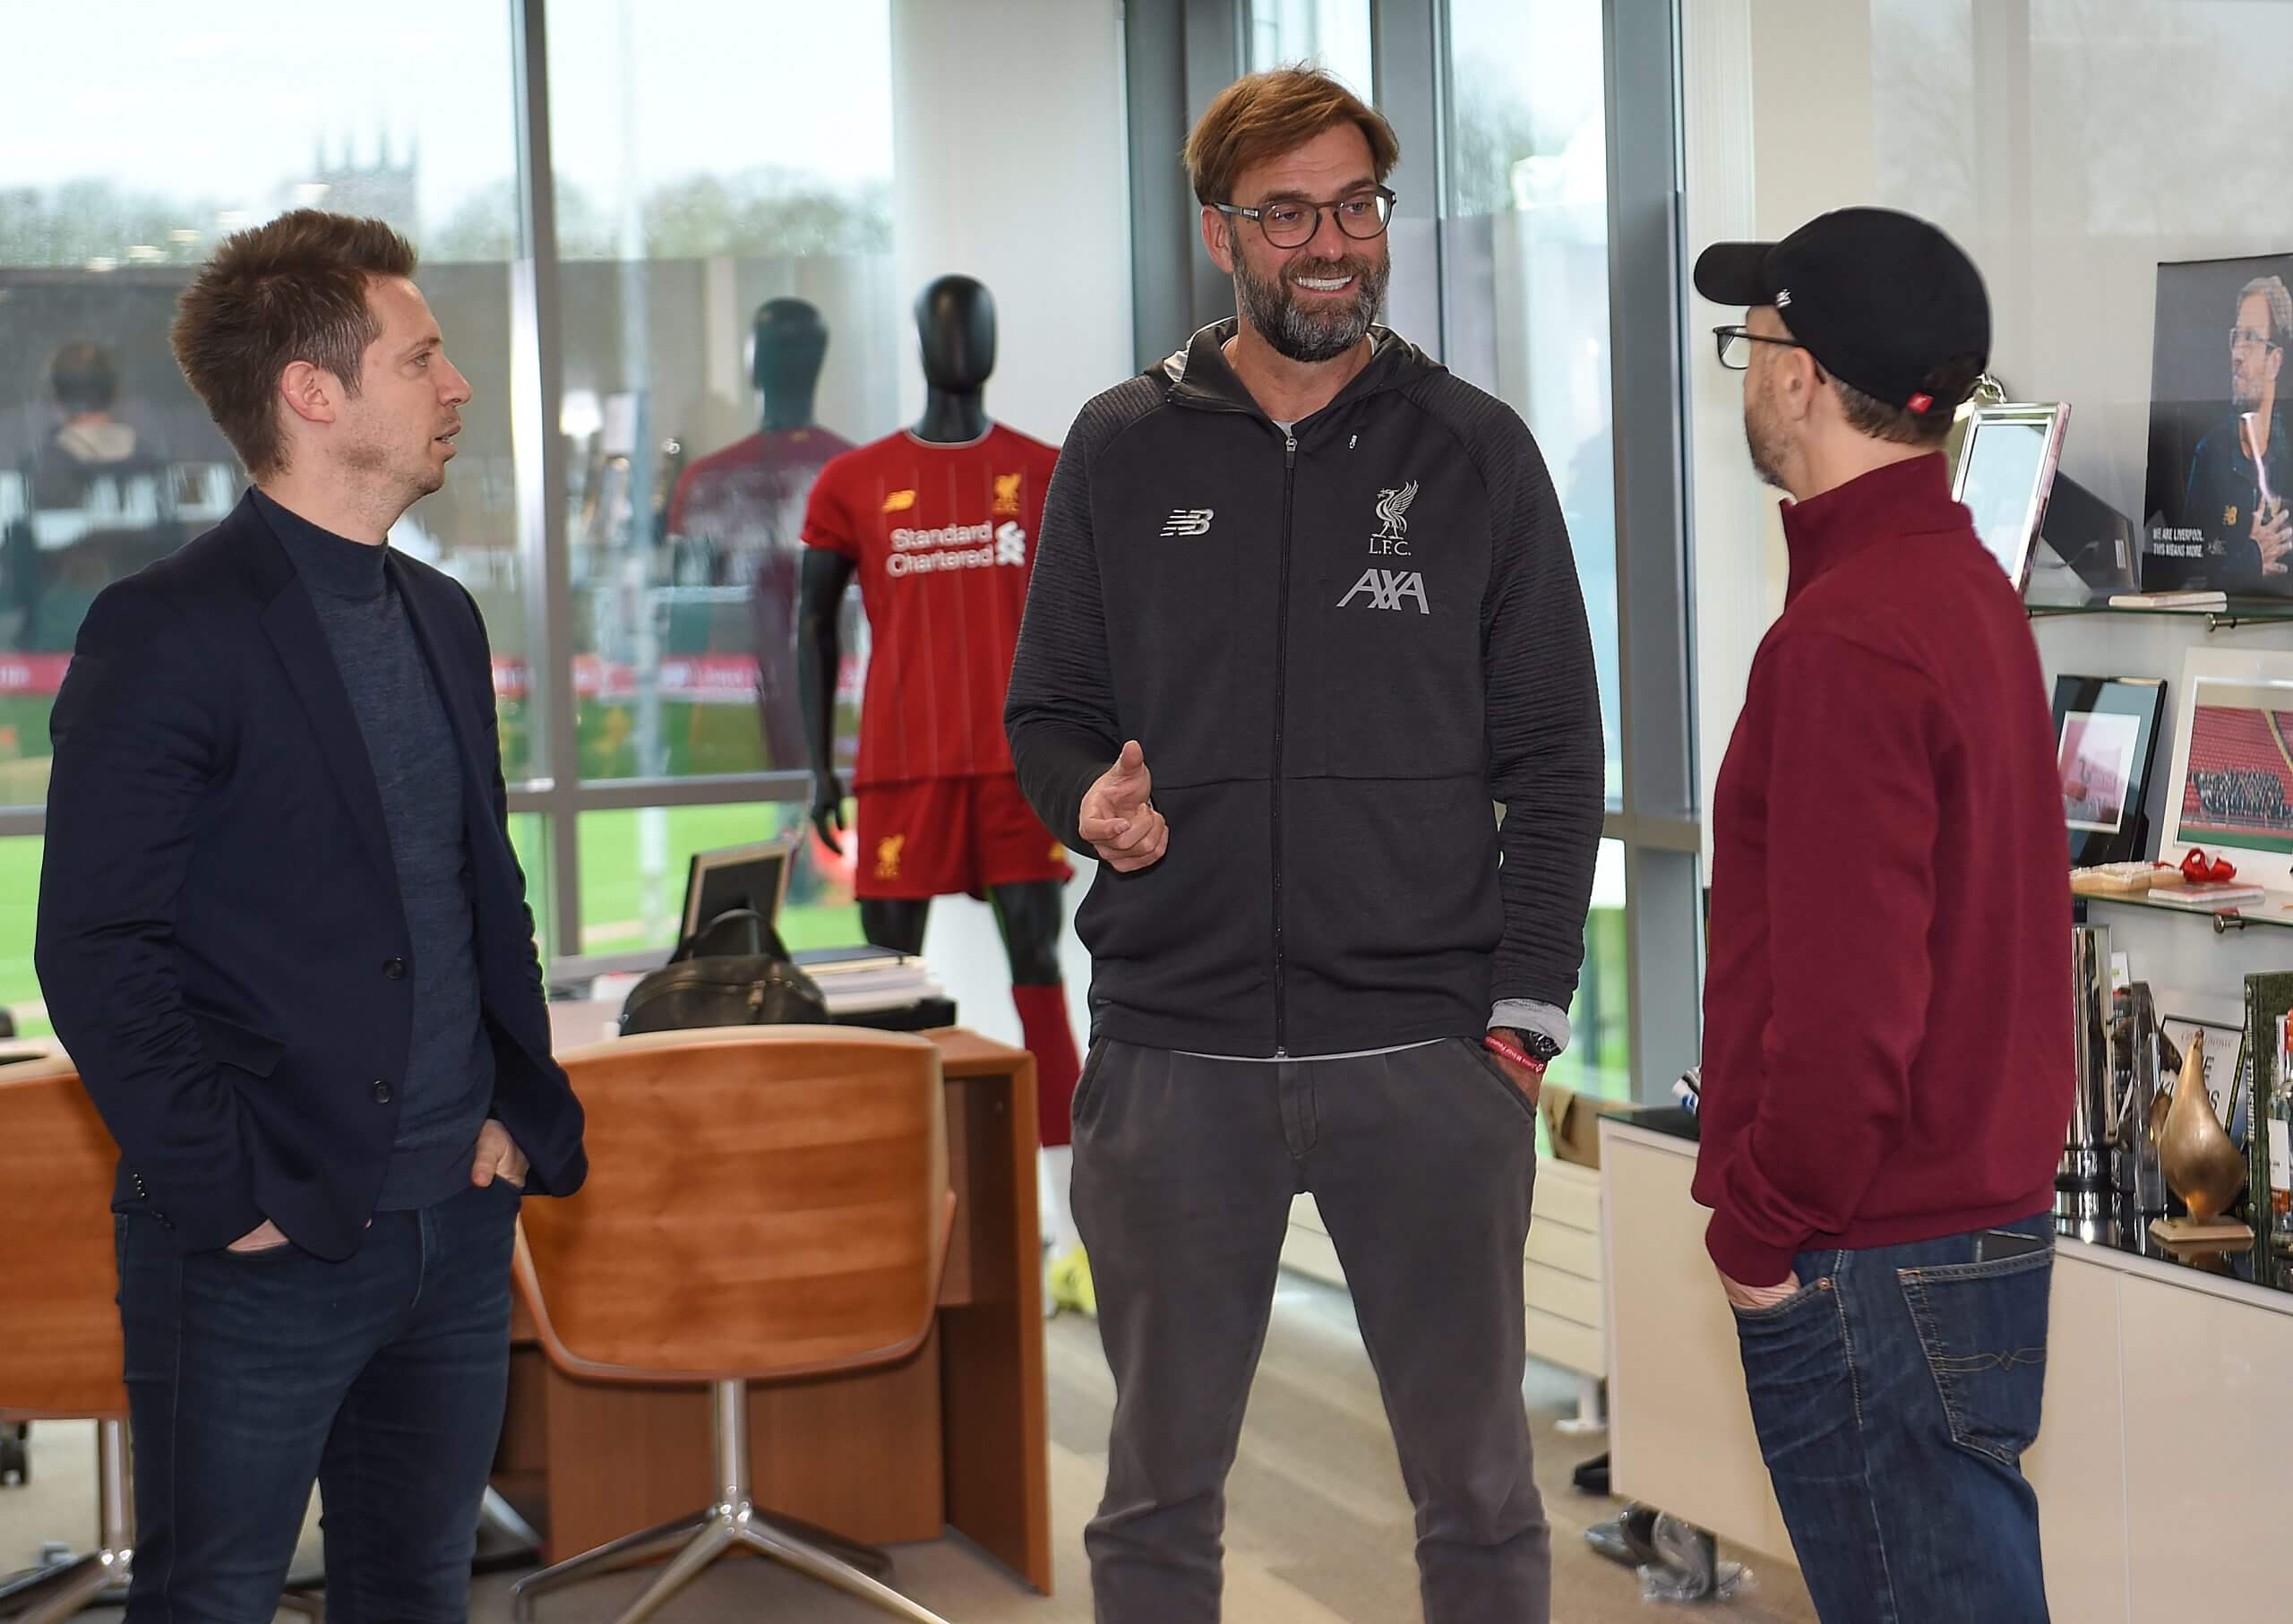
Michael Edwards (left), with Jurgen Klopp in 2019 (John Powell/Liverpool FC via Getty Images)
“Part of the reason that Michael was initially sceptical was that he started off as a Prozone analyst, where he was employed to produce statistical reports for the Portsmouth coaches,” Graham explains. “But he knew Harry Redknapp and his assistants would have thrown him out the room, because the report was kind of useless — showing number of sprints and total distance. Michael was a youth player; he knew from his football intuition that it didn’t tell you anything about the game.
“So part of his scepticism was because he had seen it done badly before. We had a very early version of expected threat (the chance of scoring based on the ball’s current location) and he started tearing down all of the assumptions in it. ‘Sometimes the backwards pass is the best option’, he would say, which we had to admit we could not see in the data.
“Luka Modric was the player we disagreed on most (when both were together at Spurs). We said he was an above-average player but not top 10 in the Premier League. Michael insisted he was by far the best player in our squad, and he was right, because his skills didn’t come across very well in the event data.”
It speaks to a near-universal experience faced by these early analysts. Despite being typecast as ‘numbers people’, at times, their most important skill was a social one — possessing the ability to communicate their work within a club in order to display its value.
“Social skills may be pushing it a little bit; we’re all introverts — that’s your standard personality type,” says Graham. “But you have to communicate. Richard Feynman, the Nobel Prize-winning theoretical physicist, is a great example. He works on complex stuff, quantum mechanics, but has this quote that if you can’t explain your theory in five minutes to somebody serving you a beer at your local bar, you don’t understand that theory.
“A lot of football club staff are not data experts — they shouldn’t be data experts, they have too many other calls on their time and haven’t had the luxury of spending three years on a maths degree. But they’re usually intelligent people, enthusiastic, and it’s your job as the data person to explain in clear football language how your model works.”
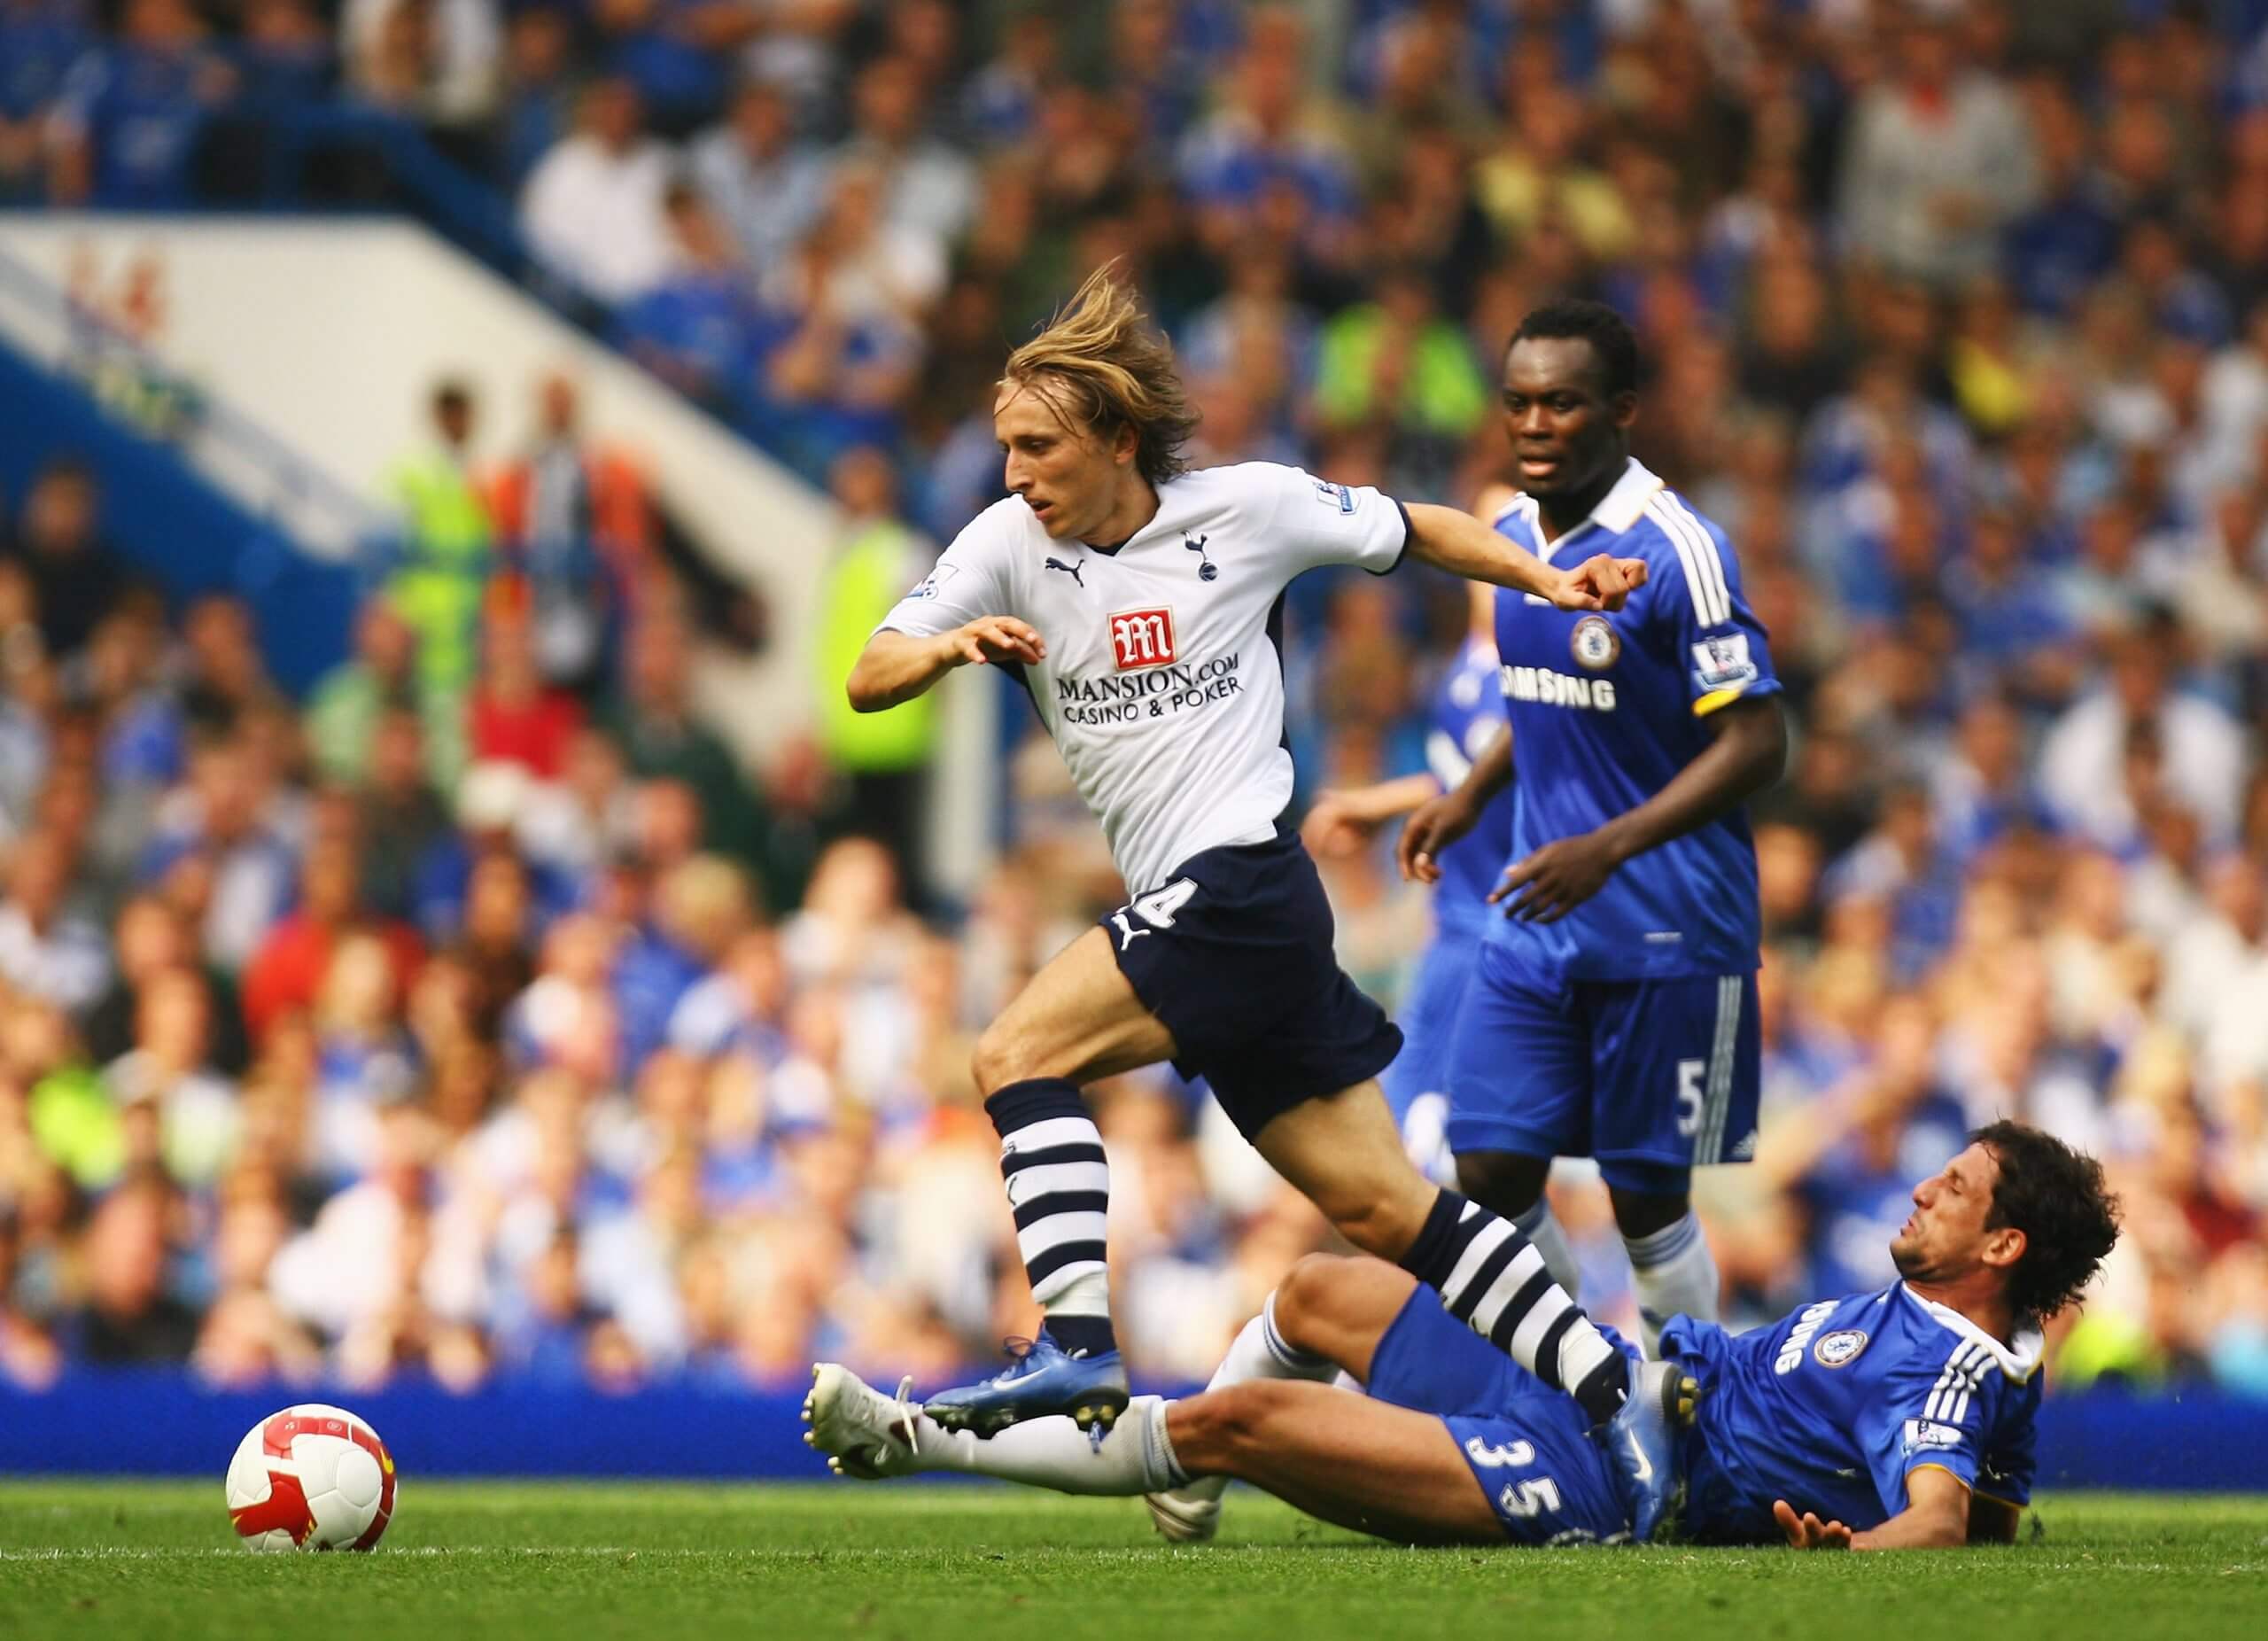
Luka Modric’s event data did not do justice to his impact on the pitch (Ian Walton/Getty Images)
Over at Arsenal, Rudd worked for an early analytics company named StatDNA, who were acquired by the Premier League club in 2012 to improve their player recruitment. She worked closely alongside the team’s management, at first Arsene Wenger and his coaching staff, for 10 years.
“We always relied on video as a communication tool,” she explains. “It’s not to say that everything had to pass the eye-test, but if you’re trying to claim something was a good action, and it didn’t look like one, people are going to push back. So you need to be able to explain the knock-on effects, and present it in a way that everyone can feel comfortable with.
“One good example would be when we worked on what appeared to be a simple project for the Arsenal academy, where they wanted to measure switches of play. But as we sat down with the coaching staff — I think Steve Bould was there — he would say: ‘Yes, it’s a switch, but that’s not quite right’. And it turned out that what they actually wanted was switching the ball and creating an overload. So we were seeing that the player executing the switch did the right thing, but the supporting player did not. So we changed our definition of success in the model, and it was good coaching feedback for them that their messaging needed to change.”
But sometimes, analysts still needed to know when to pick their battles. Statsbomb founder Ted Knutson worked at Brentford for several years, where his work was highly valued, but his experiences at other clubs sometimes left him reliant on demonstrative results.
“It was a lipstick-on-a-pig situation with some old-school directors of football,” he says. “You can add the lipstick, but it’s only going to make them angry if they’re not open to this stuff. There was pushback for the first five years consistently — it still even happened last year with a coach. But, eventually, owners stopped allowing their football people to do this, because they saw that the best teams in the world were using this data — they knew they had to get on board.”
Once they gained a foothold, data analysts increasingly became able to point to their track record as evidence for their worth. At Brentford, for example, data was a key part of the club’s philosophy. Sitting in League One, lacking the resources to buy top players, they instead gradually exchanged their way up the leagues, generating returns and reinvesting, trading the proverbial red paperclip for a house.
“In my final years at Arsenal, there was a core football intelligence group that worked really well together,” says Rudd. “The attitude would be focused around mitigating the risk of any signings between all these different information sources, whether they were data or more traditional scouting. If you look at Arsenal’s transfer history during that time, from 2020 onwards, the ratio of hits to misses changed dramatically.
“For example, we did some work around really bespoke, subjective data collection around defending. That was a massive analytics black hole, and it still is for most clubs around the world. While event data usually collects tackles and duels, that’s just players being aggressive, but the art of defending is around positioning and anticipating play — not interventions.
But we designed a way to collect our own information around this gap. It was a program to basically evaluate when players are doing the right thing and the wrong thing, incredibly sophisticated and labour intensive. You could simplistically think about it in terms of penalising a winger for not tracking back, and allowing a threat to develop behind him, rather than punishing the full-back who is left one-on-one. It took five years to come into existence, and Arsenal’s centre-back signings in recent years have a pretty good track record.”

Arsenal have used bespoke data to target suitable centre-backs in the past decade (Justin Setterfield/Getty Images)
The data revolution was not a linear progression, or even limited to only a handful of pioneers. From the mid-2000s onwards, there were numerous development trains running concurrently — the betting research of Tony Bloom and Matthew Benham, owners of Brighton & Hove Albion and Brentford respectively, in-house research teams at Arsenal and Liverpool, plus external consultants such as Opta and Statsbomb. Often, they worked in complete independence from each other.
“Sometimes I’d go to meetings with the commercial guys who were selling our work,” says Green, then working at Opta. “And when I did, it was often quite cagey. You would get the impression that clubs were into it, but no one would show their cards as to whether you were ahead of them. I remember going to Chelsea and definitely knowing they were doing something, but having no clue whether it was valuable.”
Knutson argues the history of football data could be loosely split into four waves:
The gambling wave — led by Benham and Bloom, in which football data was first used for commercial purposes
The in-house wave — where clubs such as Arsenal and Liverpool picked up on these possibilities, and began doing their own work behind the scenes
The democratisation of data — in which companies including Opta and Statsbomb began to sell tools which clubs of varying wealth across the football pyramid were able to access and implement
The birth of tracking data — where the likes of SkillCorner are able to add objective physical data to the existing numbers, going past some of the capabilities of traditional scouting
Early on, Green’s brief at Opta, in terms of research and development, was broadly experimental.
“Obviously baseball was the precursor, so we knew there was something there,” he says. “So it never felt futile; there were always people that were engaged. But there were some bits of work you did that went nowhere, and other bits that took off, and often they weren’t what I would have valued. It is surprising what cuts through.”
Green is one of the central figures behind the development of xG. While Rudd was concurrently developing a similar model at Arsenal in private, Green’s initial blog post on the subject has morphed into a statistic well-known enough to be used on Match of the Day. “It’s like Newton and Leibniz independently describing calculus at the same time,” jokes Rudd.
“It’s strange, because it didn’t necessarily take off at the time, but subsequently has,” Green says. “It’s ultimately trying to describe the game — to codify what you think is actually happening. If you take a pot shot from 25 yards out, it’s less likely to go in than a header from point-blank range.
“So it was a big building block for me. You had to get this in place to understand the value of generating different shots and scoring goals, because that’s the aggregation that everyone is trying to do in football. But the mainstream success of xG is relatively surprising.”

The BBC introduced xG to Match of the Day in August 2017 (Peter Dench/Getty Images)
But surprise is a key emotion when it comes to data analysis — challenging prevailing bias is when the discipline is at its most powerful. For example, ultimately, Graham was one of the figures who convinced Liverpool to move for Andy Robertson — but at the same time, Green was interested in recommending the Hull City left-back for Aston Villa.
“There’s a quote from (baseball statistics savant) Bill James which outlines 90 per cent test,” says Green. “If you build a metric, and 100 per cent is what you expect, you’ve not built anything of use. If only 50 per cent is what you expect, then your model is probably wrong. But if you expect 90 per cent, then the remaining data is really interesting. Often that’s only one or two people.
“I remember Andy Robertson scoring really well in one, which surprised me, because of Hull City’s relegation. Even though I should have been disassociating myself completely from his profile, it’s still hard to be completely dispassionate about the situation and how it impacts the perception of a player.”
This information sometimes gets back to players or coaches with vested interests. For example, when evaluating your club’s own squad, a technical director might have his past signings criticised. A player who commissions data insights into their value might be upset when it suggests they are not worthy of that lucrative contract.
TransferMarkt managing director Thomas Lintz tells a story about Cristiano Ronaldo blocking the website on Instagram after being displeased with his latest value update.
“People like being able to control their environment, and so there are times when you give coaches or agents information and they don’t like what they hear,” says Knutson. “I get it — you fight for whatever you can get. But we have to try and weigh it back to objectivity, and tell them to take it or leave it. There have been times when we’ve cut team deals loose because people wanted us to change our reports. It cost us money, but we felt that the alternative lacked integrity.”

Andy Robertson’s data in his time at Hull City was notably strong (Ian Horrocks/Sunderland AFC via Getty Images)
It is at these moments the overall structure becomes important. Graham is quick to point out his fortune at working at Liverpool under Klopp and Edwards, where clear processes were in place.
“The importance of being honest with the manager is underplayed in recruitment,” he explains. “You have to tell them that though you think Player X might be the best player, they are not perfect, and so here are their weaknesses — are you comfortable with them?
“That was a great thing about Jurgen — he was willing to accept weakness in return for strength. He said that if a player had some super strengths, he could cover up their deficiencies. As a recruitment department, we could give our honest opinion, and then it avoids the coach being upset when they turn out not to be able to do X, Y, or Z.”
At Arsenal, the structure gradually improved. “We were so early to the game that a lot of people still didn’t really understand what we were doing or how best to use us,” explains Rudd. “I think one thing we struggled with at the start was that in the era before sporting directors, you had one manager in charge of absolutely everything. So of course they wouldn’t necessarily put a lot of thought into what the decision-making process should look like, which sometimes hindered us from being as impactful as we could.
“Some people think that the role of data in recruitment is just for generating lists or for filtering. I’m very much of the opinion that data and analytics has its own voice and should have an independent evaluation of players, separate from scouts, so that you have these diverse perspectives and you can kind of cover each other’s blind spots.”
Now, almost every Premier League club has a technical director or its equivalent, giving data its place within the club’s management structure. Of course, there are still vast gaps between the leading clubs — generally considered as Manchester City, Liverpool and Arsenal — and those further down the table.
But some new hires in wider footballing roles even possess an analytics background — Ben Knapper, Arsenal’s former loans manager, and Norwich City’s new sporting director, came through at StatsDNA alongside Rudd. It demonstrates the discipline’s new-found reach.
What is the next argument for them to win? One remaining frontier is whether they will begin to influence managers in game — suggesting substitutions or changes of system. Certain advancements in technology mean aspects of this are theoretically possible, even though the bar is so high to clear in practice.
“One of the reasons why it’s so hard is that there are multiple ways to win — it’s not like baseball where there’s an ideal and finite way to move players around the bases,” explains Rudd. “You can really optimise that in a way you can’t mirror in football, because whatever strategy you come up with, somebody is going to counterbalance that. Plus, 45 minutes is not a lot of data to make decisions on.”
She laughs at the irony of a data analyst making her next point. “To be honest, this is where the human brain just does a much better job at finding patterns. Pretty early on at Arsenal we got access to live tracking data, and the coaches wanted us to identify spaces we could exploit. But those spaces don’t stay open for very long — so a human is just far better at saying: ‘This person is positioned badly, or that player’s reaction is a bit slow’. With current tools, you could probably build a slightly better model, but I think this is just where the human brain really excels.”
Graham agrees. “I don’t think data has done much in terms of tactics yet, is the simple answer. You need a good tracking model to say something about tactics, and most teams don’t have that — maybe just the big Premier League teams and a couple in Europe. It took us two years to build one at Liverpool and we had one of the best-resourced data science teams in football.
“But for most teams, if data is informing tactics it probably shouldn’t be unless you’re sure you have a very good model. You have to convince the coach to use it as well, and that’s a very high bar.”

Data is yet to much impact on in-game tactics (Matt McNulty/Getty Images)
Instead, some see the next frontier as taking place in training. Ninety per cent of Graham’s role concerned recruitment and, though Rudd’s focus on signings only comprised half her job, transfers were seen as the main priority. However, this means other areas possess low-hanging fruit.
“Training data and improving player skills is going to be a big thing going forward,” says Knutson. “Using equipment like high-speed camera and LiDAR radar can help improve ball-striking — that could have a big impact because better ball-striking has a very large impact in scoring goals. But it also has an impact on things like, for example, your centre-back playing the ball out to the wings consistently — and we know that’s a super valuable pass that not every centre-back can make.”
Data analysts have had to fight to defend their role in football. Sometimes the numbers do not speak for themselves, but need somebody to speak up for them. For Graham, this is the only place where bias can be justified.
“The bias that is useful to have is contrarianism,” argues Graham. “Football is too risk averse when it comes to anything. Back in the Spurs days, there wasn’t much scouting of European players — there was a feeling that foreigners couldn’t do it in the Premier League. That’s mad to think of today.
“And so being a contrarian is to say, whatever the bias is, that you’re willing to go way too far in the other direction, and that will give you an edge. It’s like the Matthew Benham quote of if you’re 1-0 up and down to 10 men in the 90th minute, you’ve got to keep attacking. In some ways, it’s a stupid thing to say, but everyone’s so risk averse that they keep being wrong in the same direction.
“Find the biases, be biased in the other direction, and even if you’re wrong, because everyone else is wrong in the other direction, that’s going to be an advantage for you.”
(Illustration: Eamonn Dalton / The Athletic; Martin Rickett/PA Images; Peter Byrne/PA Wire via Getty Images)