
Tropical rainforests are crucial yet vulnerable ecosystems that store vast amounts of carbon and shelter remarkable biodiversity. Understanding how their structure responds to climate change and disturbances is key to predicting their future resilience. This article explores multi-scale Lidar technologies (terrestrial, airborne and drone-based techniques) combined with microclimate monitoring, unlocking new insights into forest dynamics. From fine-scale 3D tree models to large-scale mapping, point cloud data can play a role in bridging the knowledge gap about how structure and microclimate shape rainforest stability.
Tropical rainforest ecosystems are characterized by high annual rainfall (1,500-4,000mm) and consistently warm temperatures (17-30°C). Accounting for approximately 45% of the global forest area, they play a crucial role in the global carbon cycle and in regulating the global climate. Moreover, tropical rainforests are biodiversity hotspots that are home to the majority of the world’s living biomass. However, these ecosystems are increasingly threatened by climate change, manifested through disturbance events (e.g. tropical cyclones, heatwaves, fire). While such disturbances can be essential for forest dynamics by shaping forest structure, their increasing intensity and frequency due to global climate warming can have strong negative impacts on forest resilience.
Despite their importance, the impact of tropical rainforest dynamics on forest structure remains poorly understood, especially at broader spatial and temporal scales. Terrestrial laser scanning (TLS or ‘terrestrial Lidar’) is a powerful tool for understanding tree and forest structure. TLS has significant capacity to model individual tree structure, allowing for fully realized 3D tree structural models. These models allow for the quantification of biomass – an important metric for tracking how much carbon is stored in forests. While TLS is well-suited for detailed, stand-level studies on forest structure, its potential is magnified when paired with broader spatial-scale Lidar such as uncrewed aerial vehicle laser scanning (UAV-LS) or airborne laser scanning (ALS).
Modelling microclimate buffering
One of the more recent applications of forest Lidar data is its use in conjunction with other data types to model complex processes such as microclimate buffering. The microclimate buffering capacity of a tropical rainforest is a key forest function. The dense rainforest canopy can significantly buffer climate extremes (e.g. temperature, rainfall, wind) and thus offers stable and ideal habitat conditions for many species. However, the stability granted by microclimate buffering can be threatened by natural disturbances such as tropical cyclones, affecting forest structure and by consequence forest microclimate. A better understanding of the relationship between microclimate and forest structure is highly important to predict the effect of climate change on these ecosystems.
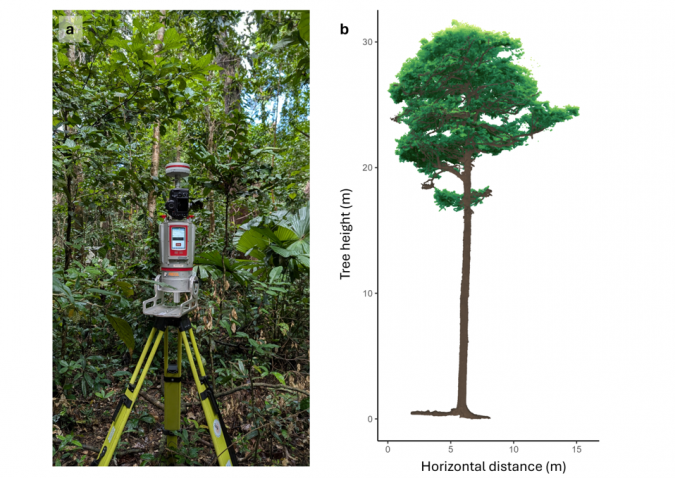
Figure 1: a) RIEGL VZ400i terrestrial laser scanner, and b) Tree point cloud segmented from TLS data.
From June to September 2024, a field crew from the Q-ForestLab at Ghent University in Belgium embarked on a campaign collecting TLS, UAV-LS, ALS and microclimate data in the Wet Tropics of North-East Queensland, Australia – home to the world’s oldest tropical rainforests. The campaign surveyed 16 plots throughout the region, ranging from 0.5 to 1ha in size, covering both an altitudinal (15-1,200MASL) and a precipitation (1,236-3,470mm) gradient. The plots are part of the Queensland Permanent Rainforest Plots (QPRP) network. This work was done in collaboration with Sylvera Ltd, a UK-based company that led the ALS data collection, as well as two Australian partners: TERN, who maintains and censuses the Robson Creek supersite, and CSIRO, who handled the UAV-LS data collection.
Terrestrial laser scanning
High-density TLS point cloud data was collected using the RIEGL VZ-400i scanner (see Figure 1a) through a project funded by the Flemish Research Council (FWO). Intensive sampling using a 10m regular grid established in each forest plot required up to a week of work per hectare sampled, but it yielded an incredibly detailed 3D model of the forest canopy. As the scanner was manually carried through the forest, it internally tracked its position, allowing for mostly seamless data processing that involved co-registration of individual scans to create one comprehensive plot-level point cloud. The scanner not only collected point cloud and local position data, but it also georeferenced its position in conjunction with an Emlid base station. This will allow for easier alignment to other data sources in the future, such as microclimate sensor positions or UAV-LS point clouds. Overall, the data collection effort in such remote (and sometimes dangerous) rainforest ecosystems was exciting and intense – something only made possible through close teamwork and careful planning.
While TLS data generally offers the most complete and detailed point cloud data (see Figure 1b), its perspective can be limited to below the canopy. In dense forests such as the rainforests of North-East Queensland, even the most powerful laser scanners can have gaps in data due to increased occlusion in the upper reaches of the canopy. For this reason, one of the best ways to improve the quality of TLS data is to create a fusion with UAV-LS or ALS data.
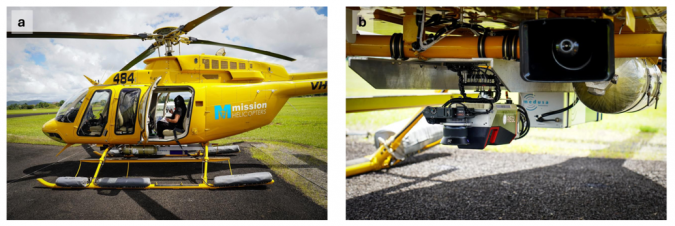
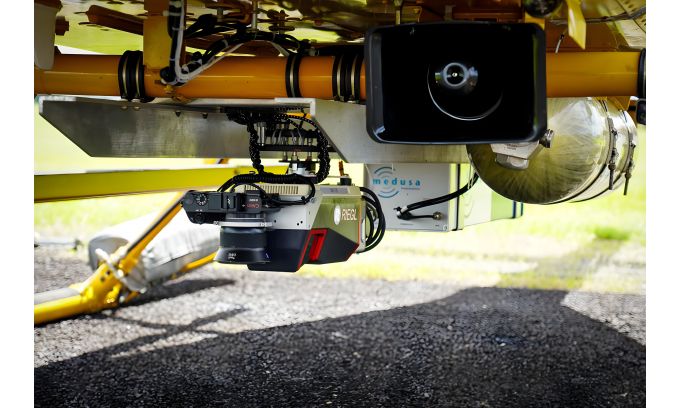
Figure 2: a) BELL 407 helicopter fitted with the RIEGL VUX-120 scanner, and b) Sylvera Ltd.
Airborne laser scanning
To upscale TLS structural data on a larger scale, another component of the campaign involved ALS. This work was carried out in August and September 2024 by Sylvera Ltd using a RIEGL VUX-120 (Figure 2b) mounted on a BELL 407 helicopter (Figure 2a), covering all 16 QPRP plots and a total area of 65,000ha. Flying at 160m above ground level with flight lines spaced 127m apart, the VUX-120 operated at a pulse repetition rate of 1,200kHz, recording 400 scan lines per second across a 100° field of view. These settings produced a highly detailed point cloud of roughly 300 points/m², enabling large-area, high-resolution 3D mapping of forest structure.
UAV laser scanning
Where TLS lacks potential in terms of extent and ALS lacks individual tree detail, UAV-LS offers a strong balance between both approaches. With flights closer to the canopy resulting in a highly detailed point cloud, UAV-LS enables the upscaling of fine-scale measurements while preserving the detailed forest structure. One disadvantage of UAV-LS can be the line-of-sight restrictions, particularly in remote tropical rainforest plots. Due to the challenges in the QPRP network, this resulted in UAV-LS being conducted at only two of the research sites: DRO (1ha) and Robson Creek (25ha).
The CSIRO crew, led by Dr Shaun Levick and Dr Steph Johnson, have flown the RIEGL VUX-120 attached to the Acecore NOA UAV platform (Figure 3) at DRO and Robson Creek yearly since 2024, with plans to keep recollecting data in the coming years. With a 100° field of view and a rapid data acquisition rate of up to 1.8MHz, the VUX-120 is ideally suited for high-point-density mapping, capturing intricate details with remarkable precision. Laser hits on vertical surfaces, such as tree trunks, were improved by the nadir/forward/backward (NFB) scan pattern, sampling at nadir, 10° forward and 10° backward. This capability significantly enhances the mapping of forest structure, as UAV-LS data acts as a crucial bridge between TLS and ALS.
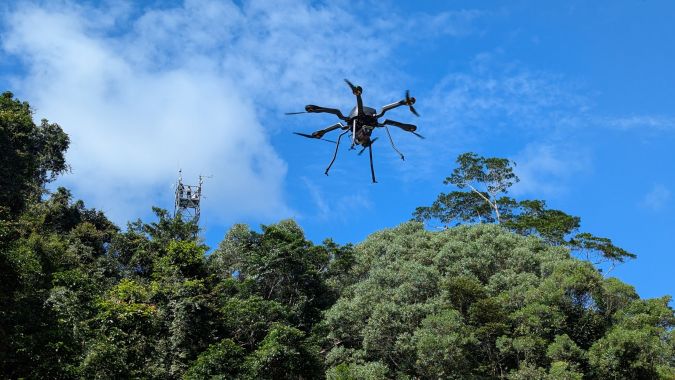
Figure 3: Acecore NOA drone equipped with the RIEGL VUX-120 scanner.
Microclimate monitoring
During the 2024 campaign, a network of 190 EL-USB-2 Lascar air temperature and relative humidity loggers was created across all the 16 QPRP research plots. They were installed at a height of 1.50m and protected from direct sun radiation with a PVC shield to collect data on the microclimate (Figure 4a). The loggers record every 60 minutes, providing insights into the buffering effect of tropical rainforests on climate change (Figure 4b). Two loggers were placed in open areas nearby the plots to measure the local temperature outside the forest. To capture the broader regional context, these two logger measurements will be combined with data from local weather stations and ERA5 analysis, representing the macroclimate.
Conclusions
By combining comprehensive multi-scale Lidar datasets with high-density microclimate measurements, this project provides an unprecedented perspective of tropical rainforest structure and dynamics. Integrating Lidar from multiple platforms like TLS, UAV-LS and ALS enables both fine-scale and landscape-level structural analysis, leading to better knowledge of aboveground biomass (AGB), demographics and structural heterogeneity. Additionally, the project will develop new, region-specific allometric models for AGB using the high-quality structural data collected via TLS. These allometric models will then be upscaled through UAV-LS and ALS data, giving a unique, forest-scale perspective into carbon dynamics for the region.
Moreover, studying the relationship between microclimate and forest structure will further the understanding of how rainforest structure responds to disturbances, and how these changes impact the forest’s ability to buffer climate extremes. The project is part of a long-term monitoring network bringing crucial new insights into tropical rainforest resilience, which will be a good benchmark for further tropical ecosystems studies.
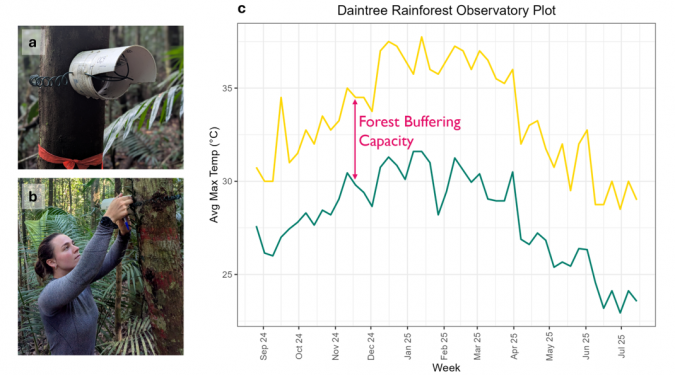
Figure 4: El-USB-2 Lascar sensor protected by a radiation shield, b) A sensor being installed by Luna Soenens, and c) Buffering capacity of the tropical rainforest based on measurements inside and outside the Daintree Rainforest Observatory plot over a year.
Further reading
Terryn, Louise, Kim Calders, Harm Bartholomeus, et al. 2022. Quantifying Tropical Forest Structure through Terrestrial and UAV Laser Scanning Fusion in Australian Rainforests. Remote Sensing of Environment 271 (March): 112912. https://doi.org/10.1016/j.rse.2022.112912.
Sylvera Ltd: https://www.sylvera.com/