Study selection process
A total of 3161 studies were retrieved from MEDLINE and EMBASE, with an additional one identified through gray literature sources. After removal of duplicates, 2872 unique records remained. Title and abstract screening yielded 29 articles for full-text assessment. Of these, 14 met the eligibility criteria and were included for data extraction. This final set comprised four post hoc analyses [21,22,23,24] of four RCTs [25,26,27,28], and ten observational studies [29,30,31,32,33,34,35,36,37,38]. The study selection process is illustrated in the PRISMA diagram (Supplementary Figure S1).
Baseline study information
Baseline information for the included RCTs is presented in Supplementary Table S1, and for the included observational studies in Supplementary Table S2 and S3. All RCT data included T2D populations, with AMPLITUDE-O, Harmony Outcomes, and SOUL examining patients with concurrent CVD or ASCVD history, and FLOW enrolling patients with concurrent CKD. All of the included observational trials represented diabetic populations or populations with high (> 85%) incidence of T2D. Many of the included observational trials included patients with additional comorbidities such as history of acute coronary syndrome (ACS), MI, ASCVD, heart failure with reduced ejection fraction (HFrEF), or HFpEF. Supplementary Table S4 summarizes the populations of the included observational trials.
Risk of bias
The Cochrane RoB 2.0 tool was used to assess the included RCTs. All studies were deemed to be low risk overall, and low risk for all domains including randomization process, intervention deviation, missing outcome data, measurement of outcomes, and reporting of the outcome. Newcastle Ottawa Scale was used to assess the included observational trials. Most studies received a score of 8 out of 9, with deductions typically due to inadequate follow-up or failure to demonstrate that the outcomes of interest had never occured prior to the start of the study. The full risk of bias tables can be found in the supplementary appendix tables S5 and S6.
Randomized control trial dataMajor adverse cardiovascular events
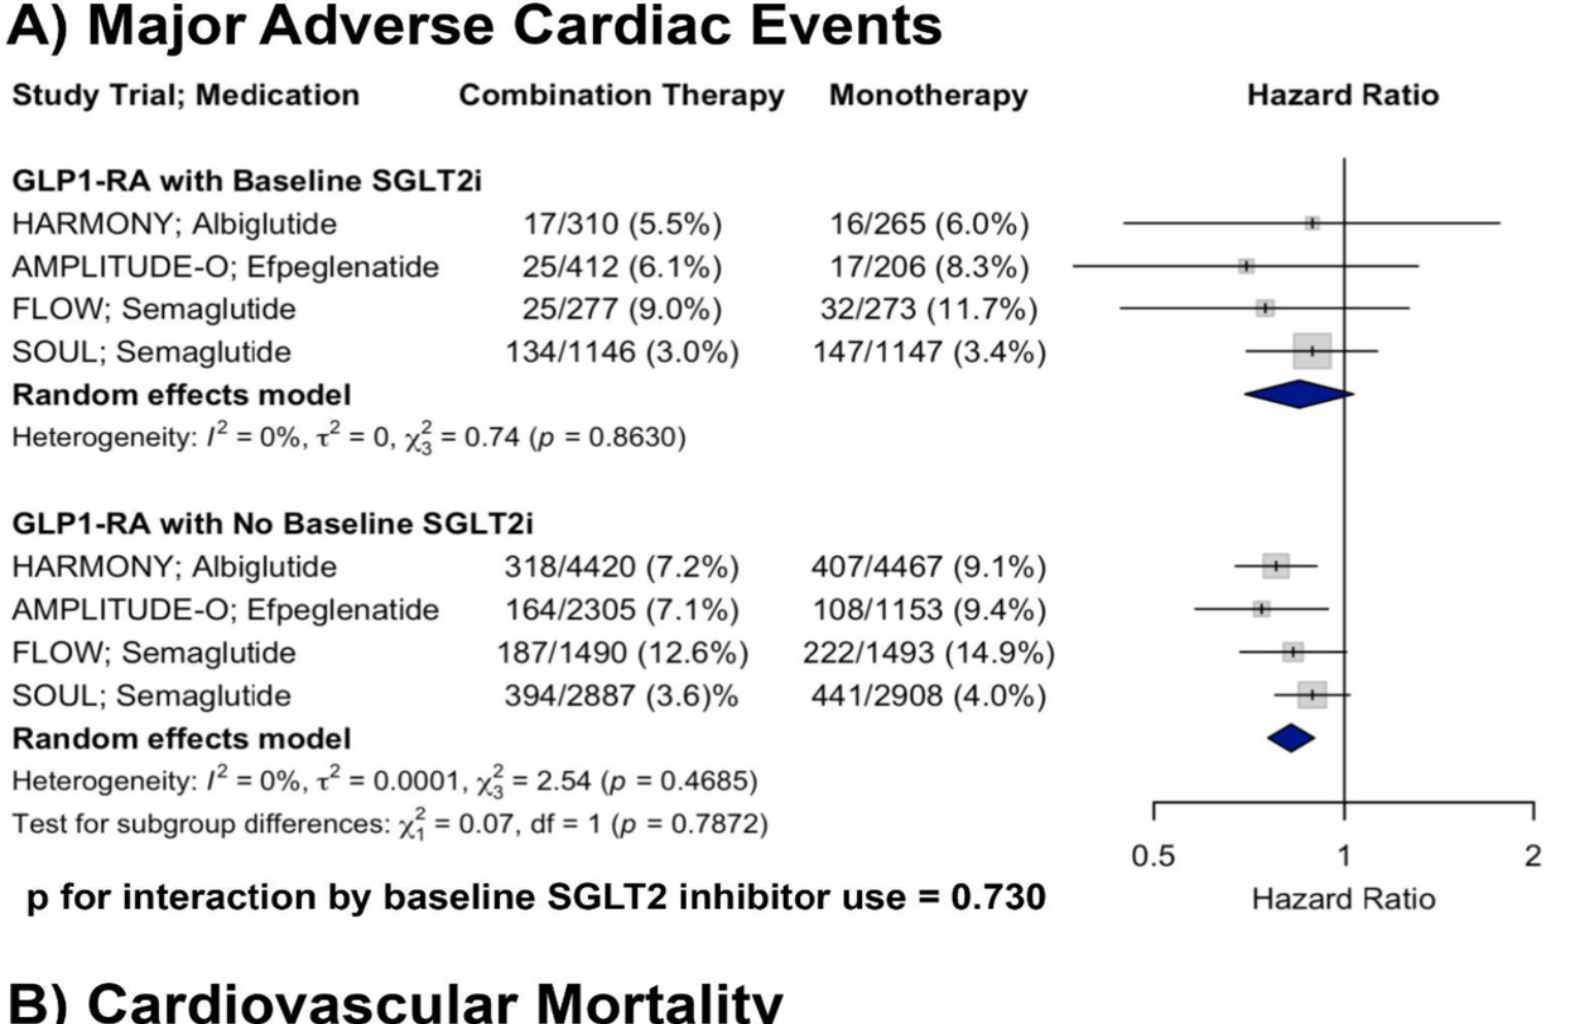
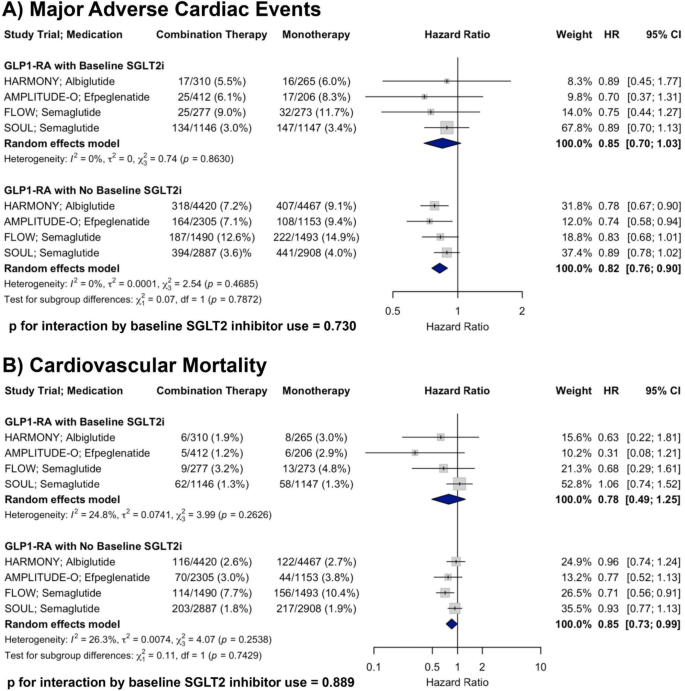
A total of four RCTs were included in the analysis of MACE. In patients with baseline SGLT2i use receiving GLP-1RA therapy, the pooled HR was 0.85 (95% CI: 0.70–1.03) compared to placebo. In patients receiving GLP-1RA therapy without baseline SGLT2i, the pooled HR was 0.82 (95% CI: 0.76–0.90). There was no evidence of heterogeneity within either subgroup (I2 = 0% for both). Meta-regression showed no significant interaction by baseline SGLT2i use (p for interaction = 0.730). Although only one subgroup reached statistical significance, the non-significant interaction p-value (p = 0.730) indicates no strong evidence of a differential treatment effect of GLP-1RA based on baseline SGLT2i use (Fig. 1, Panel A).
Forest plots showing the effects of GLP-1RA therapy on A MACE and B CV mortality across RCTs, stratified by baseline SGLT2i use, with p-values for interaction shown
Cardiovascular mortality
A total of four RCTs were included in the analysis of CV mortality. In patients with baseline SGLT2i use receiving GLP-1RA therapy, the pooled HR was 0.78 (95% CI: 0.49–1.25) compared to placebo. In patients receiving GLP-1RA therapy without baseline SGLT2i, the pooled HR was 0.85 (95% CI: 0.73–0.99). There was minimal to moderate heterogeneity within subgroups (I2 = 24.8% and 26.3%, respectively). There was no significant interaction by baseline SGLT2i use (p for interaction = 0.889), supporting a consistent reduction in CV mortality with GLP-1RA therapy irrespective of concurrent SGLT2i treatment (Fig. 1, Panel B).
Non-fatal myocardial infarction
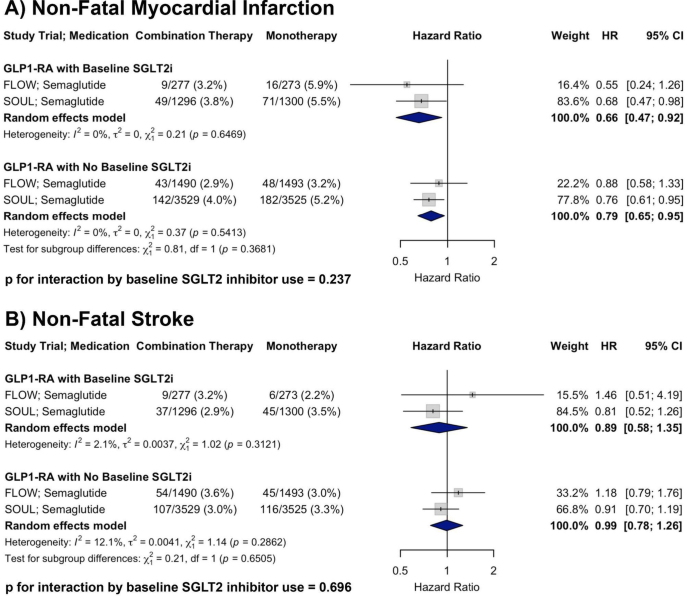
A total of two RCTs were included in the analysis of non-fatal MI. In patients with baseline SGLT2i use receiving GLP-1RA therapy, the pooled HR was 0.66 (95% CI: 0.47–0.92) compared to placebo. In patients receiving GLP-1RA therapy without baseline SGLT2i, the pooled HR was 0.79 (95% CI: 0.65–0.95). There was no evidence of heterogeneity within either subgroup (I2 = 0% for both). There was no significant interaction by baseline SGLT2i use (p for interaction = 0.237), supporting a consistent reduction in non-fatal MI with GLP-1RA therapy irrespective of concurrent SGLT2i treatment (Fig. 2, Panel A).
Forest plots showing the effects of GLP-1RA therapy on A non-fatal MI and B non-fatal stroke across RCTs, stratified by baseline SGLT2i use, with p-values for interaction shown
Non-fatal stroke
A total of two RCTs were included in the analysis of non-fatal stroke. In patients with baseline SGLT2i use receiving GLP-1RA therapy, the pooled HR was 0.89 (95% CI: 0.58–1.35) compared to placebo. In patients receiving GLP-1RA therapy without baseline SGLT2i, the pooled HR was 0.99 (95% CI: 0.78–1.26). There was minimal heterogeneity within subgroups (I2 = 2.1% and 12.1%, respectively). There was no significant interaction by baseline SGLT2i use (p for interaction = 0.696), suggesting a similar effect of GLP-1RA therapy on non-fatal stroke irrespective of baseline SGLT2i treatment (Fig. 2, Panel B).
All-cause mortality
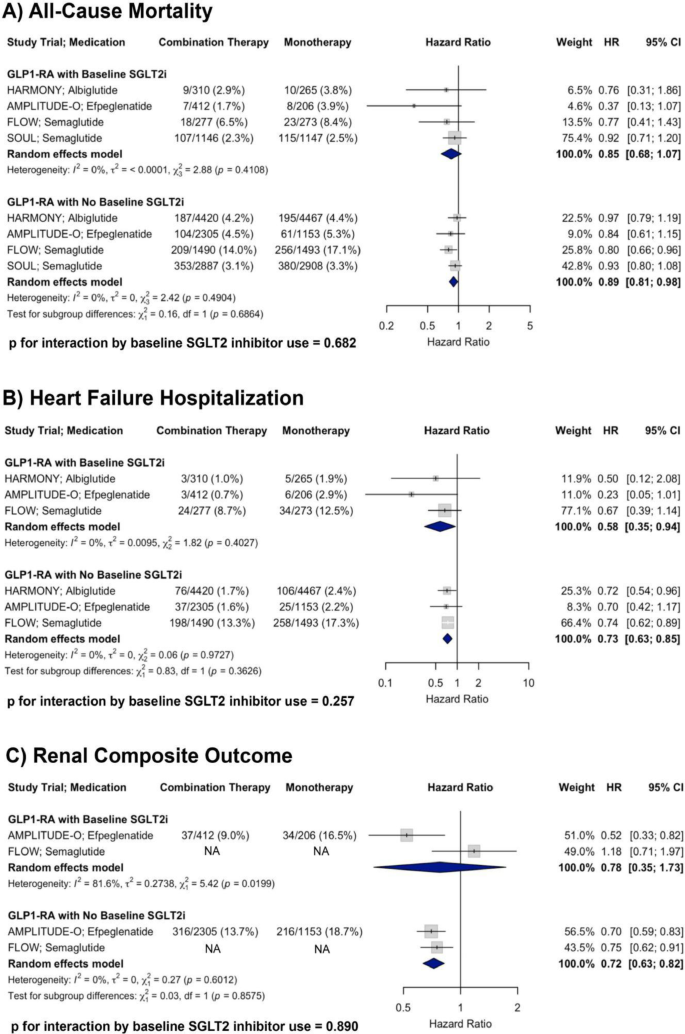
A total of four RCTs were included in the analysis of all-cause mortality. In patients with baseline SGLT2i use receiving GLP-1RA therapy, the pooled HR was 0.85 (95% CI: 0.68–1.07) compared to placebo. In patients receiving GLP-1RA therapy without baseline SGLT2i, the pooled HR was 0.89 (95% CI: 0.81–0.98). There was no evidence of heterogeneity within either subgroup (I2 = 0% for both). There was no significant interaction by baseline SGLT2i use (p for interaction = 0.682), supporting a consistent reduction in all-cause mortality with GLP-1RA therapy irrespective of concurrent SGLT2i treatment (Fig. 3, Panel A).
Forest plots showing the effects of GLP-1RA therapy on A all-cause mortality, B HF hospitalization, and C renal composite outcome across RCTs, stratified by baseline SGLT2i use, with p-values for interaction shown
Heart failure hospitalization
A total of three randomized controlled trials were included in the analysis of HF hospitalization. In patients with baseline SGLT2i use receiving GLP-1RA therapy, the pooled HR was 0.58 (95% CI: 0.35–0.94) compared to placebo. In patients receiving GLP-1RA therapy without baseline SGLT2i, the pooled HR was 0.73 (95% CI: 0.63–0.85). There was no evidence of heterogeneity within either subgroup (I2 = 0% for both). There was no significant interaction by baseline SGLT2i use (p for interaction = 0.257), supporting a consistent reduction in HF hospitalization with GLP-1RA therapy irrespective of concurrent SGLT2i treatment (Fig. 3, Panel B).
Renal composite outcome
A total of two RCTs were included in the analysis of the renal composite outcome. The AMPLITUDE-O renal composite definition included incident macroalbuminuria, a sustained decrease in estimated glomerular filtration rate (eGFR) by ≥ 40% for at least 30 days, initiation of renal replacement therapy, or a sustained eGFR < 15 mL/min/1.73 m2 for at ≥ 30 days. FLOW defined the renal outcome as a four-component composite consisting of the onset of a sustained ≥ 50% reduction in eGFR from baseline, kidney failure (initiation of chronic dialysis, kidney transplantation, or a sustained reduction in eGFR < 15 mL/min/1.73 m2 for at ≥ 28 days), or death due to kidney causes. In patients with baseline SGLT2i use receiving GLP-1RA therapy, the pooled HR was 0.78 (95% CI: 0.35–1.73). In patients with baseline SGLT2i use receiving GLP-1RA therapy, the pooled HR was 0.72 (95% CI: 0.63–0.82). There was substantial heterogeneity in the subgroup with SGLT2i use (I2 = 81.6%), but not in those without (I2 = 0%). No significant interaction by SGLT2i use was observed (p for interaction = 0.890), indicating that GLP-1RA therapy was associated with a consistent outcome regardless of concomitant SGLT2i treatment (Fig. 3, Panel C).
Observational trial data (SGLT2i and GLP-1RA combination therapy)Major adverse cardiovascular events
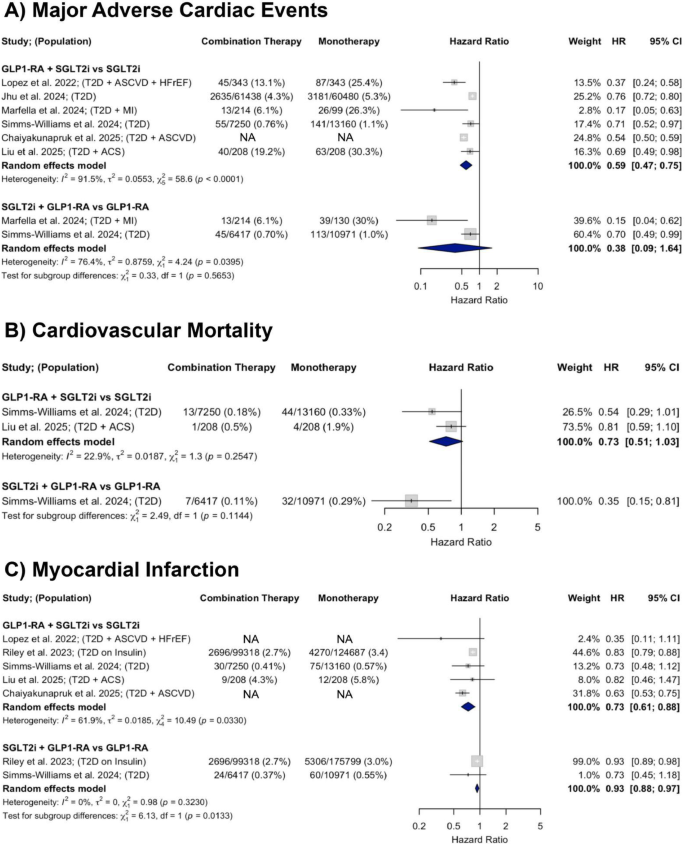
A total of six observational studies were included in the analysis of MACE. In studies comparing GLP-1RA and SGLT2i combination therapy to SGLT2i monotherapy, there was a significant 41% decrease in MACE (HR = 0.59; 95% CI 0.47–0.75). In those comparing combination therapy to GLP-1RA monotherapy, there was a non-significant downward trend in MACE incidence with a pooled HR of 0.38 (95% CI: 0.09–1.64). Heterogeneity was substantial across both comparisons (I2 = 91.5% and 76.4%, respectively) (Fig. 4, Panel A).
Forest plots showing the effects of GLP-1RA and SGLT2i combination therapy versus monotherapy on A MACE, B CV mortality, and C MI across observational studies
Cardiovascular mortality
A total of two observational studies were included in the analysis of CV mortality. In studies comparing GLP-1RA and SGLT2i combination therapy to SGLT2i monotherapy, there was a non-significant downward trend in CV mortality (HR = 0.73; 95% CI 0.51–1.03) with low heterogeneity (I2 = 22.9%). One study compared GLP-1RA and SGLT2i combination therapy to GLP-1RA monotherapy and found a significant 65% decrease in CV mortality risk (HR = 0.35; 95% CI 0.15–0.80) (Fig. 4, Panel B).
Myocardial infarction
A total of five observational studies were included in the analysis of myocardial infarction. In studies comparing GLP-1RA and SGLT2i combination therapy to SGLT2i monotherapy, there was a 27% decrease in MI incidence (HR = 0.73; 95% CI 0.61–0.88) with substantial heterogeneity (I2 = 61.9%). In those comparing GLP-1RA and SGLT2i combination therapy to GLP-1RA monotherapy, there was a 7% decrease in MI risk (HR = 0.93; 95% CI 0.88–0.97) with no heterogeneity (I2 = 0%) (Fig. 4, Panel C).
Stroke
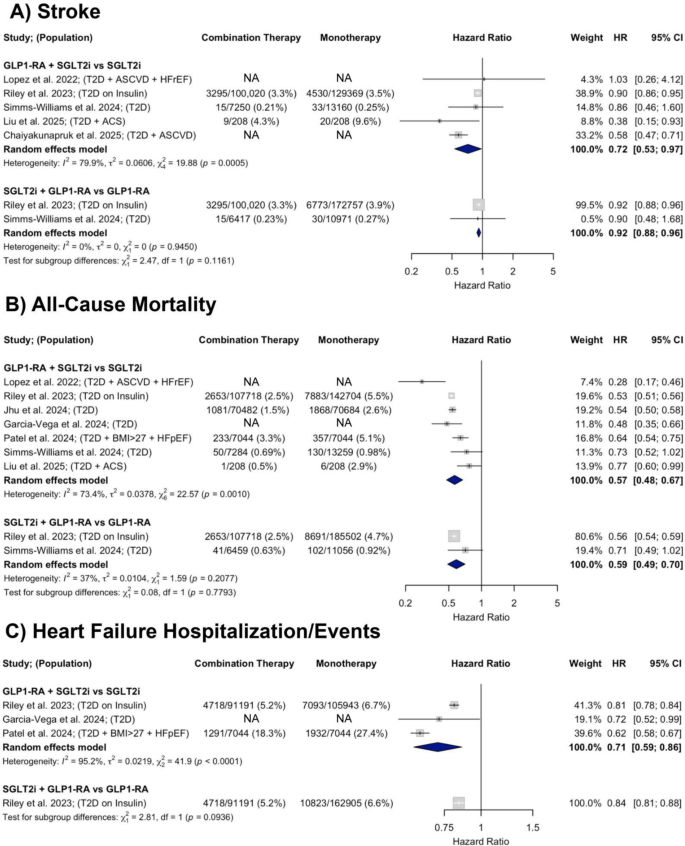
A total of five observational studies were included in the analysis of stroke. In studies comparing GLP-1RA and SGLT2i combination therapy to SGLT2i monotherapy, there was a 28% decrease in stroke risk (HR = 0.72; 95% CI 0.53–0.97) with considerable heterogeneity (I2 = 79.9%). In those comparing GLP-1RA and SGLT2i combination therapy to GLP-1RA monotherapy, there was a 8% decrease in stroke risk (HR = 0.92; 95% CI 0.88–0.96) with no heterogeneity (I2 = 0%) (Fig. 5, Panel A).
Forest plots showing the effects of GLP-1RA and SGLT2i combination therapy versus monotherapy on A stroke, B all-cause mortality, and C HF hospitalization/events across observational studies
All-cause mortality
A total of seven observational studies were included in the analysis of all-cause mortality. In studies comparing GLP-1RA and SGLT2i combination therapy to SGLT2i monotherapy, there was a significant 43% decrease in all-cause mortality (HR = 0.57; 95% CI 0.48–0.67). In those comparing GLP-1RA and SGLT2i combination therapy to GLP-1RA monotherapy, there was a 41% decrease in all-cause mortality (HR = 0.59; 95% CI 0.49–0.70). Heterogeneity was moderate to substantial across comparisons (I2 = 73.4% and 37%, respectively) (Fig. 5, Panel B).
Heart failure hospitalization/events
A total of three observational studies were included in the analysis of HF hospitalization or events. In studies comparing GLP-1RA and SGLT2i combination therapy to SGLT2i monotherapy, there was a significant 29% decrease in time to first HF hospitalization/event (HR = 0.71; 95% CI 0.59–0.86) with substantial heterogeneity (I2 = 95.2%). One study compared GLP-1RA and SGLT2i combination therapy to GLP-1RA monotherapy and found a 16% decrease in time to first HF hospitalization (HR = 0.84; 95% CI 0.80–0.87) (Fig. 5, Panel C).
Serious renal events
One study compared the effect of GLP-1RA and SGLT2i combination therapy to monotherapy on serious renal events, which included incidence of acute kidney injury, CKD, kidney failure, chronic hypertensive renal disease, and renal complications of diabetes. In patients with T2D, combination therapy was associated with a HR of 0.43 (95% CI 0.23–0.80) when compared to GLP-1RA monotherapy, and a HR of 0.67 (95% CI 0.32–1.41) when compared to SGLT2i monotherapy.
Subgroup analysis
Given the heterogeneity across study populations, subgroup analyses were conducted. Two subpopulations were examined: (1) a lower-risk T2D population, defined as studies enrolling a broad T2D cohort or general population with high T2D incidence, without requiring additional comorbidities or high risk features (e.g. MI history or insulin use); and (2) a population with T2D and vascular or coronary disease, defined as studies including participants with comorbid ACS, MI, or ASCVD. Forest plots and HRs with 95% CIs are presented in the supplementary appendix (Supplemental Figures S2-S12).
In the first subgroup, only MACE and all-cause mortality had sufficient data for statistical analysis comparing GLP-1RA and SGLT2i combination therapy to SGLT2i monotherapy. MACE was significantly reduced by 24% (HR = 0.76; 95% CI 0.72–0.80), with no observed heterogeneity (I2 = 0%) (Supplementary Figure S2). All-cause mortality was also significantly reduced by 44% (HR = 0.56; 95% CI 0.48–0.65); heterogeneity was moderate (I2 = 45.2%) but lower than that observed in the overall population (Supplementary Figure S10).
In the T2D with vascular or coronary disease subgroup, MACE, MI, stroke, and all-cause mortality had sufficient data for analysis comparing GLP-1RA and SGLT2i combination therapy to SGLT2i monotherapy. MACE was significantly reduced by 50% (HR = 0.50; 95% CI 0.36–0.69), with moderate heterogeneity (I2 = 61.1%) that was lower than in the overall population (Supplementary Figure S3). MI and stroke were significantly reduced by 36% (HR = 0.64; 95% CI 0.54–0.75) and 43% (HR = 0.57; 95% CI 0.47–0.70), respectively, with no heterogeneity (I2 = 0% for both). In this subpopulation, all-cause mortality lost significance (HR = 0.48; 95% CI 0.18–1.28) and heterogeneity became considerable (I2 = 92%) (Supplementary Figure S11).
Observational trial data (finerenone and SGLT2i combination therapy)
One study compared finerenone and SGLT2i combination therapy to using either medication alone [29]. This study examined MACE, all-cause mortality, and major adverse kidney events (MAKE) which was defined as stage 5 CKD, or need for dialysis therapy or renal transplantation. Patients were propensity score matched; all patients had CKD, and the majority had T2D, with prevalence ranging from 87.1 to 89.2% across treatment groups.
Finerenone and SGLT2i combination therapy vs. SGLT2i monotherapy
During a mean follow-up of 12.2 ± 9.7 months, combined finerenone and SGLT2i group had a 56% reduction in MAKE risk compared to SGLT2i monotherapy (HR = 0.44; 95% CI 0.22–0.89). All-cause mortality was 59% lower in the combination therapy group compared to SGLT2i monotherapy (HR = 0.41; 95% CI 0.17–0.96). There was no significant difference in MACE between treatment groups (HR = 0.66 95% CI 0.27–1.61).
Finerenone and SGLT2i combination therapy vs. finerenone monotherapy
During a mean follow-up of 13.0 ± 9.9 months, combined finerenone and SGLT2i group had a 80% reduction in MAKE risk compared to finerenone monotherapy (HR = 0.20; 95% CI 0.09–0.45). All-cause mortality was 69% lower in the combination therapy group compared to finerenone monotherapy (HR = 0.31, 95% CI 0.12–0.82). There was no significant difference in MACE between treatment groups (HR = 0.77, 95% CI 0.27–2.26).

