

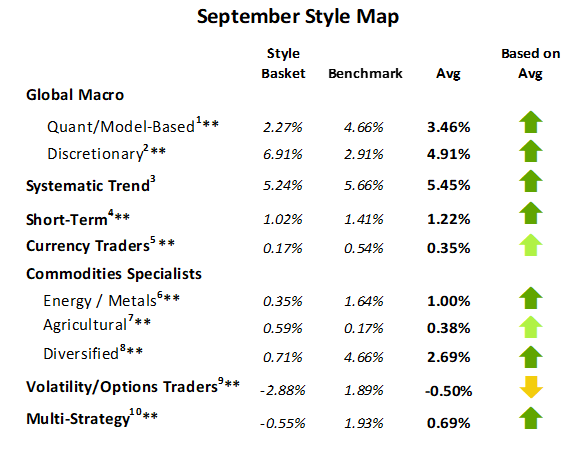
For its examination of September, the following highlights four of the various style categories that Kettera covers.
Systematic Trend
September was primarily dominated by two strong trends: rising precious and base metals, and rising global equity indices. Most of the long-term trend programs that we follow fully captured both, leading to a very strong positive month. Gold, silver, platinum, and palladium all rallied strongly, with gold hitting all-time highs, catching plentiful headlines in the process. Another profitable position of note for some programs included shorting the soybean complex (soybeans, meal, oil) on abundant global supply and weak export demand. A few managers also did well to be long emerging market currencies, namely Brazil, Mexico, and S. African ZAR, versus the US dollar. Trading in fixed income did not result in meaningful performance.<
Discretionary Global Macro
Discretionary global macro managers posted strong results in September, with many reporting high single-digit or even double-digit returns. A dominant theme the board was long positioning in front-end interest rates ahead of a highly anticipated rate cut by the Fed (with a second expected in late October). Short U.S. dollar exposure—particularly against the euro, pound, and Canadian dollar—was another winning theme as managers interpreted capital flows as unsupportive of further USD strength. Precious metals—especially gold and silver—were among the strongest contributors, with several managers maintaining core long positions as a hedge against both monetary instability and geopolitical tensions. Equity exposures varied, but some managers continued to avoid traditional long/short equity beta, instead using commodities and FX as cleaner expressions of economic views. Overall, discretionary macro managers who focused on rates, metals, and macro-sensitive FX outperformed, while those who overplayed equity or thematic growth exposure saw more mixed results. The strongest returns came from managers who concentrated risk in a few high-conviction, fundamentally-driven positions—particularly in fixed income and precious metals.
Currency Specialists
FX-focused managers generally posted positive returns in September, though performance dispersion was noticeable across style and signal type. Shorter-term systematic programs performed strongly benefiting from well-timed macro- and carry-based signals in G10 and EM currencies, while avoiding choppier directional exposures. The more discretionary macro programs also did well, particularly those holding short USD positions—especially vs. high carry EM currencies like ZAR, BRL, and MXN, all of which outperformed as the dollar weakened mid-month. Managers positioned long AUD or Euro saw gains as those currencies rebounded on domestic macro resilience, while NZD longs underperformed. Mean reversion and pairwise correlation trades were more mixed, as dispersion between traditionally linked crosses increased. Precious metals-linked FX themes (long gold vs. USD shorts) also contributed to gains for those managers that drew on the currency-gold relationship effectively. Overall, funds that relied on carry and macro signals outperformed those leaning on short-term price movement, as these markets during the month responded more to fundamental rather than technical catalysts.
Commodities Specialists – Diversified Managers
Diversified Commodities programs were positive in September, with systematic programs outperforming discretionary ones. Directional long exposures in precious metals (gold, silver, platinum, palladium) and base metals (copper, aluminum) were the best performing, although tactical spread trades also did well, notably in gold. Short biased exposures in grains (soybeans, wheat, soymeal, corn) using spreads and outright directional trades did well, as global grains supplies are abundant, and tariffs continue to dramatically affect export demand, pressuring prices lower. Discretionary and systematic programs alike struggled in the energy sector, as crude and products were range-bound and choppy, as was gas trading. A few quant-driven commodities programs did well in softs trading by catching the short in cocoa and cotton. Overall, metals, grains and softs trading was profitable while energy trading underperformed.
Kettera Strategies September 2025 Style Map
Past performance is not necessarily indicative of future results. See notes at end of this document for details on the construction of the hydra “baskets” and the benchmark used for each style class. Also note that some baskets may contain managers that have not yet reported by this date.
*=less than 75% reported.
**=less than 75% reported and absence of a core manager’s return.
**********
Footnotes
The views and opinions expressed herein are those of the author and do not necessarily reflect the views of Kettera Strategies. The information set forth herein has been obtained or derived from sources believed by the author to be reliable. However, neither Kettera nor the author make any representation or warranty, express or implied, as to the information’s accuracy or completeness, nor do Kettera or the author recommend that the attached information serve as the basis of any investment decision. This is provided to you solely for informational purposes only and does not constitute an offer or solicitation of an offer, or any advice or recommendation, to purchase any securities or other financial instruments, and may not be construed as such.
Kettera Strategies LLC is a Member of the National Futures Association and registered as a Commodity Pool Operator and only provides services to Accredited Investors who are Qualified Eligible Persons as defined in section 4.7 of the Commodity Exchange Act. This document, any attached document and cover email are being furnished to you on a confidential basis and may not, without prior written consent of Kettera Strategies LLC be (i) copied, photocopied or duplicated in any form, by any means, or (ii) distributed to any person that is not an employee, officer, director, or authorized agent of the intended recipient of this email. This document, and any related documents or emails, are neither offers to sell any securities, nor solicitations of an offer to invest in any fund or product.
For the “style classes” and “baskets” presented in this letter: The “style baskets” referenced above were created by Kettera for research purposes to track the category and are classifications drawn by Kettera Strategies in their review of programs on and for the Hydra Platform. The arrows represent the style basket’s overall performance for the month (e.g. the sideways arrow indicates that the basket was largely flat overall, a solid red down arrow indicates the basket (on average) was largely negative compared to most months, etc.). The “style basket” for a class is created from monthly returns (net of fees) of programs that are either: programs currently or formerly on Hydra; or under review with an expectation of being added to Hydra. The weighting of a program in a basket depends upon into which of these three groups the program falls. Style baskets are not investible products or index products being offered to investors. They are meant purely for analysis and comparison purposes. These also were not created to stimulate interest in any underlying or associated program. Nonetheless, as these research tools may be regarded to be “hypothetical” combinations of managers.
Further notes on Hydra Emerging Manager Basket: Weightings among managers were rebalanced every year, with exceptions for extraordinary events (e.g. the Covid market collapse). Weightings are not discretionary. Manager weightings were not increased over time except for going from a “pending” to a fully “approved” program; weighting reductions only occurred if the manager was de-listed or shut its doors – otherwise the managers stayed as is regardless of performance. Weightings are equal for any approval category: e.g. all fully approved managers may get a X% weighting, regardless of volatility/exposure levels or correlation with other strategies.
Hypothetical performance results have many inherent limitations, some of which are described below. No representation is being made that any product or account will achieve profits or losses similar to those shown. In fact, there are frequently sharp differences between hypothetical performance results and the actual results subsequently achieved by any particular trading program. One of the limitations of hypothetical results is that they are generally prepared with the benefit of hindsight. In addition, hypothetical trading does not involve financial risk, and no hypothetical trading record can completely account for the impact of financial risk in actual trading. There are numerous other factors related to the markets in general or to the implementation of any specific trading program which cannot be fully accounted for in the preparation of hypothetical performance results and all of which can adversely affect actual trading results.
Benchmark sources:
1- With Intelligence Systematic Macro Hedge Fund Index
2- With Intelligence Macro Hedge Fund Index
3- The Societe Generale Trend CTA Index
4- The Societe Generale Short-term Traders Index
5- The Barclay Currency Traders Index
6- Blend of Bridge Alternatives Commodity Hedge Fund Index and BarclayHedge Discretionary Traders Index
7- The Barclay Agricultural Traders Index
8- The Nilsson CTA Commodities Index
9- Blend of With Intelligence Volatility Arbitrage Index and With Intelligence Long Volatility Hedge Fund Index
10- Blend of With Intelligence Institutional Equity Hedge Multi Strategy Index and BarclayHedge Multi Strategy Index
Indices and other financial benchmarks shown are provided for illustrative purposes only, are unmanaged, reflect reinvestment of income and dividends and do not reflect the impact of advisory fees. Index data is reported as of date of publication and may be a month- to-date estimate if all underlying components have not yet reported. The index providers may update their reported performance from time to time. Kettera disclaims any obligation to verify these numbers or to update or revise the performance numbers.
Past performance is not necessarily indicative of future returns.
***
The views expressed in this article are those of the author(s) and do not necessarily reflect the views of AlphaWeek or its publisher, The Sortino Group